Hello everybody… I wonder if you could help me?
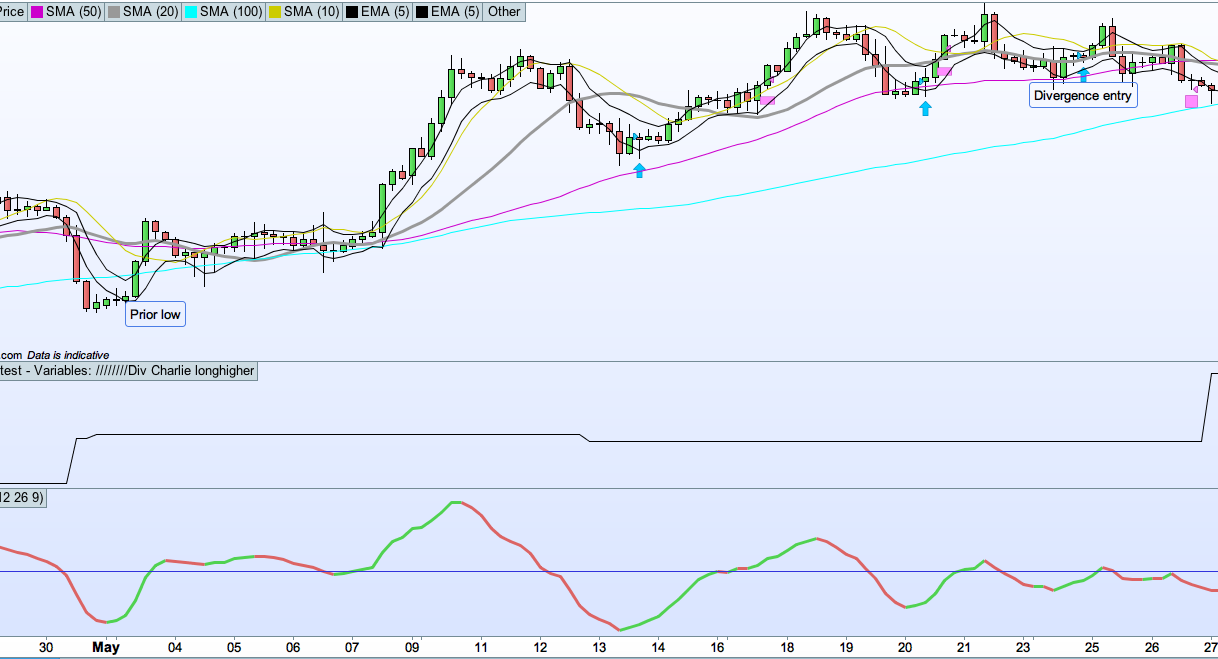
I have some divergence code that looks back a certain number of bars which seems to work okay when I’m comparing a current low that is lower than a previous low, but doesn’t work so well when a current low is higher than a previous low.
My graph command tells me that ‘priorlow’ is 13,801.3 which is nearly a hundred bars back from the current low (the lows are labelled on screengrab), and yet the code only permits a lookback of 30 bars.
I’m wondering if this also has something to do with a market that is constantly rising, but that is just a guess.
Does anyone know how to solve this?
Thank you in advance.
DEFPARAM CumulateOrders = False


back=30

longhigherlow=0

CurLow = lowest[back/2](low)
IF low = CurLow THEN
PriorLow = lowest[back](low[back])
CurMACD  = MACD[12,26,9](close)
FOR i = 0 TO (back - 1)
IF low[i + back] = PriorLow THEN
PriorMACD = MACD[12,26,9](close)[i + back]
PriorBAR  = BarIndex[i + back]
Break
ENDIF
NEXT
ENDIF

macconflong= CurMACD < PriorMACD

c1 = Curlow > PriorLow
c2 = Curlow =lowest[3](low)
c3 = close < ExponentialAverage[5](high) and close > ExponentialAverage[5](low)
c6 = macconflong

longhigherlow= c1 and c2 and c3 and c6


Limitbuy=close-5

if not onmarket and longhigherlow=1 then
sl=abs(close-lowest[5](low))*Vlstop
tp=sl * VLtake
Set target profit tp
Set stop loss sl
BUY 1 PERPOINT AT Limitbuy STOP
longhigherlow=0
endif


graph priorlow
I did not test it, but it seems you are referencing BACK, while you should reference HALF (if I got what you meant to achieve):
DEFPARAM CumulateOrders = False
back=30
half=round(back/2)
longhigherlow=0
CurLow = lowest[half](low)
IF low = CurLow THEN
PriorLow = lowest[half](low[half])
CurMACD  = MACD[12,26,9](close)
FOR i = 0 TO (half - 1)
IF low[i + half] = PriorLow THEN
PriorMACD = MACD[12,26,9](close)[i + half]
PriorBAR  = BarIndex[i + half]
Break
ENDIF
NEXT
ENDIF
macconflong= CurMACD < PriorMACD
c1 = Curlow > PriorLow
c2 = Curlow =lowest[3](low)
c3 = close < ExponentialAverage[5](high) and close > ExponentialAverage[5](low)
c6 = macconflong
longhigherlow= c1 and c2 and c3 and c6
Limitbuy=close-5
if not onmarket and longhigherlow=1 then
sl=abs(close-lowest[5](low))*Vlstop
tp=sl * VLtake
Set target profit tp
Set stop loss sl
BUY 1 PERPOINT AT Limitbuy STOP
longhigherlow=0
endif
graph priorlow
Thanks for your suggestion, Roberto. It changes things slightly, but doesn’t solve the problem. Priorlow now refers to a bar which is 90 back from the current low, which is not the intention of the code.
I notice that when I reduced the lookback to 28 it found a much more recent low on May14 (where the leftmost blue arrow is on the original screengrab). I hope this helps.
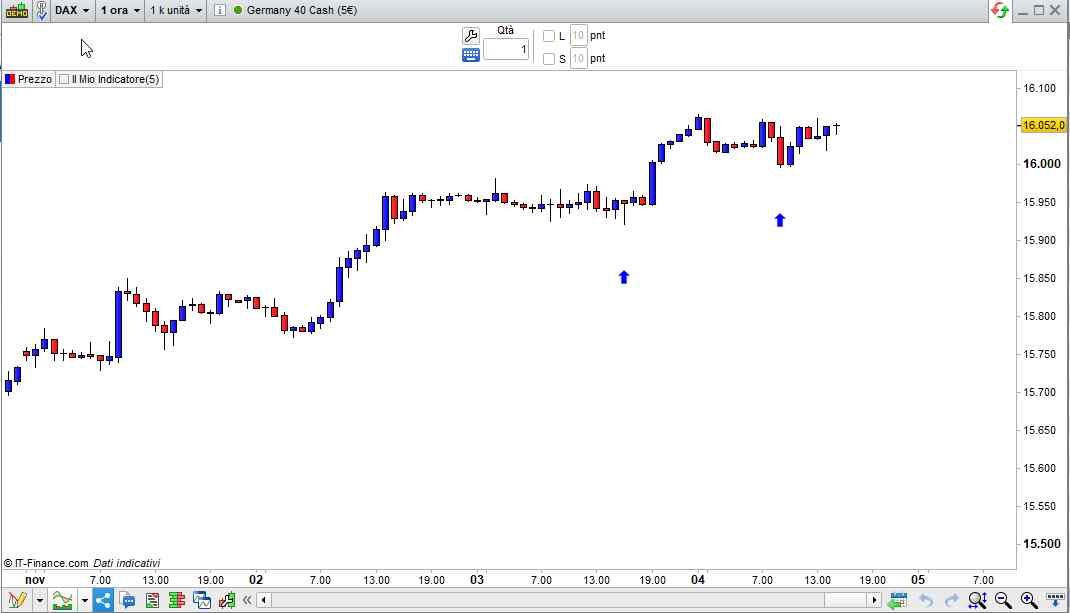
Add this indicator to your chart (see attached screenshot):
DEFPARAM DrawOnLastBarOnly = true
ONCE PriorLow = 0
ONCE PriorBar = 0
ONCE CurLow   = 0
ONCE CurBar   = 0
ONCE back     = 30
ONCE half     = round(back/2)
longhigherlow=0
CurLow       = lowest[half](low)
FOR j = 0 TO Half - 1
   IF low[j] = CurLow THEN
      CurBar  = BarIndex[j]
      CurMACD  = MACD[12,26,9](close)[j]
      //PriorLow = lowest[half](low[half])
      PriorLow = lowest[half](low[Half])
      FOR i = Half TO Back-1
         IF low[i] = PriorLow THEN
            PriorMACD = MACD[12,26,9](close)[i]
            PriorBAR  = BarIndex[i]
            Break
         ENDIF
      NEXT
      Break
   ENDIF
NEXT
DrawArrowUP(PriorBar,PriorLow - highest[5](range)*2) coloured(0,0,255,255)
DrawArrowUP(CurBar,CurLow - highest[5](range)*2) coloured(0,0,255,255)
RETURN
This is the code for the strategy (I could just test it for syntax errors only):
DEFPARAM CumulateOrders = False
ONCE VLstop   = 1
ONCE VLtake   = 2
ONCE PriorLow = 0
ONCE PriorBar = 0
ONCE CurLow   = 0
ONCE CurBar   = 0
ONCE back     = 30
ONCE half     = round(back/2)
longhigherlow=0
CurLow       = lowest[half](low)
FOR j = 0 TO Half - 1
   IF low[j] = CurLow THEN
      CurBar  = BarIndex[j]
      CurMACD  = MACD[12,26,9](close)[j]
      PriorLow = lowest[half](low[Half])
      FOR i = Half TO Back-1
         IF low[i] = PriorLow THEN
            PriorMACD = MACD[12,26,9](close)[i]
            PriorBAR  = BarIndex[i]
            Break
         ENDIF
      NEXT
      Break
   ENDIF
NEXT
macconflong= CurMACD < PriorMACD
c1 = Curlow > PriorLow
c2 = Curlow =lowest[3](low)
c3 = close < ExponentialAverage[5](high) and close > ExponentialAverage[5](low)
c6 = macconflong
longhigherlow= c1 and c2 and c3 and c6
Limitbuy=close-5
if not onmarket and longhigherlow=1 then
   sl=abs(close-lowest[5](low))*Vlstop
   tp=sl * VLtake
   Set target profit tp
   Set stop loss sl
   BUY 1 PERPOINT AT Limitbuy STOP
endif
graphonprice priorlow coloured(255,0,0,255)
graphonprice curlow   coloured(0,128,0,155)
Thank you Roberto! 🙂
On first look, the code looks like it is working properly. I will do a longer check tomorrow.
Hey Roberto,
The code looks great, but I can’t get the indicator to work. When I add it, it simply creates a blank box under the chart with a scale on the right-hand side…. no arrows appear on the chart. Are there other settings I need to tweak in order to get it to appear on the chart?
Add it ON your chart, not UNDER.
You have to click the PRICE tag on the top left corner of your chart, then select ADD INDICATOR and choose from the list.
Ah okay, thanks – I’ve added it to the right place now.
Currently I only see the indicator arrows at the most recent bar range. Is it possible to make the indicator return them multiple times going back months or years?
I’m sorry if these are very basic questions, but I’ve never programmed an indicator before. I’ve had a look in the manual and tried a few things but I can’t get them to work. It’d be great if I could see all the instances of new curlows and new priorlows.
Thanks.
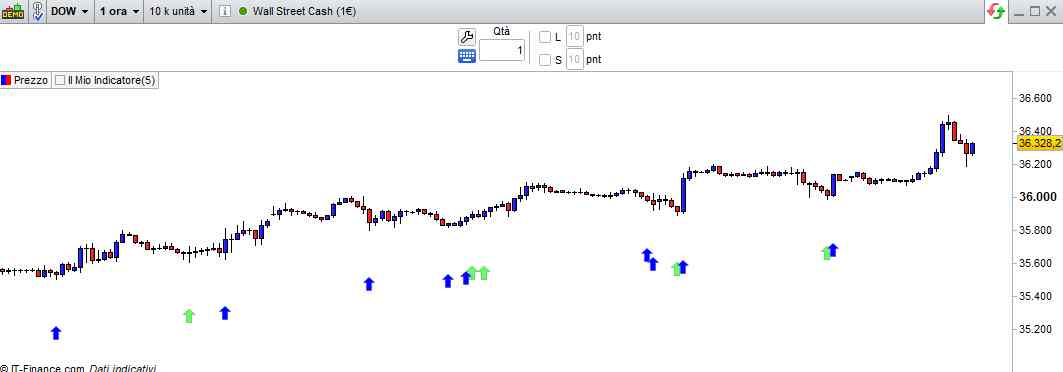
You can use this version, but the output is not so tidy:
DEFPARAM DrawOnLastBarOnly = true
ONCE PriorLow = 0
ONCE PriorBar = 0
ONCE CurLow   = 0
ONCE CurBar   = 0
ONCE back     = 30
ONCE half     = round(back/2)
ONCE MaxLows  = 50            //plot no more than these many arrow pairs
IF BarIndex = 0 THEN
   FOR k = 1 TO MaxLows
      $PriorL[k] = 0
      $PriorB[k] = 0
      $CurL[k]   = 0
      $CurB[k]   = 0
   NEXT
ENDIF
longhigherlow=0
CurLow       = lowest[half](low)
FOR j = 0 TO Half - 1
   IF low[j] = CurLow THEN
      CurBar  = BarIndex[j]
      CurMACD  = MACD[12,26,9](close)[j]
      PriorLow = lowest[half](low[Half])
      FOR i = Half TO Back-1
         IF low[i] = PriorLow THEN
            PriorMACD = MACD[12,26,9](close)[i]
            PriorBAR  = BarIndex[i]
            IF CurLow <> CurLow[1] AND PriorLow <> PriorLow[1] THEN //shift previous data 1 place backwards
               FOR k = MaxLows DOWNTO 2
                  $PriorL[k] = $PriorL[k - 1]
                  $PriorB[k] = $PriorB[k - 1]
                  $CurL[k]   = $CurL[k - 1]
                  $CurB[k]   = $CurB[k - 1]
               NEXT
               $PriorL[1] = PriorLow                                //add a new #1 set of data
               $PriorB[1] = PriorBar
               $CurL[1]   = CurLow
               $CurB[1]   = CurBAR
            ENDIF
            Break
         ENDIF
      NEXT
      Break
   ENDIF
NEXT
FOR k = 1 TO MaxLows
   IF $CurB[k] <> 0 THEN    //plot only if there's data in it
      pl = $PriorL[k]
      pb = $PriorB[k]
      cl = $CurL[k]
      cb = $CurB[k]
      DrawArrowUP(pb,pl - highest[5](range)*2) coloured(0,255,0,155)  //GREEN = prior low
      DrawArrowUP(cb,cl - highest[5](range)*2) coloured(0,0,255,255)  //BLUE  = current low
   ENDIF
NEXT
RETURN
Oh wow! This is brilliant!!
I’ve adapted it so it only shows arrows when my price-action entry criteria is met, so now the chart doesn’t look so crowded. This is going to save me a lot of time when I cross-check the validity of my divergence parameters (I think they are entering a bit too often using lows that are not significant enough).
Thank you so much Roberto 🙂
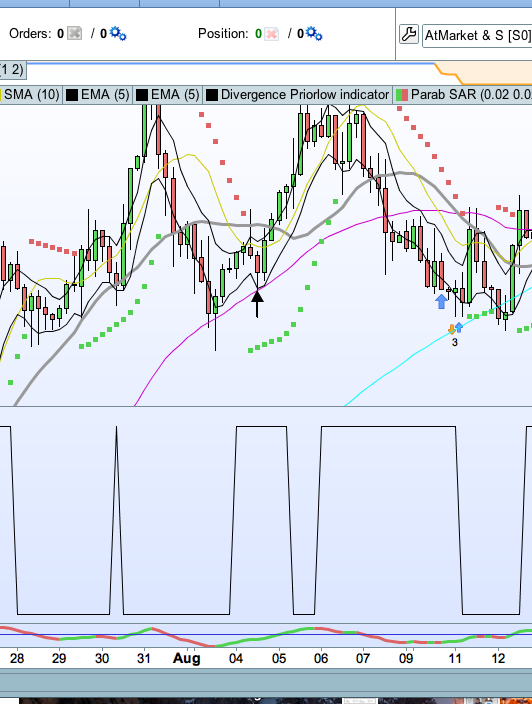
I hope this is the final thing on this, Roberto 🙂
I’ve decided to use the PSAR as a way of improving the accuracy of priorlow. I want priorlow to be less than the PSAR in order to allow for an entry but I can’t do it with the code “priorlow < SAR[0.02,0.02,0.2][back]” “priorlow < SAR[0.02,0.02,0.2]”. I assume this is because the priorlow is derived from a lowest bar in a range (which could be bar 26 or whatever) rather than simply the absolute value of the 30th bar back.
How would I do this?
Thank you again.
(I’ve attached a screengrab which graphs “priorlow < SAR[0.02,0.02,0.2][back]” with a black arrow denoting the priorlow bar)
DEFPARAM CumulateOrders = False
ONCE VLstop   = 1
ONCE VLtake   = 2
ONCE PriorLow = 0
ONCE PriorBar = 0
ONCE CurLow   = 0
ONCE CurBar   = 0
ONCE back     = 30
ONCE half     = round(back/2)
longhigherlow=0
CurLow       = lowest[half](low)
FOR j = 0 TO Half - 1
IF low[j] = CurLow THEN
CurBar  = BarIndex[j]
CurMACD  = MACD[12,26,9](close)[j]
PriorLow = lowest[half](low[Half])
FOR i = Half TO Back-1
IF low[i] = PriorLow and low[i] THEN
PriorMACD = MACD[12,26,9](close)[i]
PriorBAR  = BarIndex[i]
Break
ENDIF
NEXT
Break
ENDIF
NEXT
macconflong= CurMACD < PriorMACD
c1 = Curlow > PriorLow
c2 = Curlow =lowest[3](low)
c3 = close < ExponentialAverage[5](high) and close > ExponentialAverage[5](low)

c6 = macconflong
longhigherlow= c1 and c2 and c3 and c6
Limitbuy=close-5
if not onmarket and longhigherlow=1 and priorlow < SAR[0.02,0.02,0.2][back] then
sl=abs(close-lowest[5](low))*Vlstop
tp=sl * VLtake
Set target profit tp
Set stop loss sl
BUY 1 PERPOINT AT Limitbuy STOP
endif

graph priorlow < SAR[0.02,0.02,0.2][back]
 pror
prorParticipant
Veteran
The SAR repainted, be careful for an intraday condition
What is “and low[i]” for, in line 18?
Hey Roberto,
That’s actually there in error, but it doesn’t make any difference. I’ve deleted it since. I worked out that using [i] was what I needed to do in order to measure the priorlow bar against something else, and I think that I’ve got it working okay…. I hope! 🙂