Hello,
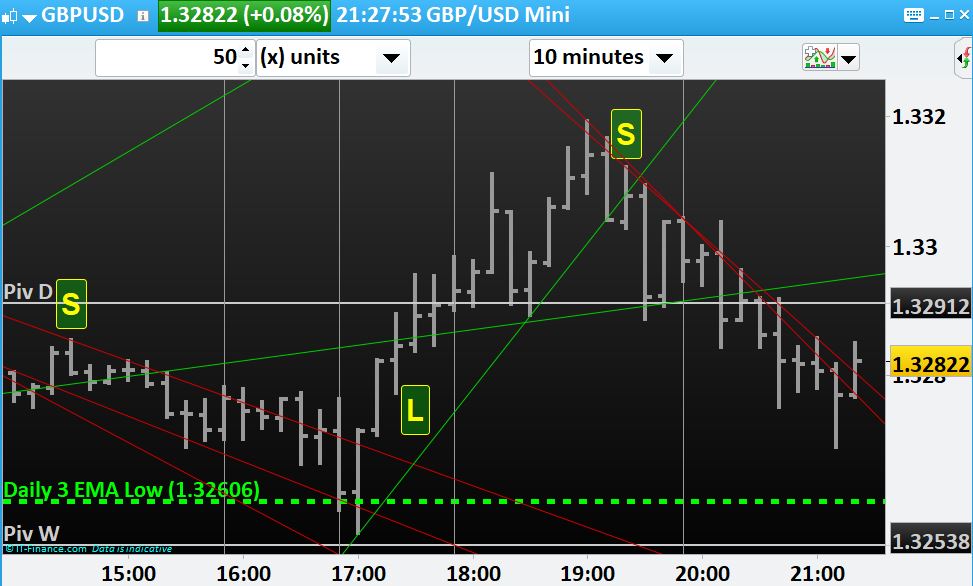
I have identified the Peaks and Troughs as per the enclosed code.
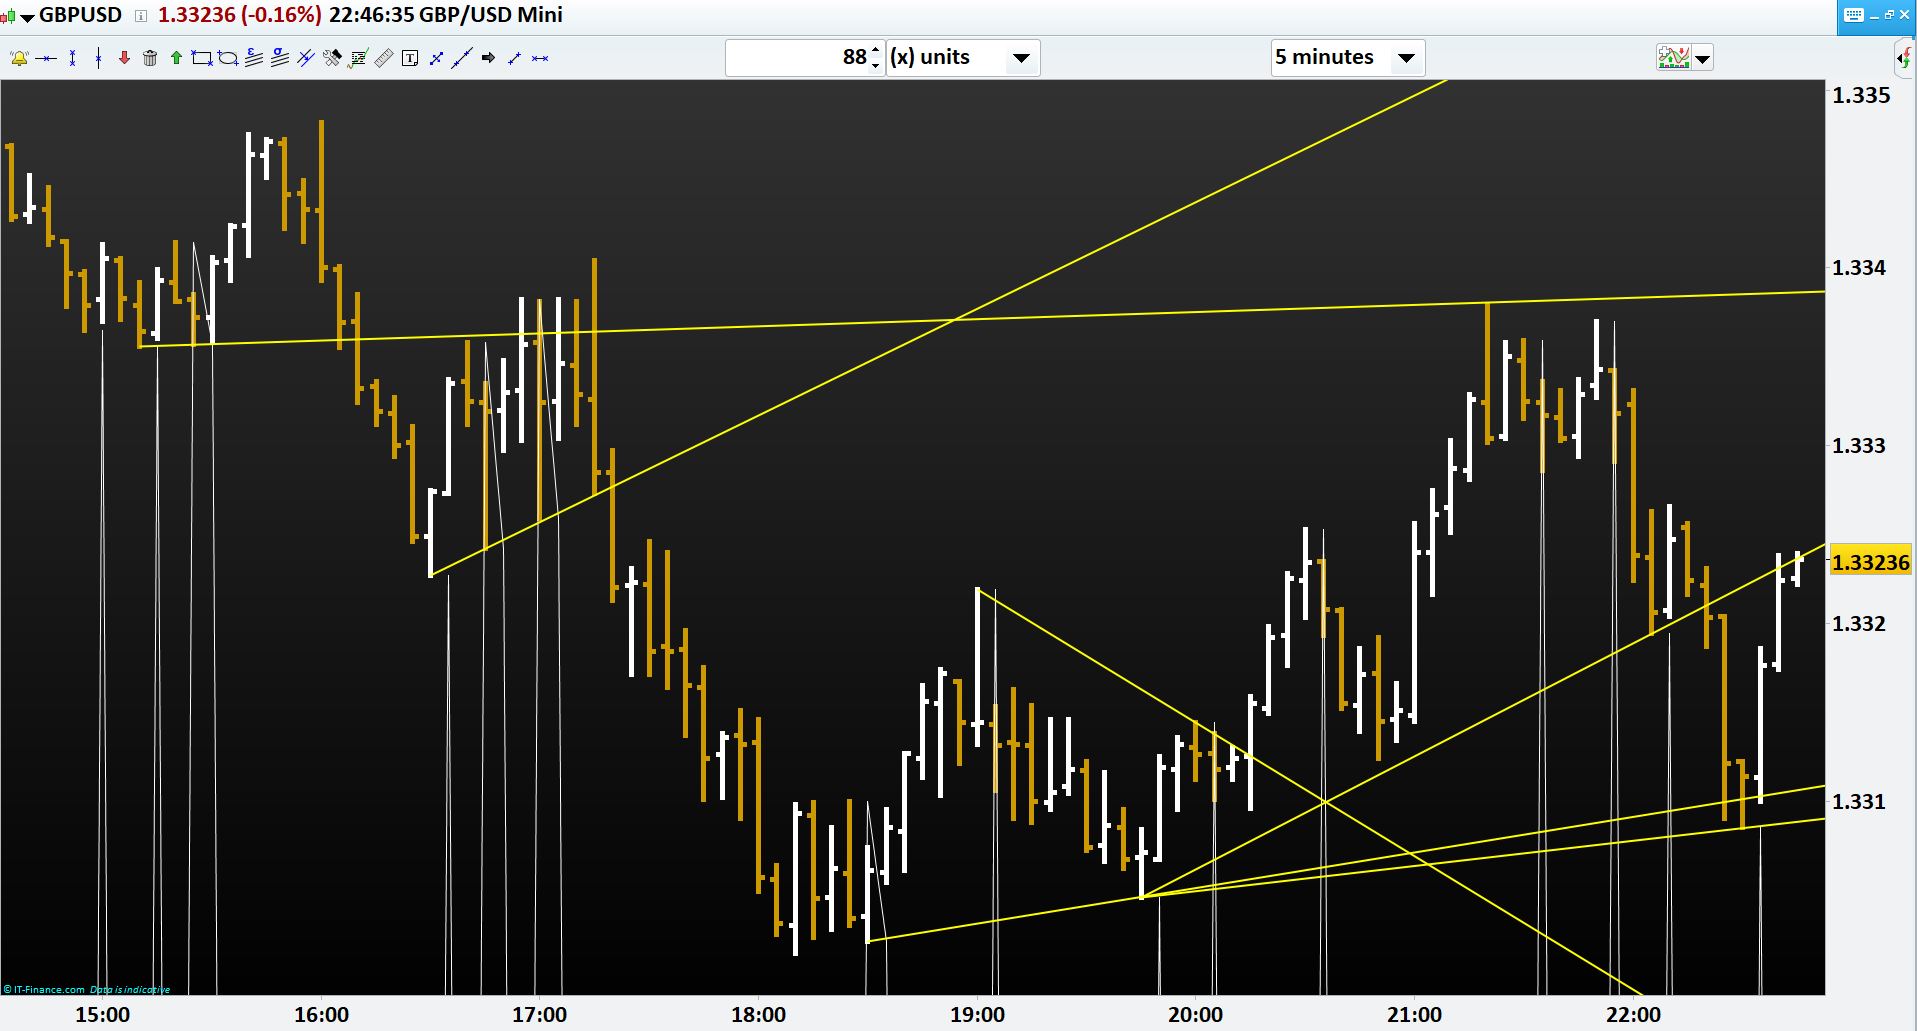
Now , if I want to join the 2 higher high troughs and 2 lower low peaks within a timeframe (e.g. from 15:00 to 23:00) how to do it?
Example is enclosed where manual trend lines are drawn between the said period.
Any help would be highly appreciated.
Regards,
//VARIABLES
//x = 500
H2=high[2]
H1=HIGH[1]
H0=HIGH[0]
L2=LOW[2]
L1=LOW[1]
L0=LOW[0]
P=PIPSIZE
//PEAK
iF H1>H2 and L1>L2 and H0<H1 AND L0<L1 AND CLOSE<H1 then
TT=H1
//TROUGH
elsiF H1<H2 and L1<L2 and H0>H1 AND L0>L1 AND CLOSE>L1 then
TT=L1
ELSE
TT=L0-X*P
ENDIF

return TT AS "PT"
Any help would be highly appreciated, please.
You need to give high TT’s and the low TT’s different names and store the previous value when a new value is recorded. You also need to store the barindex.
Something like this perhaps. Not tested.
//VARIABLES
H2=high[2]
H1=HIGH[1]
H0=HIGH[0]
L2=LOW[2]
L1=LOW[1]
L0=LOW[0]

//PEAK
iF H1>H2 and L1>L2 and H0<H1 AND L0<L1 AND CLOSE<H1 then
lasthtt = htt
lasthttbar = httbar
htt=H1
httbar = barindex[1]

if lasthttbar <> lasthttbar[1] then
DRAWLINE(lasthttbar,lasthtt,httbar,htt) COLOURED(0,128,0)
endif
endif

//TROUGH
iF H1<H2 and L1<L2 and H0>H1 AND L0>L1 AND CLOSE>L1 then
lastltt = ltt
lastlttbar = lttbar
ltt=L1
lttbar = barindex[1]

if lastlttbar <> lastlttbar[1] then
DRAWLINE(lastlttbar,lastltt,lttbar,ltt) COLOURED(128,0,0)
endif
endif

return
VERY HELPFUL Vonasi.
Much appreciated.
Many thanks for your time and effort.
Regards,
Hello Vonasi,
Is it possible not to extend the line to its left? if yes then how please? and if I want the line to be drawn for today’s peaks and troughs only then should I check “if date=today”?
Regards,
That’s possible but only with PRT v11 and the DRAWRAY instruction.
defparam calculateonlastbars=300

//VARIABLES
H2=high[2]
H1=HIGH[1]
H0=HIGH[0]
L2=LOW[2]
L1=LOW[1]
L0=LOW[0]

//PEAK
iF H1>H2 and L1>L2 and H0<H1 AND L0<L1 AND CLOSE<H1 then
lasthtt = htt
lasthttbar = httbar
htt=H1
httbar = barindex[1]

if lasthttbar <> lasthttbar[1] then
DRAWRAY(lasthttbar,lasthtt,httbar,htt) COLOURED(0,128,0)
endif
endif

//TROUGH
iF H1<H2 and L1<L2 and H0>H1 AND L0>L1 AND CLOSE>L1 then
lastltt = ltt
lastlttbar = lttbar
ltt=L1
lttbar = barindex[1]

if lastlttbar <> lastlttbar[1] then
DRAWRAY(lastlttbar,lastltt,lttbar,ltt) COLOURED(128,0,0)
endif
endif

return
Try this for just drawing the latest lines:
As Nicolas says you need DRAWRAY and v11 to get rid of the bit of line to the left.
defparam drawonlastbaronly = true

//VARIABLES
H2=high[2]
H1=HIGH[1]
H0=HIGH[0]
L2=LOW[2]
L1=LOW[1]
L0=LOW[0]

//PEAK
iF H1>H2 and L1>L2 and H0<H1 AND L0<L1 AND CLOSE<H1 then
lasthtt = htt
lasthttbar = httbar
htt=H1
httbar = barindex[1]
endif

DRAWLINE(lasthttbar,lasthtt,httbar,htt) COLOURED(0,128,0)

//TROUGH
iF H1<H2 and L1<L2 and H0>H1 AND L0>L1 AND CLOSE>L1 then
lastltt = ltt
lastlttbar = lttbar
ltt=L1
lttbar = barindex[1]
endif

DRAWLINE(lastlttbar,lastltt,lttbar,ltt) COLOURED(128,0,0)

return
Many thanks Vonasi and Nicolas. Much appreciated.
I have modified the code, but could not set alarm as it is not identifying the lines’ value correctly,
Is it possible to fix it?
//VARIABLES
// ST= 90000, ET=240000
H2=high[2]
H1=HIGH[1]
H0=HIGH[0]
L2=LOW[2]
L1=LOW[1]
L0=LOW[0]

//PEAK
iF H1>=H2 and L1>=L2 and H0<H1 AND L0<=L1 THEN//AND CLOSE<H1 then
IF TIME>ST AND TIME<ET and date=today THEN
lasthtt = htt
lasthttbar = httbar
htt=H1
httbar = barindex[1]

if lasthttbar <> lasthttbar[1] then
IF TIME>ST AND TIME<ET and date=today THEN
IF htt<Htt[1] THEN
DRAWLINE(lasthttbar,lasthtt,httbar,htt) COLOURED(205,0,0)
endif
ENDIF
endif
ENDIF
ENDIF
//TROUGH
iF H1<H2 and L1<L2 and H0>=H1 AND L0>=L1 THEN//AND CLOSE>L1 then
IF TIME>ST AND TIME<ET and date=today THEN
lastltt = ltt
lastlttbar = lttbar
ltt=L1
lttbar = barindex[1]

if lastlttbar <> lastlttbar[1] then
IF TIME>ST AND TIME<ET and date=today THEN
IF Ltt>Ltt[1] THEN
DRAWLINE(lastlttbar,lastltt,lttbar,ltt) COLOURED(0,205,0)
endif
ENDIF
endif
ENDIF
ENDIF
return
You cannot set an alarm to detect lines drawn in a custom indicator. You will need to calculate the projected forward line value for each bar moving forward by subtracting the lower point value from the higher point value and dividing by the number of bars between them, then add this on to the most recent value for each bar moving forward.
Once you know this value you can test to see if close is above or below it etc.
One downside of this calculation is if you use a time frame with missing bars as these can cause steps in the forward calculation.
An example of this sort of calculation can be found here:
Last Two Pivots Support and Resistance Lines
In fact it might be easier for you just to adapt that indicator to do what you want.
Many thanks Vonasi. 2nd example is a brilliant one.
Dear Vonasi, in your last example (https://www.prorealcode.com/prorealtime-indicators/last-two-highest-high-and-lowest-low-lines-yearly-quarterly-monthly-weekly-daily-4-hour-and-1-hour/) you have drawn lines without extending to the left and without “DRAWRAY”. So if that is possible in your example, why can’t we do the same to my indicator (with your help) please?
The lines are segments, not extending on the left or the right.
Replace DRAWLINE with DRAWSEGMENT.
You are right Nicolas. When can we have “Style” with DRAWLINE and DRAWSEGMENT to increase line thickness? Is Style available with DRAWRAY?
Graphical objects can be styled, but only with PRT v11.