Hello,
This V2 version of Trend Line Fibonacci is much better working than the V1.
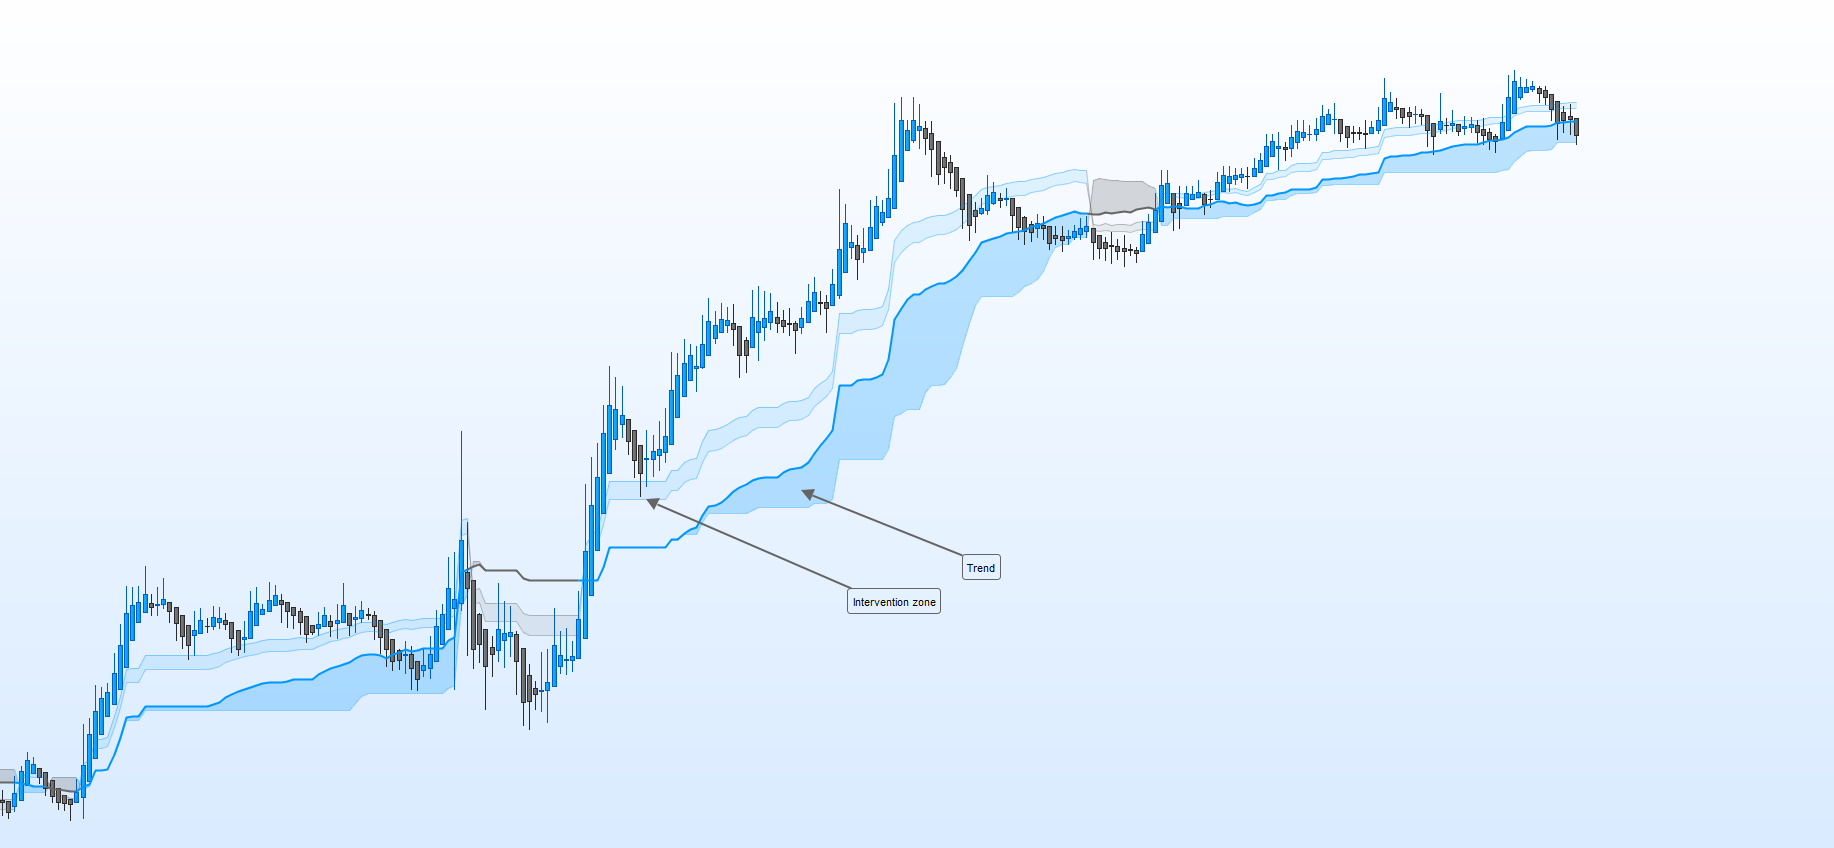
The idea remains the same
The trend is calculated with the highest is the lowest of the 50 and 61 periods.
The area of intervention corresponds to the retracement of the highest reached on the trend at the level of 23.60% and is half between 50% and 23.60%.
the area of intervention is not used alone, this remains an indicator, but if the area corresponds to a level of fibonacci pivot point, then a rebound is possible
link from V1 : https://www.prorealcode.com/prorealtime-indicators/trend-line-fibonacci/
//
//=/===============/=//=/===============/=//=/ Indicateur Trend Line
//


//=/ Heikin Ashi
if barindex>1 then
haclose=(open+close+low+high)/4
haopen=(haopen[1]+haclose[1])/2
xHigh = Max(haOpen, haClose)
xLow = Min(haOpen, haClose)
hahigh = Max(High,xHigh)
halow = Min(Low,xLow)
endif


//
//=/===============/=//=/===============/=//=/ Zone de Pivot
//


//=/ Pivot 23
P23 = (highest[23](hahigh)+lowest[23](halow)) /2


//=/ Pivot 38
P38 = (highest[38](hahigh)+lowest[38](halow)) /2


//=/ Pivot 50
P50 = (highest[50](hahigh)+lowest[50](halow)) /2


//=/ Pivot 23
P61 = (highest[61](hahigh)+lowest[61](halow)) /2


//=/ Pivot Majeur
POptimal = (P23+P38+P50+P61)/4

//
//=/===============/=//=/===============/=//=/ Zone Extreme
//


//=/ Extreme Haut
if P23 => P38 and P23 => P50 and P23 => P61 then
EHaut = P23
//=//
elsif P38 => P23 and P38 => P50 and P38 => P61 then
EHaut = P38
//=//
elsif P50 => P23 and P50 => P38 and P50 => P61 then
EHaut = P50
//=//
elsif P61 => P23 and P61 => P38 and P61 => P50 then
EHaut = P61
endif


//=/ Extreme Bas
if P23 =< P38 and P23 =< P50 and P23 =< P61 then
EBas = P23
//=//
elsif P38 =< P23 and P38 =< P50 and P38 =< P61 then
EBas = P38
//=//
elsif P50 =< P23 and P50 =< P38 and P50 =< P61 then
EBas = P50
//=//
elsif P61 =< P23 and P61 =< P38 and P61 =< P50 then
EBas = P61
endif


//=/ Point de Tendance
if haclose > EHaut and haclose > EBas then
PT = 1
//=//
elsif haclose < EHaut and haclose < EBas then
PT = -1
endif
//=//
if PT = 1 then
PTendance = EBas
//=//
elsif PT = -1 then
PTendance = EHaut
endif

//
//=/===============/=//=/===============/=//=/ Zone d'Intervention
//


//=/ Decompte Haussier
DH = 0
//=//
if PT = 1 then
DH = DH[1]+1
endif


//=// 50%
if PT = 1 then
ZINT = ((highest[DH](high)+POptimal)/2)
endif


//=/ 38.20
if PT = 1 then
Z38 = ZINT - 0.236 * (highest[DH](high)-POptimal)
endif


//=/ 23.60
if PT = 1 then
Z23 = ZINT - 0.132 * (highest[DH](high)-POptimal)
endif


//=/ Decompte Baissier
DB = 0
//=//
if PT = -1 then
DB = DB[1]+1
endif


//=// 50 %
if PT = -1 then
ZINT = (POptimal+lowest[DB](low))/2
endif


//=/ 38.20
if PT = -1 then
Z38 = ZINT + 0.264 * (POptimal-lowest[DB](low))
endif


//=/ 23.60
if PT = -1 then
Z23 = ZINT + 0.132 * (POptimal-lowest[DB](low))
endif


//
//=/===============/=//=/===============/=//=/ Coloration des ligne
//

//=/ Ratio de 23
if PT = 1 then
R = 0
G = 150
B = 255
T = 100
//=//
elsif PT = -1 then
R = 102
G = 102
B = 102
T = 100
endif

return PTendance coloured(R,G,B,T) style (line,1) as "Tendance", POptimal coloured(R,G,B,255) style (line,2) as "Optimal", Z38 coloured(R,G,B,T) style (line,1) as "ZT1", Z23 coloured(R,G,B,T) style (line,1) as "ZT2"
You are brillant! Thank you.
Simple question about all of theses indicators, are you a Scalper?
Have a great Sunday
Maxime
Maybe not as much, but thank you x)
No the scalping, I leave it to Benoist Rousseau!
I create indicators to be able to do backtests and create possible trading strategies manually for intraday trading.
You develop indicators and systems that 90% and more of the profession are not able to do! 🙂 So yes you are at least a bit!
In any case. your work is very interesting, I find that contrary to what I have seen for a few years here, your indicators and maybe system tend to be able to understand a little bit better the “Depth of the market”, which is less common here
I specifically liked your “Trend Line Fibonacci indicator” with a kind of background cloud of bullish and bearish trends protected by a cloud of “trend revival” or trend breakout in progress
For example in Timeframe 8 hours on EUR/USD, it is interesting to see how well prices react to your clouds, and that during a trend, such as the downtrend on EUR/USD, prices tend to announce the breakout of a cloud by scoring higher and higher lows, allowing you to tackle the underlying trend cloud.
This gives a lot of information that many indicators are not able to give. So thank you very much, really appreciated
This indicator is interesting by the values that are incremented, they refer to the fibonacci sequence.
These are values recognised in the stock market world and therefore they are self-realising 😉
For a possible update, if you have suggestions…
Also, some are very competent on ProRealCode and certainly more competent than me in this field.
Simply, most of them do not share their work, and for good reason, the hours spent racking their brains!
Nicolas is going to solve this with the MarketPlace and I am sure we will be amazed at the sharing we will find there!
 Razz
RazzParticipant
Master
Good morning IV Mcm
Thank you for sharing your indicator, I hope that the MarketPlace will finally open, only now I don’t believe in it anymore I’ve been waiting for it for over a year! I would like to pay for an indicator and thus reward the inventor’s work. I am already looking forward to seeing your indicators in the MarketPlace. Until then, wish you all the best.
Peter
You know, it takes a certain amount of time to create a MarketPlace.
Notably, some problems can occur along the way without the creator being the cause, and therefore take longer than expected when things are no longer up to you!
But I am sure that this project will come to an end.
It is interesting to see that most effective systems have a direct or indirect link to the golden ratio, just like flowers, architecture, art, and finally the universe
Hello IV, I hope you have a great weekend, can you confirm me that if Z23 corresponds to 23%, that Z38 corresponds to 38% retracement, that the value “POptimal” is a 50% retracement?
Have a great week!
Hello IV, I hope you have a great weekend, can you confirm me that if Z23 corresponds to 23%, that Z38 corresponds to 38% retracement, that the value “POptimal” is a 50% retracement?
Have a great week!
Oh no, I’m talking nonsense, I just understood 🙂
Here’s what I wanted to do, I added a line drawing the 50%, more precise for me 🙂
The indicators that I provide are only a base
A trader uses technical analysis to make a profit, this method is universal in the markets because it reflects the psychology of the players.
An indicator is only a calculation and therefore, it will not have the same relevance from one market to another, so indeed, it is better to do a backtest work to see at which value the market in question works best for this or that indicator 😉
Hello, Small remark in the calculation Z38 and Z23, in the cases where PT = +1 or -1. ZINT would correspond to a 50% curve. In this case we should have:
//=/ 38.2
if PT = -1 then
Z38 = ZINT + 0.120 * (POptimal-lowest[DB](low))
endif

//=/ 23.60
if PT = -1 then
Z23 = ZINT + 0.264 * (POptimal-lowest[DB](low))

//=/ 38.2
if PT = +1 then
Z38 = ZINT - 0.118 * (POptimal-lowest[DB](low))
endif

//=/ 23.60
if PT = +1 then
Z23 = ZINT - 0.264 * (POptimal-lowest[DB](low))
For 38.2% => 0.5 – 0.382 = 0.118
For 23.6% => 0.5 – 0.236 = 0.264
Your opinion Maxime?
Maybe there is an error, I will check the code is released an update