Translation of “Trendline Breakouts With Targets” from TV

Viewing 8 posts - 1 through 8 (of 8 total)
  • Author
    Posts
  • #240695 quote
    roccafragius
    Participant
    Junior

    Hello Ivan

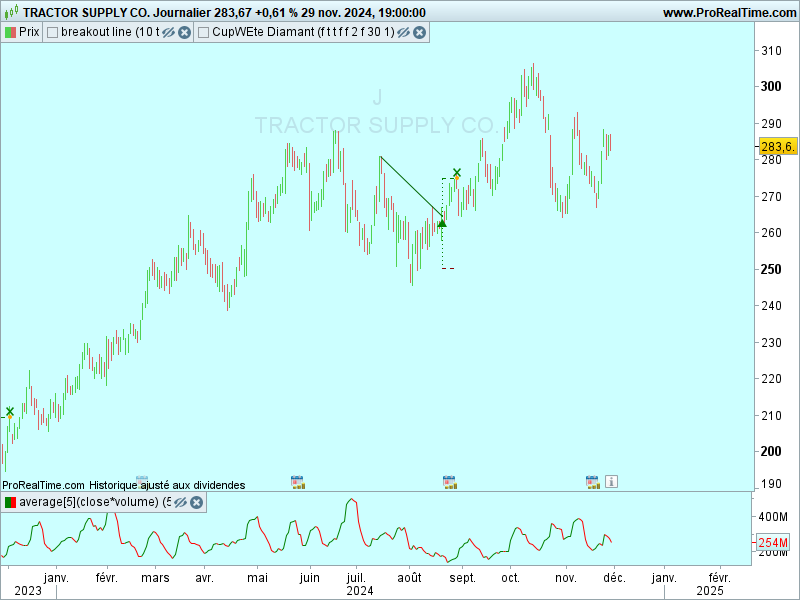
    I see in Trading View and indicator that I think it is very useful on the low time frame, it indicates you the trendline and the brekout. I would like use this strategy with also your Indicator on Support / Demand. So whne the price arrive on a Support ( for example) timeframe 15m, and I see a brekout of tredinline 1 minute the bias is very High!

    I post here the TV code of “Trendline Breakouts With Targets”, please could you translate it in PRT?

    Thank you in advance! 🙂

    Franco


    // This source code is subject to the terms of the Mozilla Public License 2.0 at https://mozilla.org/MPL/2.0/
    // © ChartPrime
    //@version=5
    indicator(“Trendline Breakouts With Targets [ Chartprime ]”,shorttitle = “TBT [ Chartprime ]”,overlay = true,max_bars_back = 500,max_lines_count = 500)
    bool ChartTime              = time > chart.left_visible_bar_time and time < chart.right_visible_bar_time
    string CORE                 =  “➞ Core Settings 🔸”
    var bool TradeisON          = false
    var bool LongTrade          = false
    var bool ShortTrade         = false
    var float TP                = 0.0
    var float SL                = 0.0
    int BarTIME                 = time – time[1]
    var line tpLine             = na
    var label LAB               = na
    var int UpdatedX            = 0
    var float UpdatedY          = 0.0
    var float UpdatedSLP        = 0.0
    var int UpdatedXLow         = 0
    var float UpdatedYLow       = 0.0
    var float UpdatedSLPLow     = 0.0
    int Period          = input.int(10, title=’     Period     ➞’,
         group = CORE,
         inline = “001”)
    bool Trendtype      = input.string(title = “     Type        ➞”,
          defval=’Wicks’,
          options=[‘Wicks’, ‘Body’],
          group = CORE,
          inline = “001”)
           == ‘Wicks’
    stringExtensions   =input.string(title=’     Extend    ➞’,
         defval=’  25′,
         options=[‘  25’, ‘  50’, ‘  75’],
         group = CORE,
         inline = “001”)
    color LineCol1 = input.color(color.rgb(109, 111, 111, 19),””,group = CORE,inline = “001”)
    bool ShowTargets = input.bool(true,”Show Targets”,group = CORE,inline = “002”)
    ExtenSwitcher(ex) =>
        switchex
            ‘  25’ => 1 ,
            ‘  50’ => 2 ,
            => 3
    WidthSwitcher(ex) =>
        switchex
            ‘1’ => 1 ,
            ‘2’ => 2 ,
            =>3
    StyleSwitcher(style) =>
        switchstyle
            ‘Dashed’ => line.style_dashed ,
            ‘Dotted’ => line.style_dotted ,
            =>line.style_solid
    method volAdj(int len)=>
        math.min(ta.atr(len) * 0.3, close * (0.3/100)) [20] /2
    Zband = volAdj(30)
    method Trendlines(float src, int timeIndex,bool dir) =>
        var int Start = 1 , var int End = 0 , var int TIME = 1
        var float YEnd = 0, var float YStart = 0 , var float Slope = 0
        var line Line1 = line.new(na,na,na,na)
        var line Line2 = line.new(na,na,na,na)
        var line Line3 = line.new(na,na,na,na)
        SCR = fixnan(src)
        if ta.change(SCR) != 0
            TIME := time[timeIndex]
            YStart := SCR[1]
            Start := TIME[1]
            Slope := (SCR – YStart) / (TIME – Start)
            Slope
        EXTime = ExtenSwitcher(Extensions) * BarTIME * 25
        End := TIME + EXTime
        YEnd := SCR + EXTime * Slope
        if ta.change(SCR) != 0 and not TradeisON[1]
            LineCond = Slope * time < 0 ? dir ? na : color.rgb(11, 139, 7, 53) : dir ?  color.rgb(212, 46, 0, 54) : na
            if not na(LineCond) //and ChartTime
                Line1 := line.new(Start,
                     YStart,
                     End,
                     YEnd,
                     xloc.bar_time,
                     extend.none,
                     color=color.new(color.white,100)
                     )
                Line2:=line.new(Start,
                     YStart – (Zband * 2),
                     End,
                     YEnd – (Zband * 2),
                     xloc.bar_time,
                     extend.none,
                     color=color.new(color.black,100)
                     )
                Line3:=line.new(Start,
                     YStart – (Zband * 1),
                     End,
                     YEnd – (Zband * 1),
                     xloc.bar_time,
                     extend.none,
                     color=color.new(color.black,100)
                     )
                linefill.new(Line3,Line2,color= LineCol1)
                linefill.new(Line3,Line1,color= LineCond)
                // linefill.new(Line,Line2,color= color.rgb(28, 15, 2, 76))
        [Start, YStart, Slope]
    PH = ta.pivothigh(Trendtype ? high : close > open ? close : open, Period, Period / 2)
    PL = ta.pivotlow(Trendtype ? low : close > open ? open : close, Period, Period / 2)
    method GetlinePrice(int TIME, float Price, float SLOP, int LookB) =>
        var float Current = 0.0
        EsTime = time – TIME
        Current := Price + (EsTime – LookB * BarTIME) * SLOP
        Current
    method CheckCross(float Price, int StartTime, float StartPrice, float SLP) =>
        var float Current = 0.0
        var float Previous = 0.0
        if StartPrice[Period] != StartPrice
            Current := GetlinePrice(StartTime, StartPrice, SLP, 0)
            Previous := GetlinePrice(StartTime, StartPrice, SLP, 1)
            Crossover =  Price[1] < Previous and Price > Current ? 1 : Price[1] > Previous – (Zband*0.1) and Price < Current – (Zband*0.1) ? -1 : 0
            Crossover
    [Xx, XZ, SLPXZ] = Trendlines(PH, Period / 2,false)
    [XxL, XZL, SLPXZL] = Trendlines(PL, Period / 2, true)
    if ta.change(fixnan(PH)) != 0
        UpdatedX := Xx
        UpdatedY := XZ
        UpdatedSLP := SLPXZ
        UpdatedSLP
    if ta.change(fixnan(PL)) != 0
        UpdatedXLow := XxL
        UpdatedYLow := XZL
        UpdatedSLPLow := SLPXZL
        UpdatedSLPLow
    Long = not (UpdatedSLP * time > 0)
         and CheckCross(close, UpdatedX, UpdatedY, UpdatedSLP)== 1
         and not TradeisON
    Short = not (UpdatedSLPLow * time < 0)
         and CheckCross(close, UpdatedXLow, UpdatedYLow, UpdatedSLPLow)==-1
         and not TradeisON
    TradeFire = Long or Short
    if Long and not TradeisON
        LongTrade:= true
        ShortTrade:= false
    if Short and not TradeisON
        LongTrade:= false
        ShortTrade:= true
    iftrue
        if TradeFire and not TradeisON
            TP := switch
                Long  => high + (Zband *20)
                Short => low – (Zband *20)
            SL := switch
                Long  => low – (Zband *20)
                Short => high + (Zband *20)
            TradeisON:= true
            if ShowTargets
                line.new(bar_index,
                     Long ? high : low,
                     bar_index,
                     TP,
                     width=2,
                     color = color.rgb(154, 103, 20),
                     style= line.style_dashed)
                tpLine:= line.new(bar_index,
                     TP,
                     bar_index+2,
                     TP,
                     style= line.style_dashed,
                     color = color.rgb(154, 103, 20)
                     )
                LAB:=label.new(bar_index,
                     TP,
                     “Target”,
                     color = color.rgb(154, 103, 20),
                     style= label.style_label_left,
                     size=size.small,
                     textcolor = color.white
                     )
        if TradeisON
            line.set_x2(tpLine,bar_index)
            label.set_x(LAB,bar_index+1)
        if LongTrade and TradeisON
            if high >= TP
                label.set_color(LAB,color.rgb(6, 128, 10, 37))
                TradeisON:=false
            if close <= SL
                label.set_color(LAB,color.new(color.rgb(246, 7, 7),70))
                TradeisON:=false
        else if ShortTrade and TradeisON
            iflow<=TP
                label.set_color(LAB,color.rgb(6, 128, 10, 37))
                TradeisON:=false
            ifclose>=SL
                label.set_color(LAB,color.new(color.rgb(246, 7, 7),70))
                TradeisON:=false
    plotshape(Long and not TradeisON[1],
         size = size.small,
         color = color.rgb(46, 192, 6, 11),
         location = location.belowbar,
         style = shape.labelup ,
         text = “”,
         textcolor = color.white)
    plotshape(Short and not TradeisON[1],
         size = size.small,
         color = color.rgb(241, 2, 2, 11),
         location = location.abovebar,
         style = shape.labeldown ,
         text = “”,
         textcolor = color.white)
    // — END — .
    #240810 quote
    Iván González
    Moderator
    Master

    Hi! this is my version.

    //--------------------------------------------------//
    //PRC_TrendLine BreakOuts
    //version = 0
    //27.11.2024
    //Iván González @ www.prorealcode.com
    //Sharing ProRealTime knowledge
    //--------------------------------------------------//
    // Inputs
    //--------------------------------------------------//
    period=10
    pivottype=1 // 1 means wicks // 0 means Body
    showtrendUP=1 //Boolean
    showtrendDN=1 //Boolean
    //--------------------------------------------------//
    // Pivots High and Low
    //--------------------------------------------------//
    leftbars=period
    rightbars=max(1,floor(period/2))
    if pivottype then
    src1 = low
    src2 = high
    else
    src1 = min(open,close)
    src2 = max(open,close)
    endif
    //---Pivots Low
    if src1 > src1[rightbars] and lowest[rightbars](src1) > src1[rightbars] and src1[rightbars] < lowest[leftbars](src1)[rightbars+1] then
    $PLy[z+1]=src1[rightbars]
    $PLx[z+1]=barindex[rightbars]
    z=z+1
    //y=(x-x1)*slope+y1
    if $PLy[z]>$PLy[z-1] then
    $slopeL[z]=($PLy[z]-$PLy[z-1])/($PLx[z]-$PLx[z-1])
    endif
    endif
    //---Pivots High
    if src2 < src2[rightbars] and highest[rightbars](src2)<src2[rightbars] and src2[rightbars]>highest[leftbars](src2)[rightbars+1] then
    $PHy[t+1]=src2[rightbars]
    $PHx[t+1]=barindex[rightbars]
    t=t+1
    //y=(x-x1)*slope+y1
    if $PHy[t]<$PHy[t-1] then
    $slope[t]=($PHy[t]-$PHy[t-1])/($PHx[t]-$PHx[t-1])
    endif
    endif
    //--------------------------------------------------//
    //Volatility for TP and SL
    //--------------------------------------------------//
    Zband=min(averagetruerange[30](close)*0.3,close*(0.3/100))[20]/2
    //--------------------------------------------------//
    // Draw trendlines and trading signals
    //--------------------------------------------------//
    //Trendline and Long positions
    if islastbarupdate and showtrendUP then
    for i=t downto 4 do
    if $PHy[i-1]<$PHy[i-2] then
    x1=$PHx[i-2]
    y1=$PHy[i-2]
    for j=$PHx[i-1]+1 to barindex do
    x2=j
    y2=y1+(x2-x1)*$slope[i-1]
    if close[barindex-j]>y2 then
    tp=high[barindex-j]+(Zband[barindex-j]*20)
    sl=low[barindex-j]-(Zband[barindex-j]*20)
    break
    endif
    next
    for k=x2+1 to barindex do
    if high[barindex-k]>=tp then
    x3=k
    sellprice=max(tp,open[barindex-k])
    win=1
    break
    elsif low[barindex-k]<=sl then
    x3=k
    sellprice=min(sl,open[barindex-k])
    win=0
    break
    else
    x3=barindex
    endif
    next
    if x2<$PHx[i] then
    drawsegment(x1,y1,x2,y2)coloured("darkgreen")
    drawtext("▲",x2,y2-0.25*tr[1])coloured("green")
    drawsegment(x2,tp,x3,tp)style(dottedline)coloured("green")
    drawsegment(x2,sl,x3,sl)style(dottedline)coloured("darkred")
    drawsegment(x2,y2,x2,tp)style(dottedline4,1)coloured("green")
    drawsegment(x2,y2,x2,sl)style(dottedline4,1)coloured("green")
    if x3<>barindex then
    drawpoint(x3,sellprice,1)coloured("orange")
    drawtext("✖",x3,sellprice+0.25*tr[1])coloured("green")
    endif
    endif
    endif
    next
    endif
    //---TrendLine and Short positions
    if islastbarupdate and showtrendDN then
    for i=z downto 4 do
    if $PLy[i-1]>$PLy[i-2] then
    x1=$PLx[i-2]
    y1=$PLy[i-2]
    for j=$PLx[i-1]+1 to barindex do
    x2=j
    y2=y1+(x2-x1)*$slopeL[i-1]
    if close[barindex-j]<y2 then
    sl=high[barindex-j]+(Zband[barindex-j]*20)
    tp=low[barindex-j]-(Zband[barindex-j]*20)
    break
    endif
    next
    for k=x2+1 to barindex do
    if high[barindex-k]>=sl then
    x3=k
    sellprice=max(sl,open[barindex-k])
    win=0
    break
    elsif low[barindex-k]<=tp then
    x3=k
    sellprice=min(tp,open[barindex-k])
    win=1
    break
    else
    x3=barindex
    endif
    next
    if x2<$PLx[i] then
    drawsegment(x1,y1,x2,y2)coloured("darkred")
    drawtext("▼",x2,y2+0.50*tr[1])coloured("darkred")
    drawsegment(x2,tp,x3,tp)style(dottedline)coloured("green")
    drawsegment(x2,sl,x3,sl)style(dottedline)coloured("darkred")
    drawsegment(x2,y2,x2,tp)style(dottedline4,1)coloured("green")
    drawsegment(x2,y2,x2,sl)style(dottedline4,1)coloured("green")
    if x3<>barindex then
    drawpoint(x3,sellprice,1)coloured("orange")
    drawtext("✖",x3,sellprice+0.25*tr[1])coloured("darkred")
    endif
    endif
    endif
    next
    endif
    //--------------------------------------------------//
    return
    
    jacquesgermain thanked this post
    #240845 quote
    jacquesgermain
    Participant
    Senior

    Hello Ivan

    is it possible to have the screener to find today’s values “▲”?

    thanks

    #240875 quote
    Iván González
    Moderator
    Master
    //--------------------------------------------------//
    //SRC_TrendLine BreakOuts
    //version = 0
    //27.11.2024
    //Iván González @ www.prorealcode.com
    //Sharing ProRealTime knowledge
    //--------------------------------------------------//
    // Inputs
    //--------------------------------------------------//
    period=10
    pivottype=1 // 1 means wicks // 0 means Body
    //--------------------------------------------------//
    // Pivots High and Low
    //--------------------------------------------------//
    leftbars=period
    rightbars=max(1,floor(period/2))
    if pivottype then
    src1 = low
    src2 = high
    else
    src1 = min(open,close)
    src2 = max(open,close)
    endif
    //---Pivots Low
    if src1 > src1[rightbars] and lowest[rightbars](src1) > src1[rightbars] and src1[rightbars] < lowest[leftbars](src1)[rightbars+1] then
    $PLy[z+1]=src1[rightbars]
    $PLx[z+1]=barindex[rightbars]
    z=z+1
    //y=(x-x1)*slope+y1
    if $PLy[z]>$PLy[z-1] then
    $slopeL[z]=($PLy[z]-$PLy[z-1])/($PLx[z]-$PLx[z-1])
    endif
    endif
    //---Pivots High
    if src2 < src2[rightbars] and highest[rightbars](src2)<src2[rightbars] and src2[rightbars]>highest[leftbars](src2)[rightbars+1] then
    $PHy[t+1]=src2[rightbars]
    $PHx[t+1]=barindex[rightbars]
    t=t+1
    //y=(x-x1)*slope+y1
    if $PHy[t]<$PHy[t-1] then
    $slope[t]=($PHy[t]-$PHy[t-1])/($PHx[t]-$PHx[t-1])
    endif
    endif
    //--------------------------------------------------//
    //Trendline and Long positions
    if t>1 then
    x1=$PHx[t-1]
    y1=$PHy[t-1]
    x2=barindex
    y2=y1+(x2-x1)*$slope[t]
    
    if $PHy[t]<$PHy[t-1] and close crosses over y2 then
    setuplong=1
    else
    setuplong=0
    endif
    endif
    //---TrendLine and Short positions
    if z>1 then
    xx1=$PLx[z-1]
    yy1=$PLy[z-1]
    xx2=barindex
    yy2=yy1+(xx2-xx1)*$slopeL[z]
    
    if $PLy[z]>$PLy[z-1] and close crosses under yy2 then
    setupshort=1
    else
    setupshort=0
    endif
    endif
    
    SCREENER[setupshort or setuplong](setupshort  as "SH",setuplong as "LG")
    jacquesgermain thanked this post
    #240882 quote
    jacquesgermain
    Participant
    Senior

    Hello Ivan

    I tested your screener but it don’t gives today’s values “▲” on the indicator (for the longshort)


    #240965 quote
    Iván González
    Moderator
    Master

    Hi

    I don’t know wich TF are you using or wich markets screening…

    Today for US Tech 150 in daily timeframe there are 3 stocks.

    #240971 quote
    jacquesgermain
    Participant
    Senior
    HI Ivan TF day “Today for US Tech 150 in daily timeframe there are 3 stocks.”

    yes and on the indicator these 3 values ​​are not in signal “▲” today  ? (with the same period that screener)


    #241012 quote
    Iván González
    Moderator
    Master
    If you compare the indicator with the screener you will see that the code is different. The indicator needs an additional pivot to draw the line. The screener does not. This is why the trend line has not yet been drawn.
    jacquesgermain thanked this post
Viewing 8 posts - 1 through 8 (of 8 total)
  • You must be logged in to reply to this topic.

Translation of “Trendline Breakouts With Targets” from TV


ProBuilder: Indicators & Custom Tools

New Reply
Author
Summary

This topic contains 7 replies,
has 3 voices, and was last updated by Iván González
1 year, 2 months ago.

Topic Details
Forum: ProBuilder: Indicators & Custom Tools
Language: English
Started: 11/23/2024
Status: Active
Attachments: 2 files
Logo Logo
Loading...