I see in TV a very useful Indicator, please find below the description from TV:
Trendline Pivots
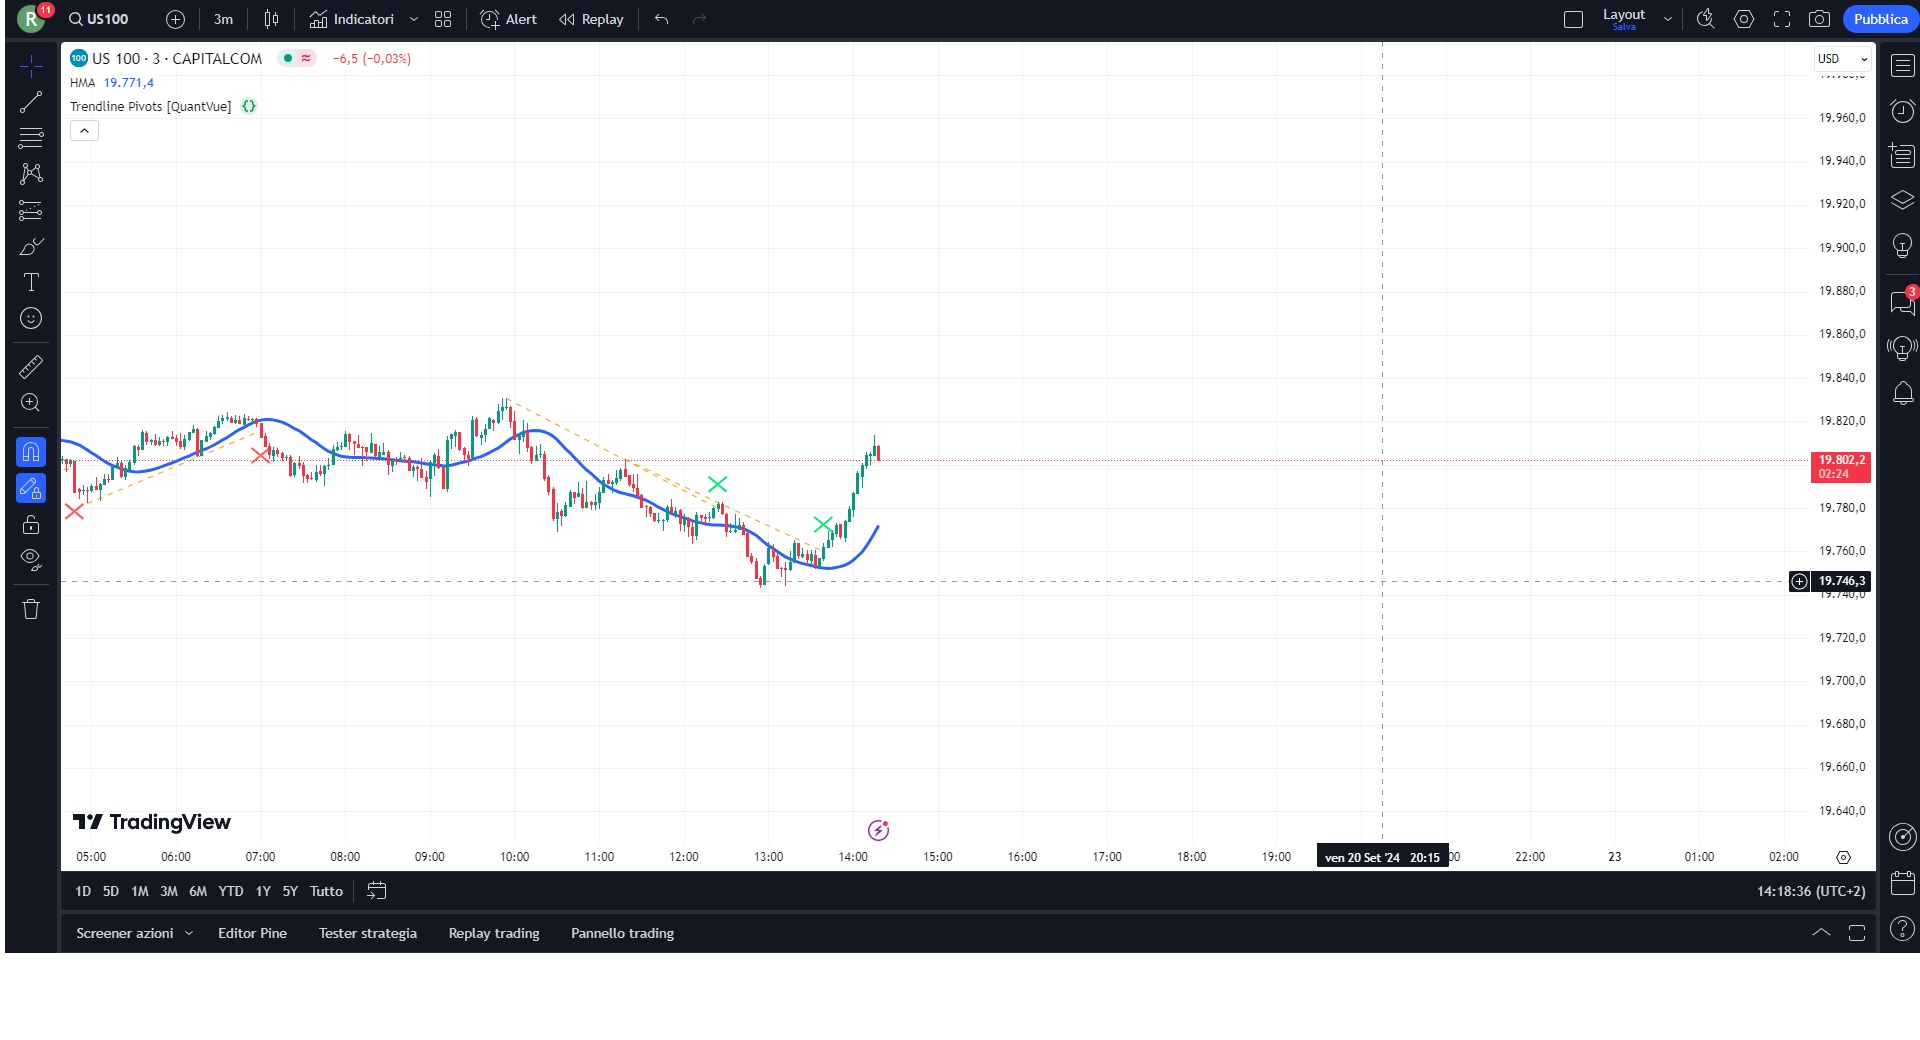
The Trend Line Pivot Indicator works by automatically drawing and recognizing downward trendlines originating from and connecting pivot highs or upward trendlines originating from and connecting pivot lows.
These trendlines serve as reference points of potential resistance and support within the market.
Once identified, the trend line will continue to be drawn and progress with price until one of two conditions is met: either the price closes(default setting) above or below the trend line, or the line reaches a user-defined maximum length.
If the price closes(default setting) above a down trend line or below an up trend line, an “x” is displayed, indicating the resistance or support has been broken. At the same time, the trend line transforms into a dashed format, enabling clear differentiation from active non-breached trend lines.
This indicator is fully customizable from line colors, pivot length, the number lines you wish to see on your chart and works on any time frame and any market.
Only post in the language of the forum that you are posting in. For example English only in the English speaking forums and French only in the French speaking forums. Thanks 🙂
I moved the topic from the Italian forum.
Here you have the traslation:
defparam drawonlastbaronly=true
//-----------------------------------------------//
//PRC_TrendLine pivots
//version = 0
//25.09.24
//Iván González @ www.prorealcode.com
//Sharing ProRealTime knowledge
//-----------------------------------------------//
//-----Inputs------------------------------------//
//-----------------------------------------------//
maxLines=4
pivLen=9
//-----------------------------------------------//
//-----Pivots High and Low-----------------------//
//-----------------------------------------------//
src1 = low
src2 = high
leftbars=pivLen
rightbars=pivLen
//---Pivots low
if src1 > src1[rightbars] and lowest[rightbars](src1) > src1[rightbars] and src1[rightbars] < lowest[leftbars](src1)[rightbars+1] then
$ply[z+1] = src1[rightbars]
$plx[z+1] = barindex[rightbars]
//drawpoint(barindex[rightbars],src1[rightbars],2)coloured("red",80)
$crossdw[z+1]=0
z = z + 1
endif
//---Pivots high
if src2 < src2[rightbars] and highest[rightbars](src2)<src2[rightbars] and src2[rightbars]>highest[leftbars](src2)[rightbars+1] then
$phy[t+1]=src2[rightbars]
$phx[t+1]=barindex[rightbars]
//drawpoint(barindex[rightbars],src2[rightbars],2)coloured("blue",80)
$crossup[t+1]=0
t=t+1
endif
//-----------------------------------------------//
//-----Line definition---------------------------//
//-----------------------------------------------//
//(x-x1)/(x2-x1) = (y-y1)/(y2-y1)
//x = barindex
//y = y1+(barindex-x1)*(y2-y1)/(x2-x1)

if islastbarupdate then
//---Pivots low line
for i=z-maxLines*2 to z do
$y2[i] = $ply[i]
$x2[i] = $plx[i]
$y1[i] = $ply[max(i-1,0)]
$x1[i] = $plx[max(i-1,0)]
for j=$plx[i] downto 0 do
$xl[i] = barindex[j]
$yl[i] = $y1[i]+(barindex[j]-$x1[i])*($y2[i]-$y1[i])/($x2[i]-$x1[i])
if $xl[i]>$x2[i] and $y2[i]>$y1[i] and low[j] < $yl[i] then
$crossdw[i]=1
drawsegment($x1[i],$y1[i],barindex[j],$yl[i])style(dottedline,2)coloured("blue")
break
elsif $xl[i]>$x2[i] and $y2[i]>$y1[i] and $crossdw[i]=0 then
drawsegment($x1[i],$y1[i],barindex,$ply[max(i-1,0)]+(barindex-$plx[max(i-1,0)])*($ply[i]-$ply[max(i-1,0)])/($plx[i]-$plx[max(i-1,0)]))style(line,2)coloured("green")
endif
next
next
//---Pivots high line
for k=t-maxLines*2 to t do
$y22[k] = $phy[k]
$x22[k] = $phx[k]
$y11[k] = $phy[max(k-1,0)]
$x11[k] = $phx[max(k-1,0)]
for n=$phx[k] downto 0 do
$xh[k] = barindex[n]
$yh[k] = $y11[k]+(barindex[n]-$x11[k])*($y22[k]-$y11[k])/($x22[k]-$x11[k])
if $xh[k]>$x22[k] and $y22[k]<$y11[k] and high[n] > $yh[k] then
$crossup[k]=1
drawsegment($x11[k],$y11[k],barindex[n],$yh[k])style(dottedline,2)coloured("orange")
break
elsif $xh[k]>$x22[k] and $y22[k]<$y11[k] and $crossup[k]=0 then
drawsegment($x11[k],$y11[k],barindex,$y11[k]+(barindex-$x11[k])*($y22[k]-$y11[k])/($x22[k]-$x11[k]))style(line,2)coloured("red")
endif
next
next
endif
//-----------------------------------------------//
return
Hi,
very interesting.
It would be possible to manage the look back ? (actualluy the indicator seems to work in a range of about 300 bars)
Thanks
Just change value of maxLines=4.
Thank you so much Ivan!!!