Traduction code ifvg de Luxalgo

Viewing 15 posts - 1 through 15 (of 16 total)
  • Author
    Posts
  • #242079 quote
    titi
    Participant
    New

    Bonjour,
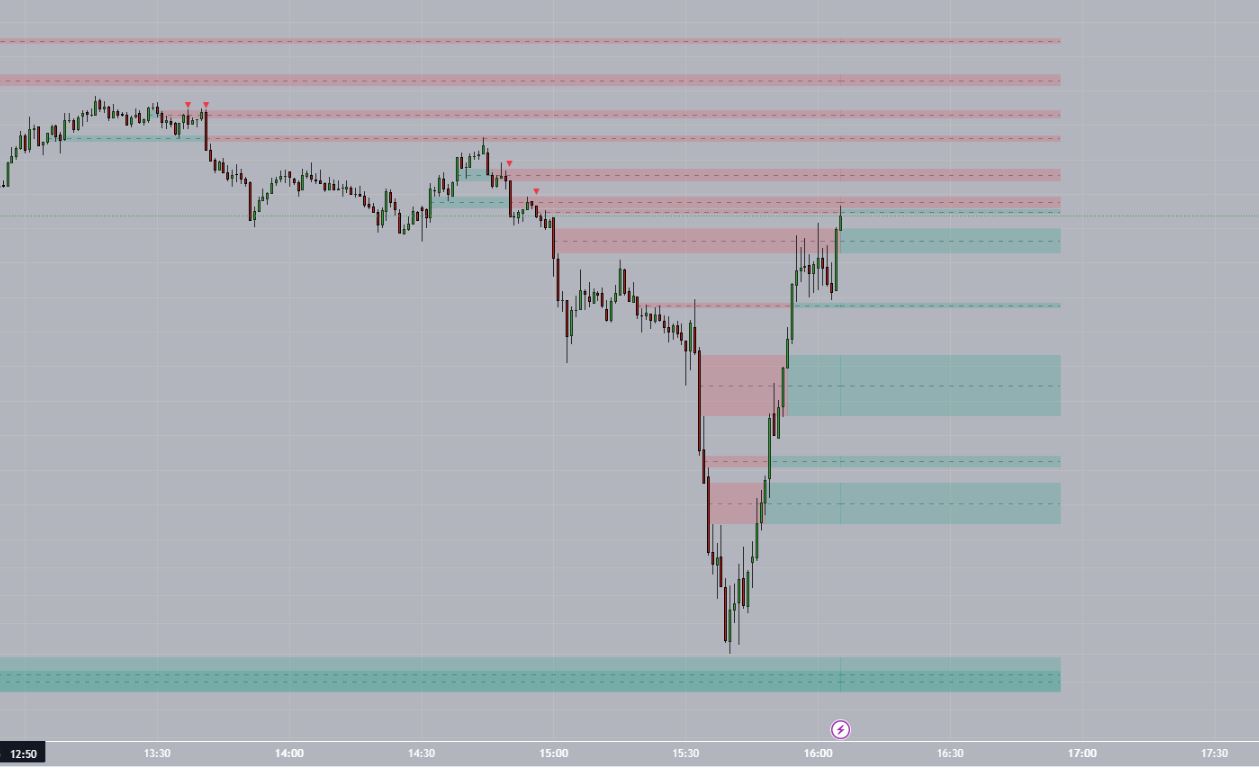
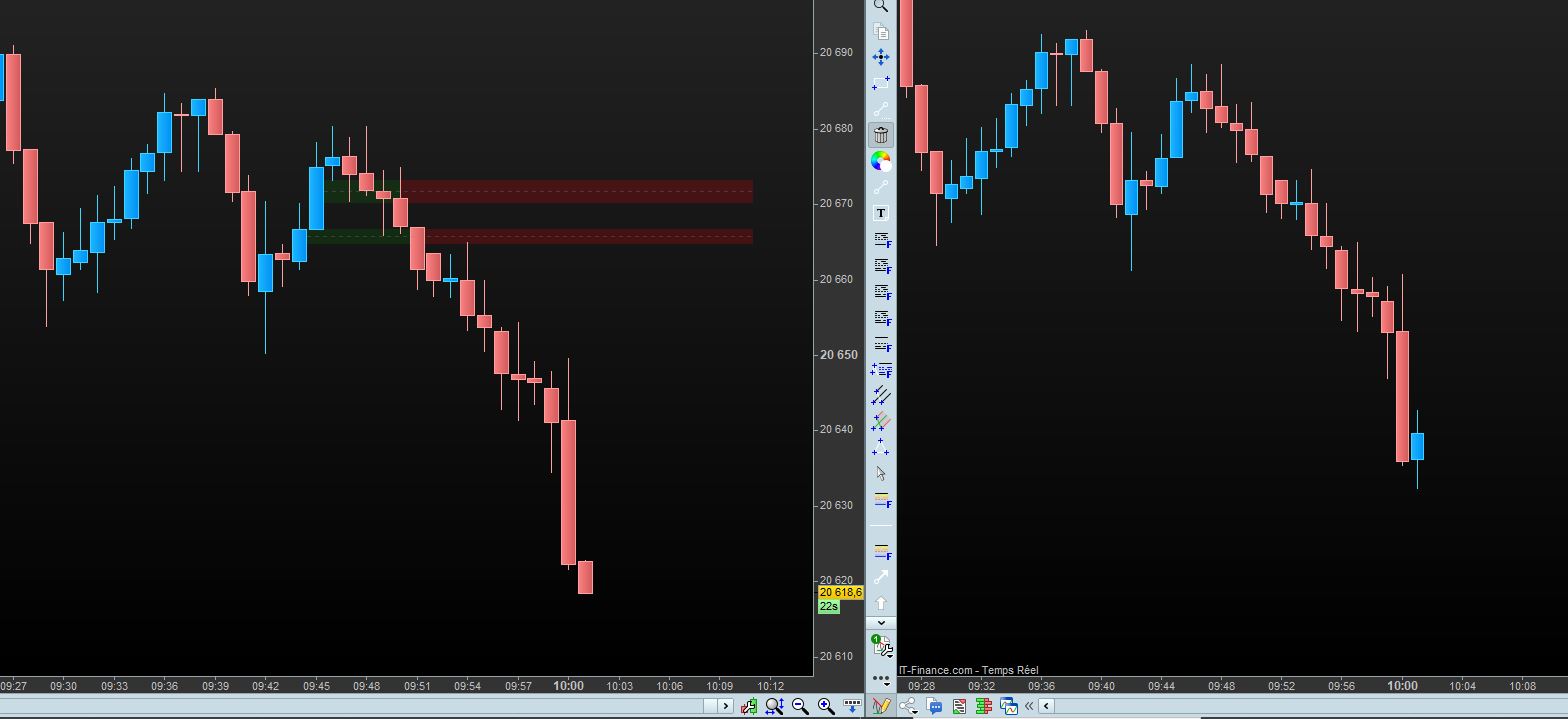
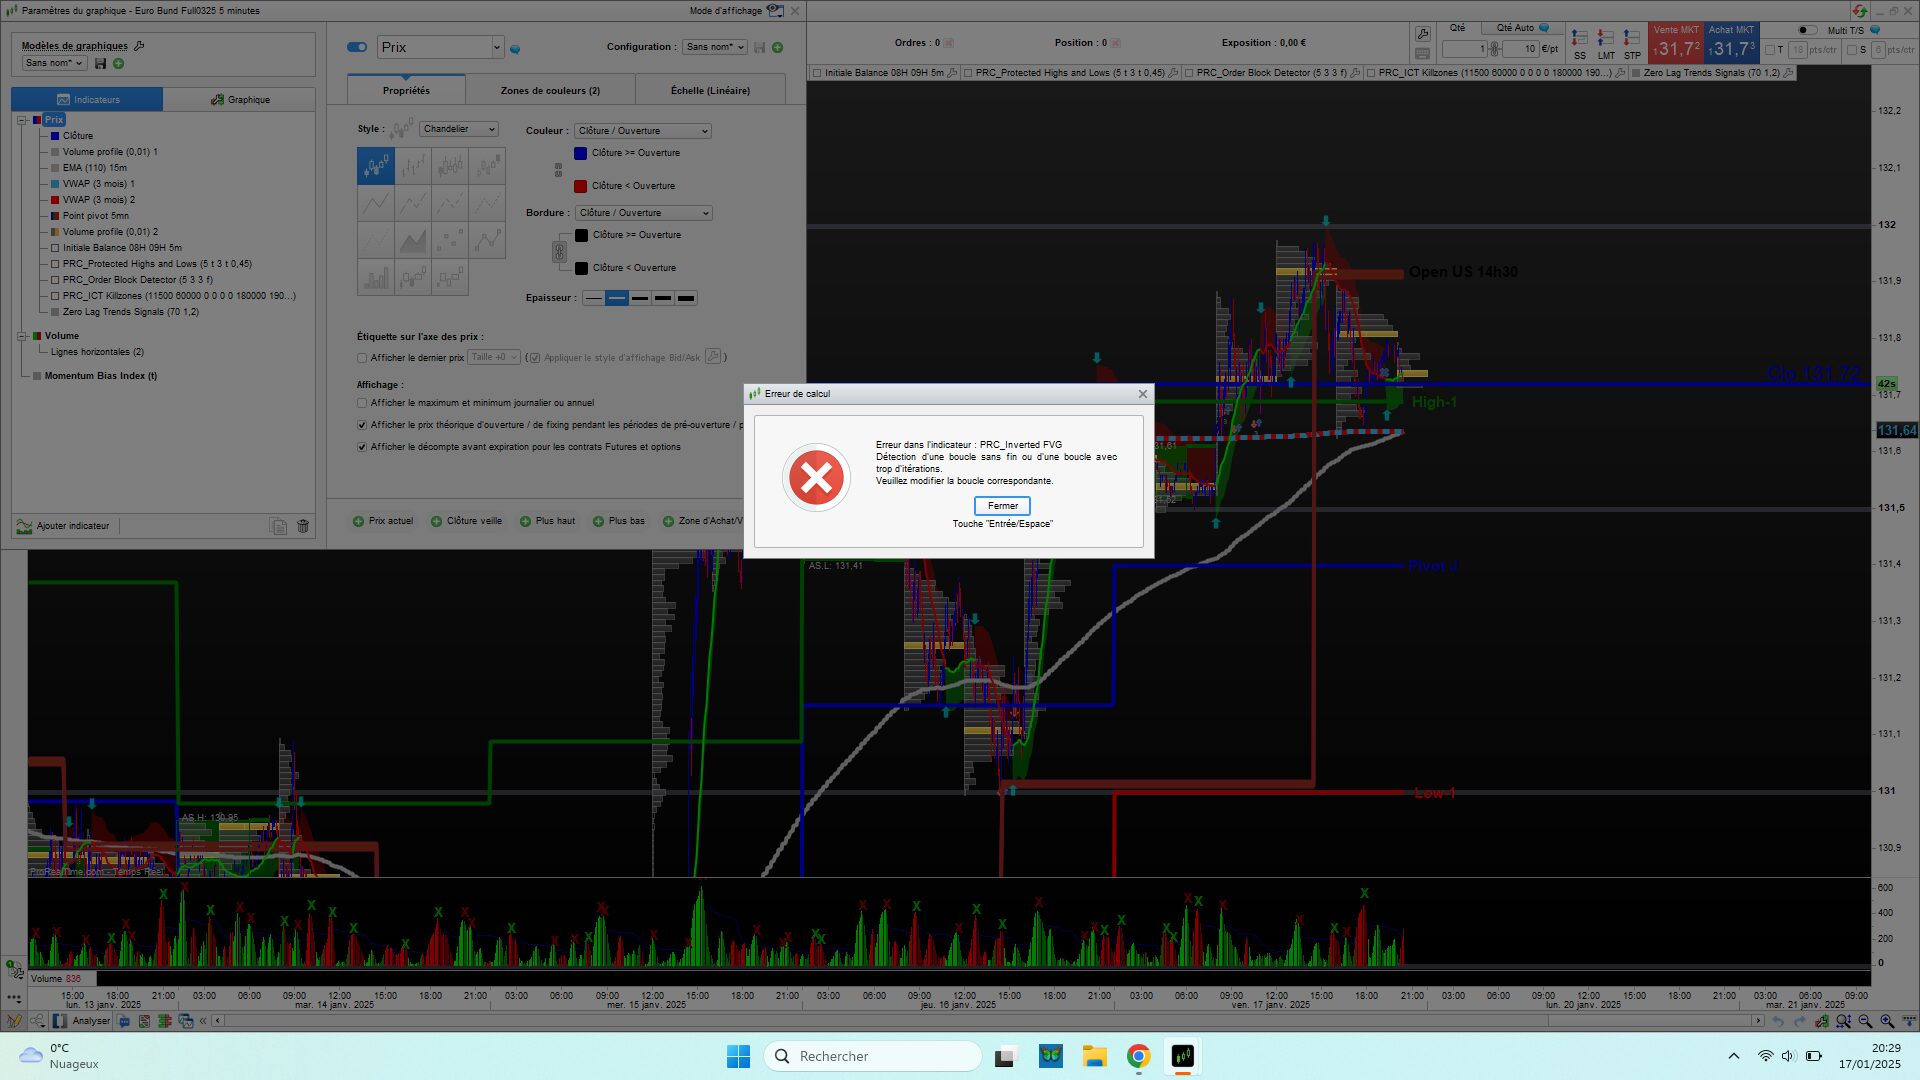
    tout d’abord je vous souhaite une bonne année 2025. j’ai découvert un indicateur génial qui est l’ifvg (inversion fair value gap) codé par LuxAlgo et qui pourrait intéresser beaucoup de monde je pense. Lorsqu’une fvg baissière est breakée, cette dernière devient alors une zone de support (et inversement avec une FVG haussière). Malheureusement, je ne sais pas coder sur PRT et je me demande si une âme charitable pourrait proposer une conversion de ce super indicateur de Tradingview pour PRT.
    Un grand merci d’avance pour votre aide.
    Cordialement.

    // This work is licensed under a Attribution-NonCommercial-ShareAlike 4.0 International (CC BY-NC-SA 4.0) https://creativecommons.org/licenses/by-nc-sa/4.0/
    // ©LuxAlgo
    
    //@version=5
    indicator("Inversion Fair Value Gaps (IFVG) [LuxAlgo]", "LuxAlgo - Inversion Fair Value Gaps (IFVG)", overlay = true, max_boxes_count = 500, max_lines_count = 500, max_labels_count = 500)
    //---------------------------------------------------------------------------------------------------------------------}
    //Settings
    //---------------------------------------------------------------------------------------------------------------------{
    disp_num = input.int(5, maxval = 100, minval = 1, title = "Show Last", tooltip = "Specifies the amount of most recent inversion FVG to display in Bullish/Bearish pairs, starting at the current and looking back.")
    signal_pref = input.string("Close", title = "Signal Preference", options = ["Close","Wick"], tooltip = "Choose to send signals based on Wicks or Close Price.")
    wt = signal_pref == "Wick"
    atr_multi = input.float(0.25, step = 0.25,minval = 0,  title = "ATR Multiplier", tooltip = "Filters FVGs based on ATR Width, Only displays Inversions that are Greater-Than the ATR*Multiplier.")
    
    //Colors
    green = input.color(color.new(#089981, 80), title = "Bull Color", group = "Colors")
    red = input.color(color.new(#f23645, 80), title = "Bear Color", group = "Colors")
    gray = input.color(#787b86, title = "Midline Color", group = "Colors")
    invis = color.rgb(0,0,0,100)
    
    //---------------------------------------------------------------------------------------------------------------------}
    //UDT's
    //---------------------------------------------------------------------------------------------------------------------{
    type lab //Contains Necessary Label Data to Send to Label Function
        int x
        float y
        int dir
    
    type fvg //Contains Necessary FVG Data to Send to Chart.
        int left = na
        float top = na
        int right = na
        float bot = na
        float mid = na
        int dir = na
        int state = na
        array<lab> labs = na
        int x_val = na
    
    //---------------------------------------------------------------------------------------------------------------------}
    //Functions
    //---------------------------------------------------------------------------------------------------------------------{
    //Basic Calcs
    buffer = 100 //How many FVGs to keep in memory.
    c_top = math.max(open,close)
    c_bot = math.min(open,close)
    
    label_maker(_x,_y,_dir) => //Used for making Labels
        switch
            _dir == 1 => label.new(_x,_y,"\n▲", style = label.style_text_outline, color = invis,  textcolor = color.new(green,0), size = size.small, xloc = xloc.bar_time)
            _dir == -1 => label.new(_x,_y, "▼\n", style = label.style_text_outline, color = invis,  textcolor = color.new(red,0), size = size.small, xloc = xloc.bar_time)
    
    fvg_manage(_ary,_inv_ary) => //First step filtering of FVG data, Not all FVGs will be displayed, only inversions.
        if _ary.size() >= buffer
            _ary.shift()
    
        if _ary.size() > 0
            for i = _ary.size()-1 to 0
                value = _ary.get(i)
                _dir = value.dir
    
                if _dir == 1 and (c_bot < value.bot)
                    value.x_val := time
                    _inv_ary.push(_ary.remove(i))
                if _dir == -1 and (c_top > value.top)
                    value.x_val := time
                    _inv_ary.push(_ary.remove(i))
                
    
    inv_manage(_ary) => //All inversions will be displayed.
        fire = false
        if _ary.size() >= buffer
            _ary.shift()
        if _ary.size() > 0
            for i = _ary.size()-1 to 0
                value = _ary.get(i)
                bx_top = value.top
                bx_bot = value.bot
                _dir = value.dir
                st = value.state
    
                if (st == 0 and _dir == 1)
                    value.state := 1
                    value.dir := -1
                if (_dir == -1 and st == 0)
                    value.state := 1
                    value.dir := 1
                if st >= 1
                    value.right := time
                if (_dir == -1 and st == 1 and close < bx_bot and (wt?high:close[1]) >= bx_bot and (wt?high:close[1]) < bx_top)
                    value.labs.push(lab.new(time,bx_top,-1))
                    fire := true
                if (_dir == 1 and st == 1 and close > bx_top and (wt?low:close[1]) <= bx_top and (wt?low:close[1]) > bx_bot)
                    value.labs.push(lab.new(time,bx_bot,1))
                    fire := true
                if st >= 1 and ((_dir == -1 and c_top > bx_top) or (_dir == 1 and c_bot < bx_bot))
                    _ary.remove(i)
                
        fire
    
    send_it(_ary) => // Draws Everything on the Chart
        last_index = _ary.size()-1
        for [index,value] in _ary
            bx_top = value.top
            bx_bot = value.bot
            bx_left = value.left
            xval = value.x_val
            mid = value.mid
            col = value.dir == -1 ? green : red
            o_col = value.dir == -1 ? red : green
    
            if index > last_index - disp_num
                box.new(bx_left,bx_top,xval,bx_bot,bgcolor = col, border_color = invis, xloc = xloc.bar_time)
                box.new(xval,bx_top,time,bx_bot, bgcolor = o_col, border_color = invis, xloc = xloc.bar_time)
    
                line.new(bx_left,mid,time,mid, color = gray, style = line.style_dashed, xloc = xloc.bar_time)
                box.new(bar_index,bx_top,bar_index+50,bx_bot, bgcolor = o_col, border_color = invis)
                line.new(bar_index,mid,bar_index+50,mid, color = gray, style = line.style_dashed)
    
                for stuff in value.labs
                    label_maker(stuff.x,stuff.y,stuff.dir)
    
    //---------------------------------------------------------------------------------------------------------------------}
    //Delete drawings
    //---------------------------------------------------------------------------------------------------------------------{
    for boxes in box.all
        box.delete(boxes)
    
    for lines in line.all
        line.delete(lines)
    
    for labels in label.all
        label.delete(labels)
    
    //---------------------------------------------------------------------------------------------------------------------}
    //Data Arrays
    //---------------------------------------------------------------------------------------------------------------------{
    var bull_fvg_ary = array.new<fvg>(na) // FVG Data, Not all will be Drawn
    var bear_fvg_ary = array.new<fvg>(na)
    
    var bull_inv_ary = array.new<fvg>(na) // Inversion Data, All will be Drawn
    var bear_inv_ary = array.new<fvg>(na)
    
    //---------------------------------------------------------------------------------------------------------------------}
    //FVG Detection
    //---------------------------------------------------------------------------------------------------------------------{
    atr = nz(ta.atr(200)*atr_multi, ta.cum(high - low) / (bar_index+1))
    
    fvg_up = (low > high[2]) and (close[1] > high[2])
    fvg_down = (high < low[2]) and (close[1] < low[2])
    
    if fvg_up and math.abs(low-high[2]) > atr
        array.push(bull_fvg_ary,fvg.new(time[1], low, time, high[2], math.avg(low,high[2]), 1, 0,array.new<lab>(na),na))
    
    if fvg_down and math.abs(low[2]-high) > atr
        array.push(bear_fvg_ary,fvg.new(time[1], low[2], time, high, math.avg(high,low[2]),-1 ,0,array.new<lab>(na),na))
    
    //---------------------------------------------------------------------------------------------------------------------}
    //Running Functions
    //---------------------------------------------------------------------------------------------------------------------{
    // FVG_Data -> Inversion_Data -> Chart
    fvg_manage(bull_fvg_ary,bull_inv_ary)
    fvg_manage(bear_fvg_ary,bear_inv_ary)
    
    bear_signal = inv_manage(bull_inv_ary)
    bull_signal = inv_manage(bear_inv_ary)
    
    if barstate.islast
        send_it(bull_inv_ary)
        send_it(bear_inv_ary)
    
    //Alert Options
    alertcondition(bull_signal, "Bullish Signal")
    alertcondition(bear_signal, "Bearish Signal")
    
    //---------------------------------------------------------------------------------------------------------------------}
    Alai-n thanked this post
    ifvg-luxalgo.jpg ifvg-luxalgo.jpg
    #242081 quote
    fifi743
    Participant
    Master

    c’est pas celui ci par hasard

    Smart money concepts [LuxAlgo]

    il faut chercher dans le site site avant de demander une traduction du code

    #242082 quote
    titi
    Participant
    New

    Bonjour,
    je vous remercie pour votre réponse mais il ne s’agit pas du même indicateur. Et ce n’est pas le même concept si vous regardez ce que j’ai posté. Pour votre information, j’ai déjà recherché sur le forum et dans les indicateurs proposés et il n’y est pas.
    Cordialement

    #242359 quote
    titi
    Participant
    New

    Je me permets de relancer cette demande avec le détail de l’inversion Fair value Gaps de Luxalgo. Je poste le lien avec la description de cet indicateur qui est très puissant pour déceler des zones de support/resistance.

    https://fr.tradingview.com/script/8FHucjY6-Inversion-Fair-Value-Gaps-IFVG-LuxAlgo/

    Si vous le testez, vous l’adopterez.

    Merci d’avance aux généreux développeurs pour leur aide.

    #242369 quote
    Iván González
    Moderator
    Master

    Bonjour. Sois patient. J'y suis.

    #242380 quote
    titi
    Participant
    New

    Bonjour Ivan, je vous remercie beaucoup pour votre aide et pour tout ce que vous développez pour les autres. Rassurez-vous je suis patient et ceux qui ne connaissent pas seront selon moi très intéressés par le concept. Merci encore à vous. Cordialement.

    #242395 quote
    Iván González
    Moderator
    Master

    Bonnes tardes ! En fin de compte, je l'ai eu avant l'annonce 🙂

    //-----------------------------------------------//
    //PRC_Inverted FVG
    //version = 0
    //09.01.2025
    //Iván González @ www.prorealcode.com
    //Sharing ProRealTime knowledge
    //-----------------------------------------------//
    // inputs
    //-----------------------------------------------//
    defparam drawonlastbaronly=true
    dispNum=7
    atrMult=0.25
    showbrokenFvg=0
    //-----------------------------------------------//
    // Atr calculation
    //-----------------------------------------------//
    if barindex<=200 and barindex>1 then
    atr=averagetruerange[barindex](close)*atrMult
    else
    atr=averagetruerange[200](close)*atrMult
    endif
    //-----------------------------------------------//
    // FVG Detection
    //-----------------------------------------------//
    fvgUp=low>high[2] and close[1]>high[2]
    fvgDown=high<low[2] and close[1]<low[2]
    ctop=max(close,open)
    cbot=min(close,open)
    
    if fvgUp and abs(low-high[2])>atr then
    $fvgLeft[n+1]=barindex[1]
    $fvgTop[n+1]=low
    $fvgRight[n+1]=barindex
    $fvgBot[n+1]=high[2]
    $fvgMid[n+1]=(low+high[2])/2
    $fvgDir[n+1]=1
    $State[n+1]=0
    n=n+1
    endif
    
    if fvgDown and abs(low[2]-high)>atr then
    $fvgLeft[n+1]=barindex[1]
    $fvgTop[n+1]=low[2]
    $fvgRight[n+1]=barindex
    $fvgBot[n+1]=high
    $fvgMid[n+1]=(low[2]+high)/2
    $fvgDir[n+1]=-1
    $State[n+1]=0
    n=n+1
    endif
    
    if islastbarupdate then
    t1=0
    FOR i = n DOWNTO 0 DO
    t1=$fvgLeft[i]+1
    if t1<barindex then
    for j=barindex-t1 downto 0 do
    IF $fvgDir[i] = 1 AND cbot[j] < $fvgBot[i] THEN
    $invLeft[i] = $fvgLeft[i]
    $invTop[i] = $fvgTop[i]
    $invRight[i] = barindex[j]
    $invBot[i] = $fvgBot[i]
    $State[i] = 1
    break
    ENDIF
    IF $fvgDir[i] = -1 AND ctop[j] > $fvgTop[i] THEN
    $invLeft[i] = $fvgLeft[i]
    $invTop[i] = $fvgTop[i]
    $invRight[i] = barindex[j]
    $invBot[i] = $fvgBot[i]
    $State[i] = 1
    break
    ENDIF
    next
    endif
    NEXT
    count2=0
    t2=0
    for i=n downto 0 do
    t2=$invRight[i]+1
    if t2<barindex then
    for j=barindex-t2 downto 0 do
    if $fvgDir[i] = 1 and $State[i] = 1 and close[j] > $invTop[i] THEN
    if count2<dispNum and showbrokenFvg then
    drawrectangle($invLeft[i],$invTop[i],$invRight[i],$invBot[i])coloured("green",0)fillcolor("green",10)
    drawsegment($invRight[i],$invTop[i],barindex[j],$invTop[i])coloured("blue",100)style(dottedline)
    endif
    count2=count2+1
    $State[i] = -1
    break
    endif
    if $fvgDir[i] = -1 and $State[i] = 1 and close[j] < $invBot[i] THEN
    if count2<dispNum and showbrokenFvg then
    drawrectangle($invLeft[i],$invTop[i],$invRight[i],$invBot[i])coloured("red",0)fillcolor("red",10)
    drawsegment($invRight[i],$invTop[i],barindex[j],$invTop[i])coloured("blue",100)style(dottedline)
    endif
    count2=count2+1
    $State[i] = -1
    break
    endif
    next
    endif
    next
    
    count=0
    for i=n downto 0 do
    if $State[i] = 1 and count < dispNum then
    count=count+1
    if $fvgDir[i]=1 then
    drawrectangle($invLeft[i],$invTop[i],$invRight[i],$invBot[i])coloured("green",0)fillcolor("green",50)
    drawrectangle($invRight[i],$invTop[i],barindex+10,$invBot[i])coloured("red",0)fillcolor("red",50)
    drawsegment($invLeft[i],($invBot[i]+$invTop[i])/2,barindex+10,($invBot[i]+$invTop[i])/2)coloured("grey",75)style(dottedline3)
    
    elsif $fvgDir[i]=-1 then
    drawrectangle($invLeft[i],$invTop[i],$invRight[i],$invBot[i])coloured("red",0)fillcolor("red",50)
    drawrectangle($invRight[i],$invTop[i],barindex+10,$invBot[i])coloured("green",0)fillcolor("green",50)
    drawsegment($invLeft[i],($invBot[i]+$invTop[i])/2,barindex+10,($invBot[i]+$invTop[i])/2)coloured("grey",75)style(dottedline3)
    endif
    endif
    next
    
    endif
    
    //-----------------------------------------------//
    return
    
    titi, Alai-n, RicLg and Bodaris thanked this post
    #242552 quote
    ARLEQUIN49
    Participant
    Veteran

    super, dommage qu’il n’y est pas les flèches de direction 1 ou -1 comme sur Tradingview

    #242576 quote
    titi
    Participant
    New

    Tout d’abord, merci bcp pour votre travail Ivan.

    Lorsque je mets l’indicateur sur mes graphes, je constate une latence (retard) d’environ 30s entre le cours réel et le cours qui s’affiche. Je vous mets 2 graphes du même time frame et à gauche l’affichage avec l’indicateur positionné et à droite les cours sans indicateur. Est-ce que vous rencontrez le même problème ? Est-ce qu’il est nécessaire de faire un réglage spécial ?

    Merci.

    latence.jpg latence.jpg
    #242597 quote
    Iván González
    Moderator
    Master

    Bonjour. Dans un TF de 10 secondes et avec 200 barres chargées je n'ai pas remarqué de différence. Pour le même TF mais avec 5000 mesures, j'ai vu que parfois il y avait un retard mais de 1 seconde, pas plus.

    #242612 quote
    Alai-n
    Participant
    Veteran

    @Iván Super travail… Il serait bien de l’inclure dans la bibliothèque avec quelques commentaires, pour bien comprendre ce que fait le code!

    #242742 quote
    larouedegann
    Participant
    Master

    J’AI UN MESSAGE D’ERREUR EN 5 MINUTES

    Capture-decran-2025-01-17-202935.jpg Capture-decran-2025-01-17-202935.jpg
    #242865 quote
    Iván González
    Moderator
    Master

    Je ne sais pas quoi vous dire… Je l'ai testé sur plusieurs actifs avec TF5m et ça marche. Dans quel ticker obtenez-vous une erreur ?

    #242889 quote
    larouedegann
    Participant
    Master

    5 MN EUROBUND 0325

    #242895 quote
    Razz
    Participant
    Master

    Bonjour
    Je pense que le problème réside dans les unités > 25 000. J’obtiens également une erreur.

Viewing 15 posts - 1 through 15 (of 16 total)
  • You must be logged in to reply to this topic.

Traduction code ifvg de Luxalgo


ProBuilder : Indicateurs & Outils Personnalisés

New Reply
Author
author-avatar
titi @el-titi Participant
Summary

This topic contains 15 replies,
has 7 voices, and was last updated by Iván González
1 year, 1 month ago.

Topic Details
Forum: ProBuilder : Indicateurs & Outils Personnalisés
Language: French
Started: 01/02/2025
Status: Active
Attachments: 3 files
Logo Logo
Loading...