A ver si alguien puede traducir el código a PRT. Este código está basado en el perceptron y sería interesante aunque no sé si repinta……..https://es.tradingview.com/script/7EHWtnXY-Machine-Learning-Perceptron-based-strategy/
El perceptrón de aprendizaje es la red neuronal artificial (ANN) más simple posible, que consta de una sola neurona y es capaz de aprender una determinada clase de problemas de clasificación binaria. La idea detrás de las ANN es que al seleccionar buenos valores para los parámetros de peso (y el sesgo), la ANN puede modelar las relaciones entre las entradas y algunos objetivos.
// This source code is subject to the terms of the Mozilla Public License 2.0 at https://mozilla.org/MPL/2.0/
// © capissimo
//@version=4
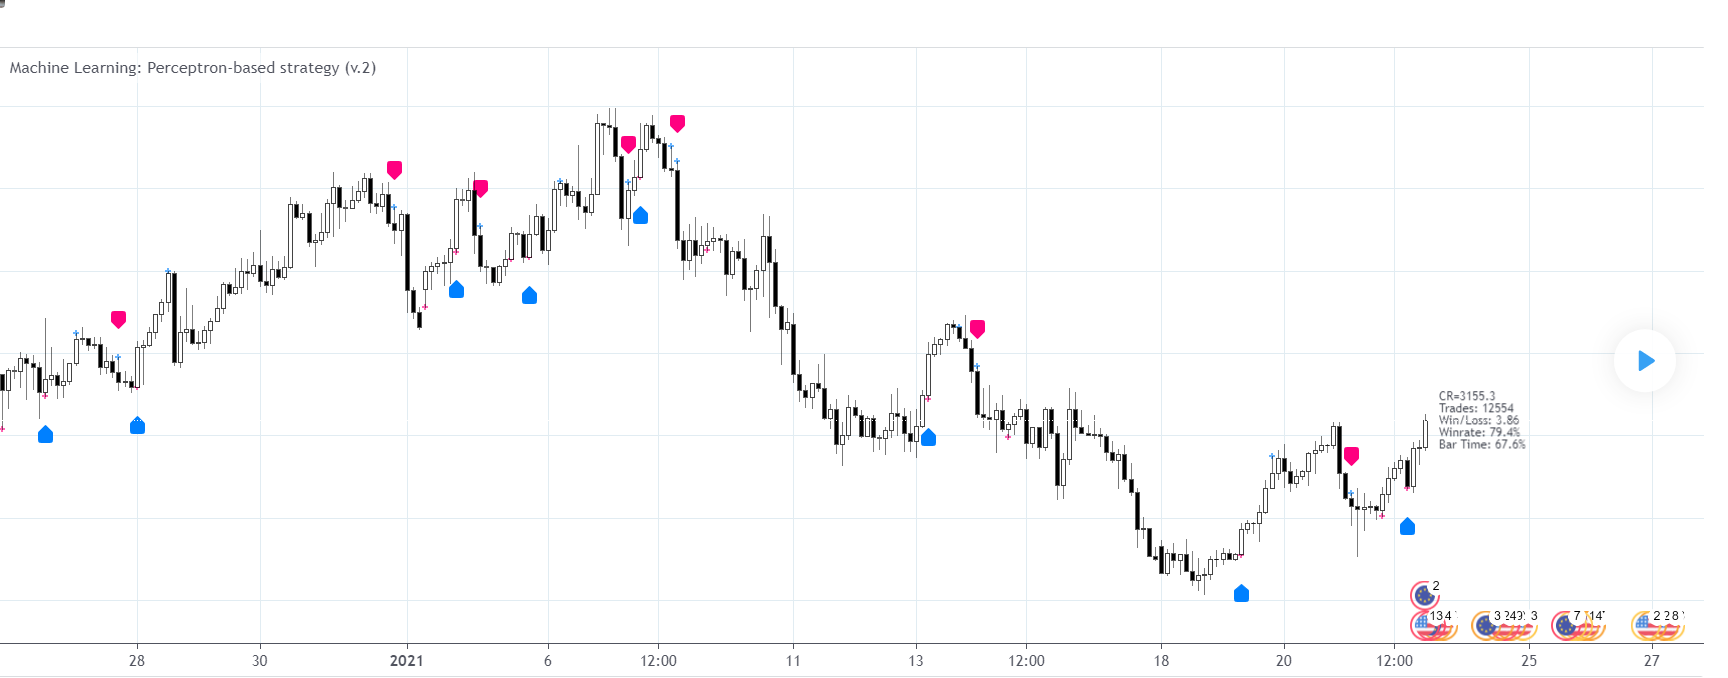
study('Machine Learning: Perceptron-based strategy (v.2)', overlay=true)
// Perceptron-based strategy
// Description:
// The Learning Perceptron is the simplest possible artificial neural network
// (ANN), consisting of just a single neuron and capable of learning a certain
// class of binary classification problems. The idea behind ANNs is that by
// selecting good values for the weight parameters (and the bias), the ANN can
// model the relationships between the inputs and some target.
// Generally, ANN neurons receive a number of inputs, weight each of those inputs,
// sum the weights, and then transform that sum using a special function called
// an activation function. The output of that activation function is then either
// used as the prediction (in a single neuron model) or is combined with the outputs
// of other neurons for further use in more complex models.
// The purpose of the activation function is to take the input signal (that’s the
// weighted sum of the inputs and the bias) and turn it into an output signal.
// Think of this activation function as firing (activating) the neuron when it
// returns 1, and doing nothing when it returns 0. This sort of computation is
// accomplished with a function called step function: f(z) = {1 if z > 0 else 0}.
// This function then transforms any weighted sum of the inputs and converts it
// into a binary output (either 1 or 0). The trick to making this useful is finding
// (learning) a set of weights that lead to good predictions using this activation
// function.
// Training our perceptron is simply a matter of initializing the weights to zero
// (or random value) and then implementing the perceptron learning rule, which
// just updates the weights based on the error of each observation with the current
// weights. This has the effect of moving the classifier’s decision boundary in the
// direction that would have helped it classify the last observation correctly.
// This is achieved via a for loop which iterates over each observation, making a
// prediction of each observation, calculating the error of that prediction and then
// updating the weights accordingly. In this way, weights are gradually updated
// until they converge. Each sweep through the training data is called an epoch.
// In this script the perceptron is retrained on each new bar trying to classify
// this bar by drawing the moving average curve above or below the bar.
// This script was tested with BTCUSD and USDJPY, and EURUSD.
// Note: TradingViews's playback feature helps to see this strategy in action.
// Warning: Signals ARE(!) repainting.
// Style tags: Trend Following, Trend Analysis
// Asset class: Equities, Futures, ETFs, Currencies and Commodities
// Dataset: FX Minutes/Hours/Days
//-------------------- Inputs
ptype = input('HL2', 'Price Type', options=['Open','High','Low','Close','HL2','OC2','OHL3','HLC3','OHLC4'])
ftype = input('Volatility','Filter Signals by', options=['Volatility','Volume','Both','None'])
holding_p = input(5, 'Holding Period |1..n|', minval=1)
show_pma = input(false, 'Show Perceptron MA?')
show_ema = input(false, 'Show EMA?')
//-------------------- System Variables
var int depth = 20 //-- the size of the dataset sample
var int epochs = 5 //-- number of sweeps through the data sample to train perceptron
var int BUY = -1
var int SELL = 1
var int HOLD = 0
var int p = 14 //-- the lookback window is constant
//-------------------- Dynamic Arrays
var float weight1 = 0.0 //-- or random value
var float weight2 = 0.0 //-- same here
var float bias = 0.0
var float errors = 0.0
var int signal = HOLD
var int hp_counter = 0 //-- holding period counter
//-------------------- Custom Functions
cAqua(g) => g>9?#0080FFff:g>8?#0080FFe5:g>7?#0080FFcc:g>6?#0080FFb2:g>5?#0080FF99
: g>4?#0080FF7f:g>3?#0080FF66:g>2?#0080FF4c:g>1?#0080FF33:#00C0FF19
cPink(g) => g>9?#FF0080ff:g>8?#FF0080e5:g>7?#FF0080cc:g>6?#FF0080b2:g>5?#FF008099
: g>4?#FF00807f:g>3?#FF008066:g>2?#FF00804c:g>1?#FF008033:#FF008019
volumeBreak(thres) =>
rsivol = rsi(volume, 14)
osc = hma(rsivol, 10)
osc > thres
volatilityBreak(volmin, volmax) => atr(volmin) > atr(volmax)
step_function(output) => output > 0 ? 1 : -1
//-------------------- Logic
ds = ptype=='Open' ? open
: ptype=='High' ? high
: ptype=='Low' ? low
: ptype=='Close' ? close
: ptype=='HL2' ? (high+low)/2
: ptype=='OC2' ? (open+close)/2
: ptype=='OHL3' ? (open+high+low)/3
: ptype=='HLC3' ? (high+low+close)/3
: (open+high+low+close)/4
filter = ftype=='Volatility' ? volatilityBreak(1, 10)
: ftype=='Volume' ? volumeBreak(49)
: ftype=='Both' ? volatilityBreak(1, 10) and volumeBreak(49)
: true
// Training loop
// Note: factors must be scaled to the identical interval. Here
// by default it is [0..100] due to the nature of the selected factors
for j=1 to epochs //-- for each epoch
for i=1 to depth //-- iterate over the dataset to the specified depth
factor1 = rsi(ds[i], p) //-- and look into all but the latest data points
factor2 = cci(ds[i], p)
hypothesis = weight1*factor1 + weight2*factor2 + bias
yhat = step_function(hypothesis)
error = ds[i] - yhat
weight1 := weight1 + error*factor1 //-- learning rule
weight2 := weight2 + error*factor2
bias := bias + error
output = weight1*rsi(ds, p) + weight2*cci(ds, p) + bias //-- now produce 14th period output for the
prediction = step_function(output) //-- latest data point and classify it
errors := sum(abs(ds - prediction), depth)/2 //-- Note: this effectively produces a moving average!
//slope = -weight1/weight2
//intercept = -bias/weight2
//err_ma = errors/10 + (adj ? -1 : 0) //-- some asset prices require adjustment
err_ma = errors/10 + -1 //-- by trial and error
signal := ds > err_ma and filter ? BUY : ds < err_ma and filter ? SELL : nz(signal[1])
changed = change(signal)
hp_counter := changed ? 0 : hp_counter + 1
startLongTrade = changed and signal==BUY
startShortTrade = changed and signal==SELL
endLongTrade = (signal==BUY and hp_counter==holding_p and not changed) or (changed and signal==SELL)
endShortTrade = (signal==SELL and hp_counter==holding_p and not changed) or (changed and signal==BUY)
//-------------------- Rendering
plot(show_pma ? err_ma : na, 'Perceptron', color.blue, 2)
plot(show_ema ? ema(ds, p) : na, 'EMA', color.orange, 2)
plotshape(startLongTrade, 'Buy', shape.labelup, location.belowbar, cAqua(10), 0, 0, '', color.white, false, size.small)
plotshape(startShortTrade, 'Sell', shape.labeldown, location.abovebar, cPink(10), 0, 0, '', color.white, false, size.small)
plot(endLongTrade ? high : na, 'StopBuy', cAqua(6), 2, plot.style_cross)
plot(endShortTrade ? low : na, 'StopSell', cPink(6), 2, plot.style_cross)
//-------------------- Alerting
alertcondition(startLongTrade, "Buy Alert", "Possible Long Trade")
alertcondition(startShortTrade, "Sell Alert", "Possible Short Trade")
//-------------------- Backtesting
lot_size = input(100.0, 'Lot Size', options=[0.01,0.1,0.2,0.3,0.5,1,2,3,5,10,20,30,50,100,1000])
ohl3 = (open+high+low)/3
var float start_long_trade = 0.
var float long_trades = 0.
var float start_short_trade = 0.
var float short_trades = 0.
var int wins = 0
var int trade_count = 0
if startLongTrade
start_long_trade := ohl3
if endLongTrade
trade_count := 1
ldiff = (open - start_long_trade)
wins := ldiff > 0 ? 1 : 0
long_trades := ldiff * lot_size
if startShortTrade
start_short_trade := ohl3
if endShortTrade
trade_count := 1
sdiff = (start_short_trade - open)
wins := sdiff > 0 ? 1 : 0
short_trades := sdiff * lot_size
cumreturn = cum(long_trades) + cum(short_trades) //-- cumulative return
totaltrades = cum(trade_count)
totalwins = cum(wins)
totallosses = totaltrades - totalwins == 0 ? 1 : totaltrades - totalwins
//-------------------- Information
show_info = input(true, 'Show Info?')
var label lbl = na
tbase = (time - time[1]) / 1000
tcurr = (timenow - time_close[1]) / 1000
info = 'CR=' + tostring(cumreturn, '#.#')
+ '\nTrades: ' + tostring(totaltrades, '#')
+ '\nWin/Loss: ' + tostring(totalwins/totallosses, '#.##')
+ '\nWinrate: ' + tostring(totalwins/totaltrades, '#.#%')
+ '\nBar Time: ' + tostring(tcurr / tbase, '#.#%')
if show_info and barstate.islast
lbl := label.new(bar_index, close, info, xloc.bar_index, yloc.price,
color.new(color.blue, 100), label.style_label_left, color.black, size.small, text.align_left)
label.delete(lbl[1])