I want to code an application building up a short position (sellshort) to say CountOfPosition = 5.
Position 1 opened at start of application the subsequent trades opened following an increment above Tradeprice.
So far so good.
If the market falls the short positions are scaled out of incrementally (Exitshort).
New short positions are entered if the market rises again again an increment above Tradeprice.
My query.
If there has been an ExitShort (and this is the last most recent action) is TradePrice readjusted to this level (of the Exitshort) or does it stay at the level of the
previous Sellshort.
A broader question is how possible is it to “watch” variables as the code is executing to see how the variables are changing.
Thank you.
Following up on your questions about POSITIONPRICE and how to monitor variables, sometimes the best way to understand the concepts is with a complete, practical code example.
The code below is a full trading system for a LONG position that scales into the trade on pullbacks. Although it’s a long strategy, you can apply the exact same principles in reverse to build the SHORT system you described.
How the Code Works:
1)Initial Entry: The system enters a buy order only on the bar where the ema20 crosses over the ema100.
2)Static Levels: At the moment of entry, it calculates all future entry and exit levels based on the ATR (E1-E4, TP1-TP4, stoploss). These levels remain fixed for the entire duration of the trade.
3)Scaling-In: If the price pulls back to the predefined entry levels (E1, E2, etc.), the system adds more contracts to the position.
4)State Management: A variable n is used to count how many contracts have been added, ensuring the scaling-in happens in an orderly manner.
Key Takeaways for Your Questions
This example directly demonstrates the solutions to your original queries:
1)How to “Watch” Variables: The code uses graphonprice to draw all the calculated price levels and graph n to plot the number of open contracts. This is the most effective way to visualize your system’s internal logic and debug it.
2)POSITIONPRICE Behavior: We’ve specifically included the line graphonprice positionprice …. When you apply this to a chart, you will see a fuchsia line representing the average position price. Notice that this line only moves when a new buy order is executed.
// --- INDICATORS ---
ema20 = average[20,1](close)
ema100 = average[100,1](close)

// --- STRATEGY LOGIC ---

// Initial entry condition
if not onmarket and ema20 crosses over ema100 then
   // Calculate all levels ONCE at the time of entry
   atr = averagetruerange[14](close)
   stoploss = close - 5 * atr
   E1 = close - 1 * atr
   E2 = close - 2 * atr
   E3 = close - 3 * atr
   E4 = close - 4 * atr

   takeprofit = close + 5 * atr
   TP1 = close + 4 * atr
   TP2 = close + 3 * atr
   TP3 = close + 2 * atr
   TP4 = close + 1 * atr

   // Execute first trade and set initial stops/targets
   buy 1 contract at market
   set stop price stoploss
   set target price takeprofit

   // Initialize state counter
   n = 1
elsif not onmarket then
   // Reset counter if not in a trade
   n = 0
endif

// Scaling-in logic when a position is already open
if onmarket then
   if n = 1 and close < E1 then
      buy 1 contract at market
      n = 2
      set target price TP1 // Adjust target
   elsif n = 2 and close < E2 then
      buy 1 contract at market
      n = 3
      set target price TP2
   elsif n = 3 and close < E3 then
      buy 1 contract at market
      n = 4
      set target price TP3
   elsif n = 4 and close < E4 then
      buy 1 contract at market
      n = 5
      set target price TP4
   endif
endif


// --- VISUALIZATION (DEBUGGING) ---

// Draw the average position price on the chart
if onmarket then
   graphonprice positionprice as "position price" coloured("fuchsia")
endif

// Draw all calculated entry and exit levels
graphonprice takeprofit as "take profit" coloured("blue")
graphonprice TP1 as "TP1" coloured("blue",200)
graphonprice TP2 as "TP2" coloured("blue",160)
graphonprice TP3 as "TP3" coloured("blue",120)
graphonprice TP4 as "TP4" coloured("blue",90)
graphonprice stoploss as "Stop Loss" coloured("red")
graphonprice E1 as "E1" coloured("orange",200)
graphonprice E2 as "E2" coloured("orange",160)
graphonprice E3 as "E3" coloured("orange",120)
graphonprice E4 as "E4" coloured("orange",90)

// Plot the number of open contracts in a separate panel
graph n as "Contracts (n)"
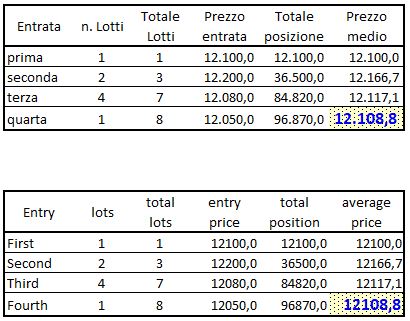
The attached pic shows how PositionPrice is calculated when accumulating positions.
As to TradePrice, it’s different, as it retains the price of the latest trading operation, the opening price when a position is entered, a closing price when a position is closed.