Two weeks after I submitted a report to PRT I have had the sort of response that doesn’t give me any hope they will ever get to the bottom of it. Meanwhile, I have found that I get different back test results depending on the start date of the test.
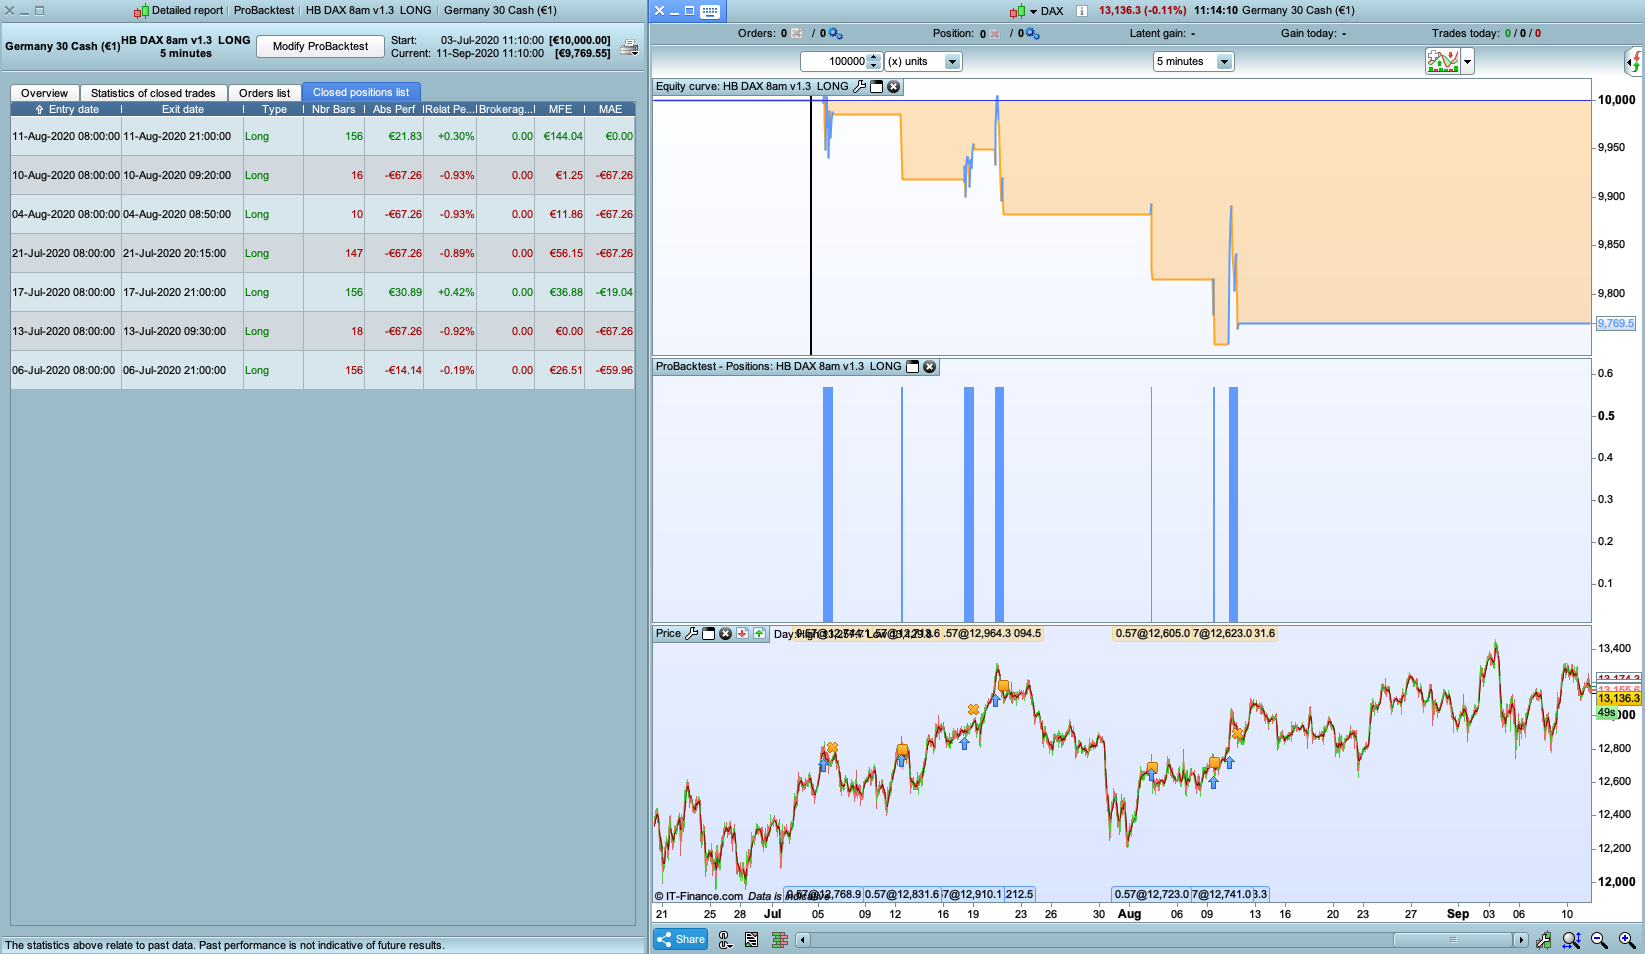
- Testing from 3 July – 11 September, I see no trades after 11 August.
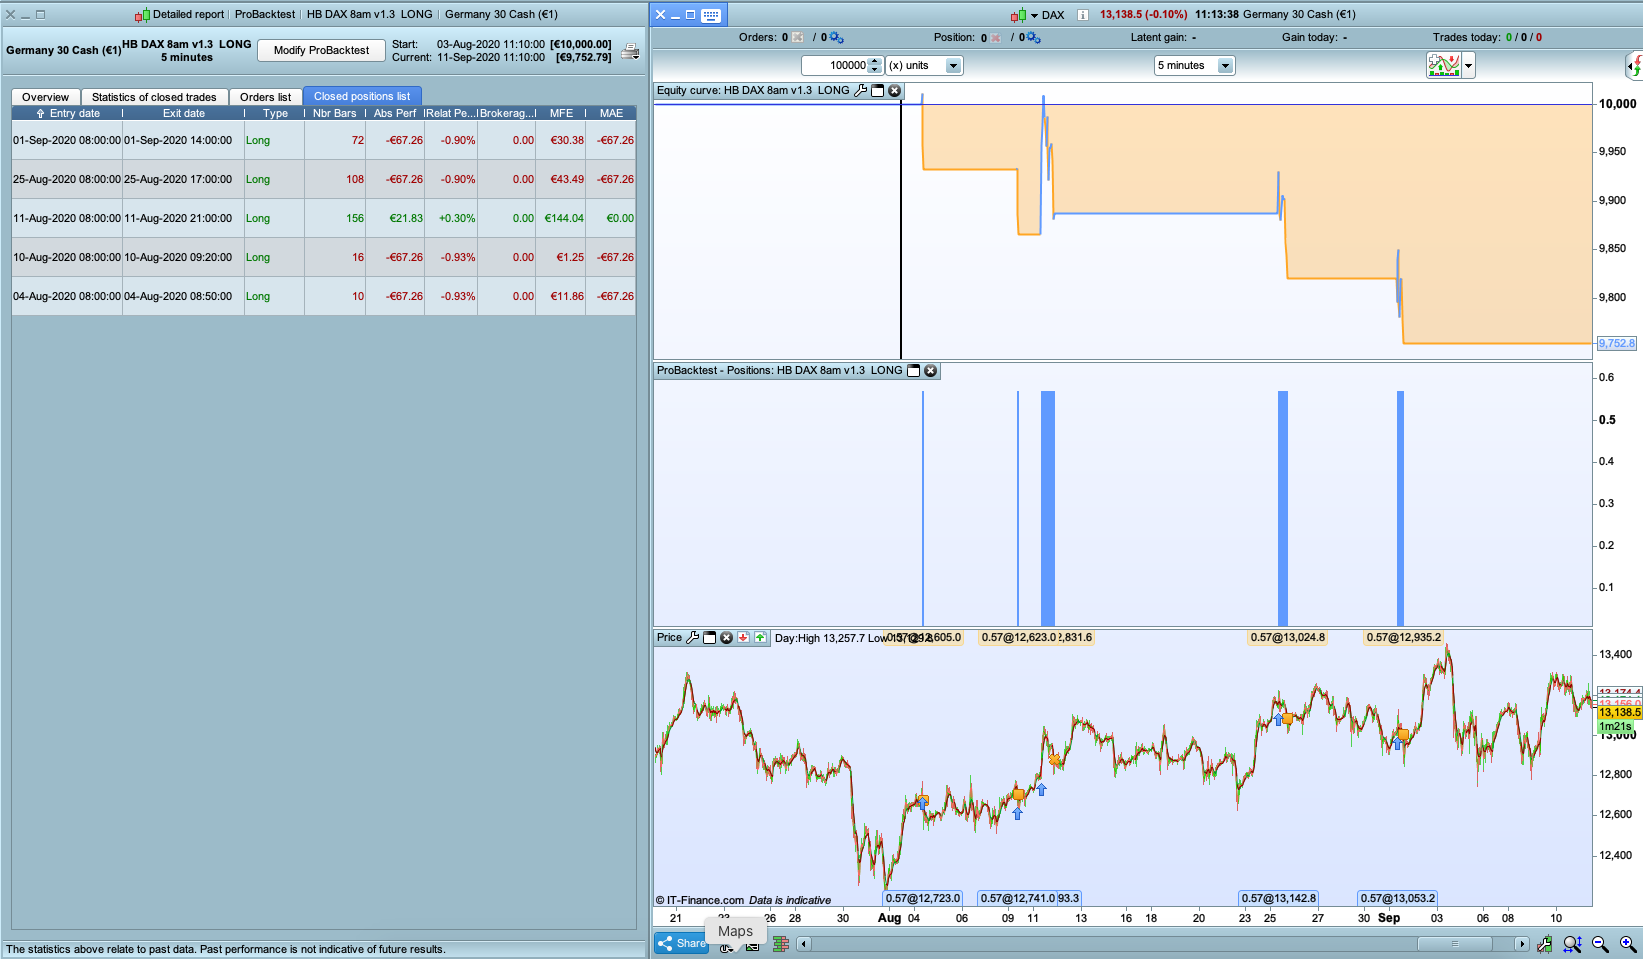
- Testing from 3 August – 11 September, I see trades up to 1 September, which includes the original missing live trade of 25 August.
You can see this in the screenshots, and you can see the start and finish dates at the top of the Detailed Report. The finish dates in both screenshots are 11 September.
Therefore my new theory is that the backtest doesn’t always test until the finish date, and that this depends on the start date. This is consistent with my other posts above. I would very much appreciate knowing if you find this too if you run the code, and if so, any insight into why this might happen and how to stop it from happening.
// HB DAX 8am v1.3  LONG

// Definition of code parameters
DEFPARAM CumulateOrders = False // Cumulating positions deactivated
// The system will cancel all pending orders and close all positions at "FLATAFTER" time. No new ones will be allowed until after the "FLATBEFORE" time.
DEFPARAM FLATBEFORE = 080000
// Cancel all pending orders and close all positions at the "FLATAFTER" time
DEFPARAM FLATAFTER = 210000

PoundsPerPoint = 0.58

// Prevents the system from placing new orders on specified days of the week
daysForbiddenEntry = OpenDayOfWeek = 6 OR OpenDayOfWeek = 0

timeframe(daily, updateonclose)
ATRdaily = AverageTrueRange[5]
ThreeDayMove = abs(lowest[3] - highest[3])
BigMove = ThreeDayMove > ATRdaily * 1.6

///**
PVI = PositiveVolumeIndex(close)
PVIlow = lowest[40](PVI) //20 on the daily

PVIok = PVI > PVIlow + 110 //100
///**

timeframe (3  hours, updateonclose)

dojidef = 3.5 //optimised
// Calculate Heikin Ashi candles
if barindex>1 then
haclose3hr=(open+close+low+high)/4
haopen3hr=(haopen3hr[1]+haClose3hr[1])/2
xHigh3hr = Max(haOpen3hr, haClose3hr)
xLow3hr = Min(haOpen3hr, haClose3hr)
hahigh3hr = Max(High,xHigh3hr)
halow3hr = Min(Low,xLow3hr)
endif

Long3hr = (haclose3hr > haopen3hr)
IF Long3hr THEN
dojiL = abs((hahigh3hr - haclose3hr) / (halow3hr - haopen3hr + 0.1))
IF dojiL < dojidef THEN
Long3hr = 0     //don't enter if it's a doji, ie long wick and tail
ENDIF
ENDIF

Short3hr = (haclose3hr < haopen3hr)
IF Short3hr THEN
dojiS = abs((hahigh3hr - haopen3hr) / (halow3hr - haclose3hr + 0.1))
IF dojiS > dojidef THEN
Short3hr = 0     //don't enter if it's a doji, ie long wick and tail
ENDIF
ENDIF


timeframe(5 minutes)

if barindex>1 then
haclose5m=(open+close+low+high)/4
haopen5m=(haopen5m[1]+haclose5m[1])/2
endif

IF time = 080000 THEN
Long5m = (haopen5m[10] > haclose5m[14]) // 30.56% 2/1/19 - 5/20


IF Long5m AND Long3hr AND NOT Short3hr AND not BigMove AND not daysForbiddenEntry AND PVIok THEN //AND AwayFromMH
//BUY PoundsPerPoint PERPOINT AT MARKET
BUY PoundsPerPoint CONTRACT AT MARKET
ENDIF

SET STOP pLOSS 118  //optimised

ENDIF
@teapot2002
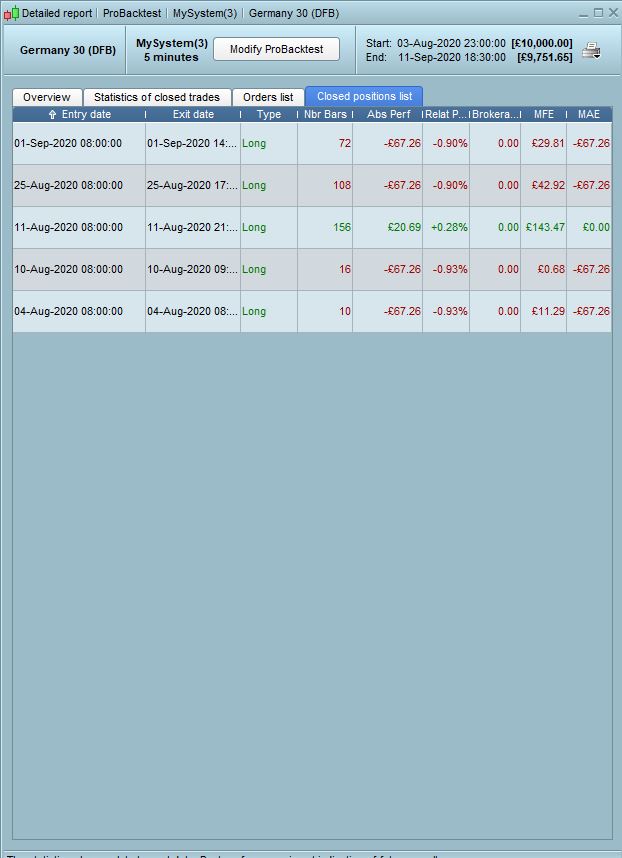
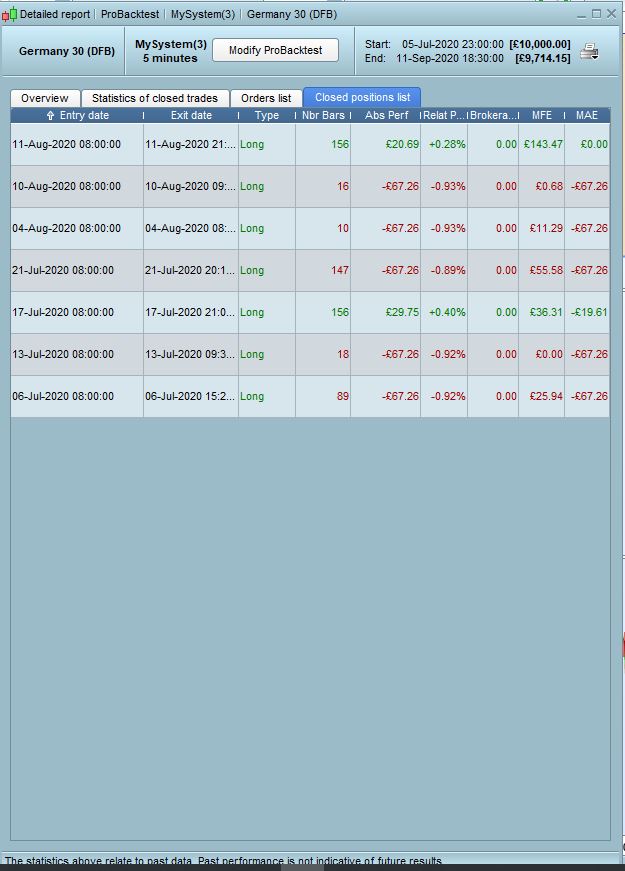
I tried this using your code against the Germany 30 (DFB) and get the same results that you do, see attached.
Hmm seems to be an issue with the submit which removed the second attachment, here it is:
@AutoStrategist, thank you for confirming my results.
Recent results can be missing from the backtest, depending on the start date.
@Nicolas, @GraHal, @Vonasi, I think that this should cause concern.
In the screenshots above I show:
- backtest dates from 3 Aug – 11 Sept give 5 trades, from 4 Aug – 1 Sept. It is believable that the 1 Sept trade is the last trade before 11 Sept.
- backtest dates from 3 July – 11 Sept give 7 trades, from 6 July – 11 Aug. Trades after 11 Aug are not shown, including the 1 Sept trade.
Surely this can’t be right?
Have you checked the variables values from the daily timeframe with GRAPH? To see if there are any difference between the 2 backtests? If not, please check.
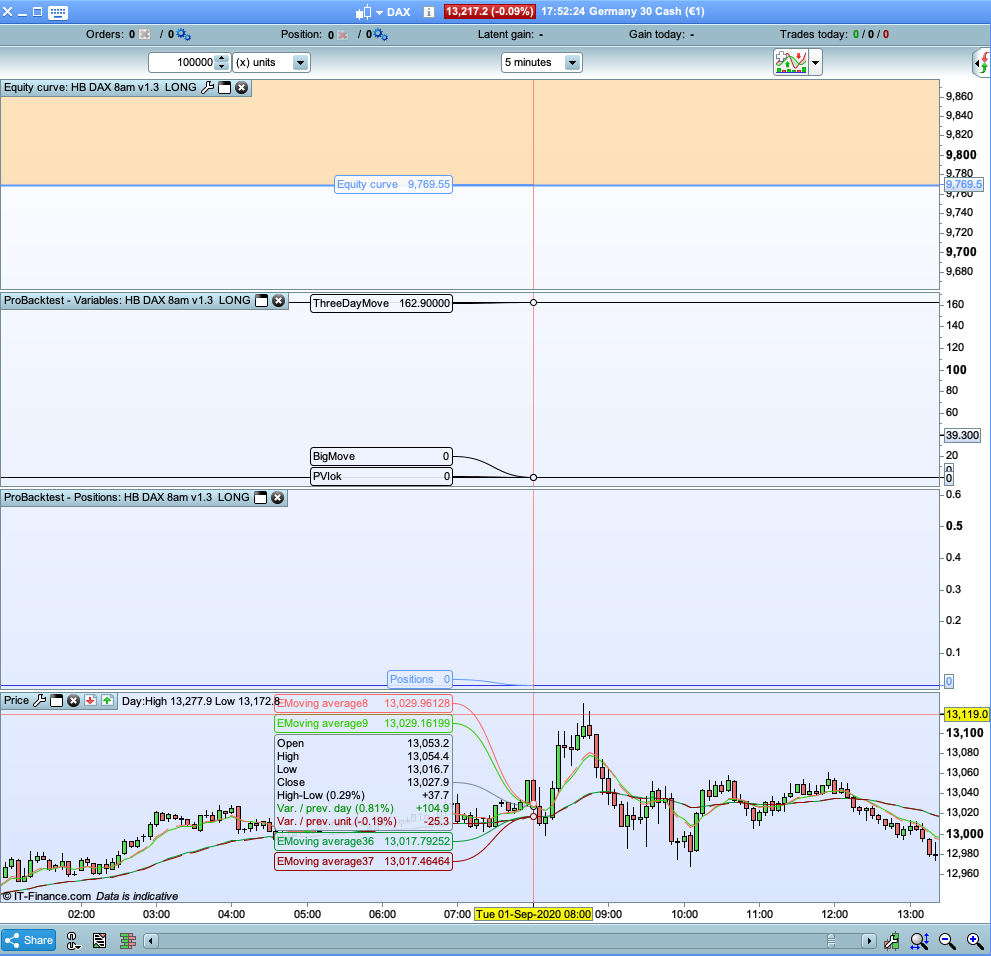
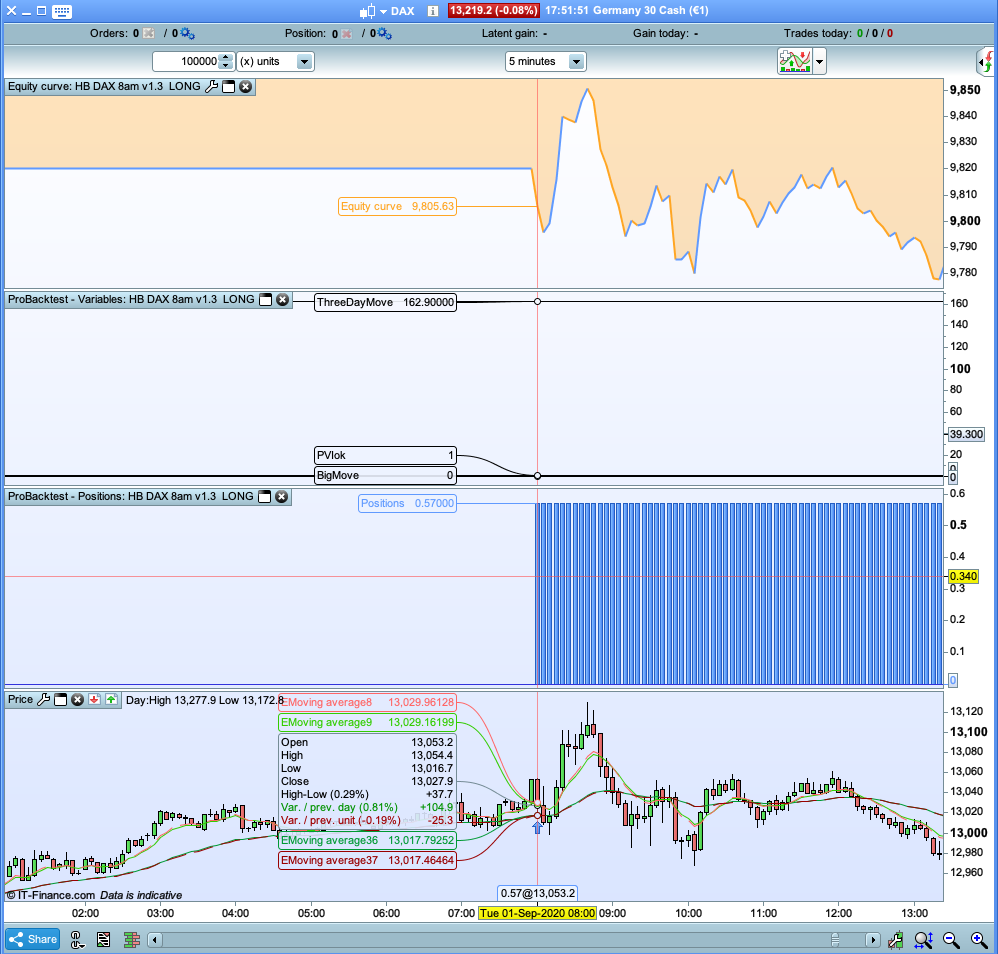
I’ve just tried this, and no, the variables are not the same; PVIok is zero for the shorter backtest time, when the 1 September trade doesn’t run. Screenshots attached.
Very interesting, and it makes sense that the trade doesn’t run when this variable is zero. However… why is it different? The only thing that I’m changing is the earlier backtest date, from 3 August (when the trade happens) to 3 July (when it doesn’t).
@Nicolas, you’ll see from my post above that your question was a good one. Do you have any suggestions for why changing the backtest start date affects a variable in the test?
ok that means that the PVI (Positive Volume Index) indicator value is not the same, because it doesn’t rely on period of calculation. So it seems obvious that the condition result is not the same and therefore quantity of orders too.