Bonjour A tous,
j’utilise le code ci dessous pour tracer les PP 1H.
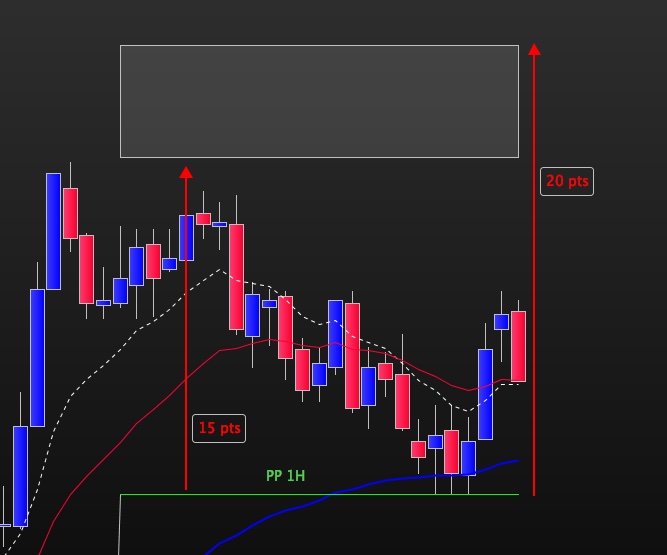
j’aimerais que sur l’heure en cours, il soit tracé un rectangle se trouvant a 15/20 points au dessus et en dessous du PP1H ( voir fichier joint pour exemple au dessus du PP)
Comment peut on coder cela ?
Merci
Pivot = 1

IF Openhour <> openhour [ 1 ]  THEN
//
MyEnd      = (Opendate * 1000000) + (OpenHour * 10000) + (5900)   //YYYYMMDDHHMMSS
MyPP        = PP
StartBar    = BarIndex
//
myLastHigh  = myHigh
myLastLow   = myLow
myLastClose = Close [ 1 ]
myHigh = High
myLow = Low
myopen = open
ELSE
myHigh = Max(myHigh, High)
myLow = Min(myLow, Low)
ENDIF

// Formule en fonction de la valeur du paramètre Pivot
IF Pivot = 2 THEN
// Point pivot : PP= (Hveille + Bveille + Cveille + Ojour) / 4
PP = (myLastHigh + myLastLow + myLastClose + myopen) / 4
ELSIF Pivot = 3 THEN
// Point pivot : PP= (Hveille + Bveille + Ojour) / 3
PP = (myLastHigh + myLastLow + myopen) / 3
ELSE
// Point pivot : PP= (Hveille + Bveille + Cveille) / 3
PP = (myLastHigh + myLastLow + myLastClose) / 3

ENDIF

Res1 = 2 * PP - myLastLow
Res2 = PP + myLastHigh - myLastLow
Res3 = myLastHigh + 2 * (PP - myLastLow)
Sup1 = 2 * PP - myLastHigh
Sup2 = PP - myLastHigh + myLastLow
Sup3 = myLastLow - 2 * (myLastHigh - PP)
DrawSegment(StartBar,PP,DateToBarIndex(MyEnd),PP) coloured(0,255,0,255) style(Line, 1)
Return pp
J’ai essayé d’avancer, j’ai fait plus simple pour le tracé du PP 1H
Ensuite plutôt qu’un rectangle 4 segments situés a 15 pts et 20 pts en dessus et en dessous du PP1H, segment de la longueur seulement du PP1H
En fait j’aierais déclaer le PP1H a 15 et 20 pts en dessous et au dessus du PP1H
J’ai essayé avec DRAWHLINE, mais ici les lignes sont tracés sur toute la longeur et sur tous les PP 1H, cela ne convient donc pas
Dans le code ci dessous que pourrais je mettre comme instruction entre les parenthèses de DRAWSEGMENT ?
Ou bien un code qui me décale le PP1H de 15 et 20 pts
Merci pour votre aide
timeframe(1 hour)
//point pivot en UT 1 heure
PivotH1 = (High[1] + Low[1] + Close[1])/3

//DrawSegment(15 points au dessus du PP) coloured(0,255,0,255) style(dottedline, 1)
//DrawSegment(20 points au dessus du PP) coloured(0,255,0,255) style(dottedline, 1)
//DrawSegment(15 points en dessous du PP) coloured(0,255,0,255) style(dottedline, 1)
//DrawSegment(20 points en dessus du PP) coloured(0,255,0,255) style(dottedline, 1)
DrawHLINE(PivotH1+15*pipsize) coloured(0,255,0,255) style(dottedline, 1)

Return PivotH1
J’ai aussi essayé avec ce code mais là plus rien ne s’affiche :
timeframe(1 hour)
//point pivot en UT 1 heure
PivotH1 = (High[1] + Low[1] + Close[1])/3
P15SUP = PivotH1+15*pipsize
P20SUP = PivotH1+20*pipsize
P15INF = PivotH1-15*pipsize
P20INF = PivotH1-20*pipsize

Return PivotH1 and P15SUP and P20SUP and P15INF and P20INF
Bonjour,
Basé sur post de départ, code pour rectangles dessus/dessous pour heure en cours. On peut enlever la première ligne en drawonlastbaronly si on veut tous les rectangles de l’historique au lieu de juste l’heure en cours
defparam DRAWONLASTBARONLY=true

Pivot = 1

IF Openhour <> openhour [ 1 ] THEN
//
MyEnd = (Opendate * 1000000) + (OpenHour * 10000) + (5900) //YYYYMMDDHHMMSS
MyPP = PP
StartBar = BarIndex
//
myLastHigh = myHigh
myLastLow = myLow
myLastClose = Close [ 1 ]
myHigh = High
myLow = Low
myopen = open
ELSE
myHigh = Max(myHigh, High)
myLow = Min(myLow, Low)
ENDIF

// Formule en fonction de la valeur du paramètre Pivot
IF Pivot = 2 THEN
// Point pivot : PP= (Hveille + Bveille + Cveille + Ojour) / 4
PP = (myLastHigh + myLastLow + myLastClose + myopen) / 4
ELSIF Pivot = 3 THEN
// Point pivot : PP= (Hveille + Bveille + Ojour) / 3
PP = (myLastHigh + myLastLow + myopen) / 3
ELSE
// Point pivot : PP= (Hveille + Bveille + Cveille) / 3
PP = (myLastHigh + myLastLow + myLastClose) / 3

ENDIF

Res1 = 2 * PP - myLastLow
Res2 = PP + myLastHigh - myLastLow
Res3 = myLastHigh + 2 * (PP - myLastLow)
Sup1 = 2 * PP - myLastHigh
Sup2 = PP - myLastHigh + myLastLow
Sup3 = myLastLow - 2 * (myLastHigh - PP)

DrawRectangle(StartBar,PP+15*pipsize,DateToBarIndex(MyEnd),PP+20*pipsize) coloured(0,255,0)
DrawRectangle(StartBar,PP-15*pipsize,DateToBarIndex(MyEnd),PP-20*pipsize) coloured(0,255,0)

Return pp
Super, parfait merci du retour.