Evening All,
Amazing work on creating this site! Absolutely love it. I was wondering if anyone has the code for Time Segmented Volume that Worden Brothers produced?
any help gratefully received 🙂
There you go:
// TSV Time Segmented Volume indicator
//
// --------------------------------------------------------------------------------------
// 13 = number of daily HALF HOURS
//  7 = ????
// --------------------------------------------------------------------------------------
//      Example Settings:
// Short Term Trading       :  TSV period between  9 and 12
// Intermediate Term Trading:  TSV period between 18 and 25
// Long Term Trading        :  TSV period between 35 and 45
//
// --------------------------------------------------------------------------------------
//ONCE p1    = 13
//ONCE p2    = 7
//ONCE Mtype = 0
p1           = max(1,min(999,p1))
p2           = max(1,min(999,p2))
Mtype        = max(0,min(6,Mtype))
MyVol = 0
IF close > close[1] THEN
   MyVol = volume * (close - close[1])
ELSIF close < close[1] THEN
   MyVol = -volume * (close - close[1])
ENDIF
TSV    = summation[p1](MyVol)
Signal = average[p2,Mtype](TSV)
RETURN TSV AS "Tsv",Signal AS "Signal"
Thank you very much Roberto.
Much appreciated
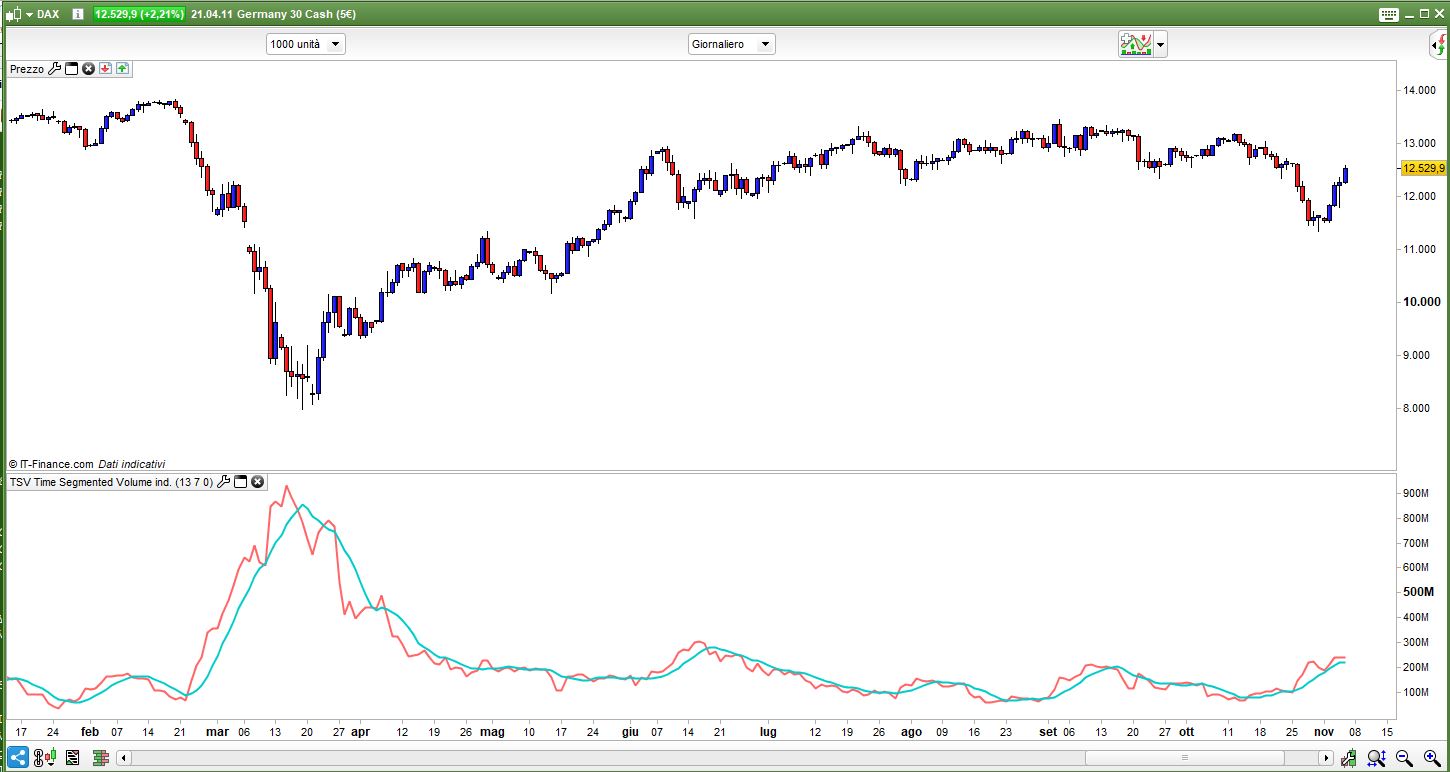
I am currently using balance of power which would work really well hand in hand with TSV. I can run them side by side but I would love to be build TSV onto my balance of power indicator.
Do you think this could be done?
thanks again for your support.
Regards
Alastair
What code do you use as balance of power ?
It is the BOP from Nicholas I believe.
please see attached picture.
As you can see they don’t share the scale, values are so much different!
Try to better explain what you mean by “I would love to be build TSV onto my balance of power indicator“.
Good Morning,
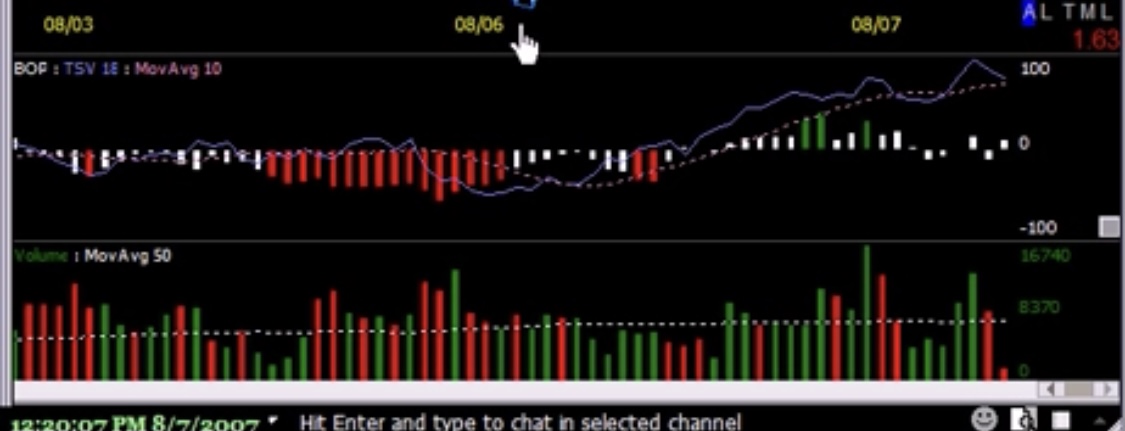
Sorry, I am not doing a very good job of explaining this. Perhaps it is easiest if I show you what I am hoping to reproduce.
Please see attached picture 🙂 this combines BOP : TSV : MA
Many thanks
al_craig – Please always use the ‘Insert PRT Code’ button when posting code rather than expect the person helping you to type it all out from a screen shot.
Like this:
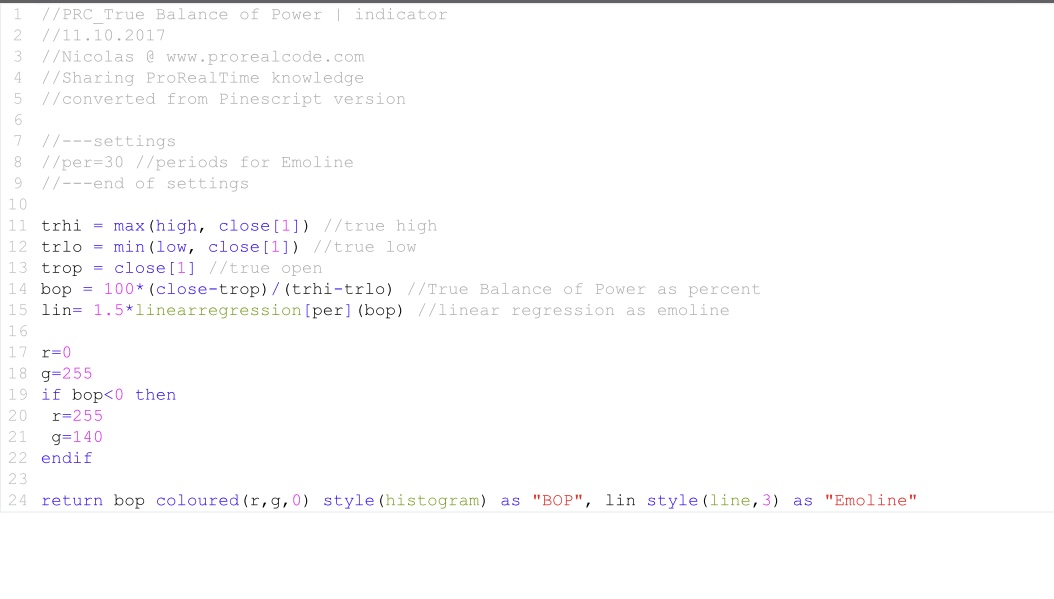
//PRC_True Balance of Power | indicator
//11.10.2017
//Nicolas @ www.prorealcode.com
//Sharing ProRealTime knowledge
//converted from Pinescript version

//---settings
//per=30 //periods for Emoline
//---end of settings

trhi = max(high, close[1]) //true high
trlo = min(low, close[1]) //true low
trop = close[1] //true open
bop = 100*(close-trop)/(trhi-trlo) //True Balance of Power as percent
lin= 1.5*linearregression[per](bop) //linear regression as emoline

r=0
g=255
if bop<0 then
 r=255
 g=140
endif

return bop coloured(r,g,0) style(histogram) as "BOP", lin style(line,3) as "Emoline"
Alternatively provide a link to where the code can be found:
Balance of Power
Good Morning Vonasi,
Yes, not a problem. Sorry for not doing this originally. I will ensure this is done in the future.
Many Thanks
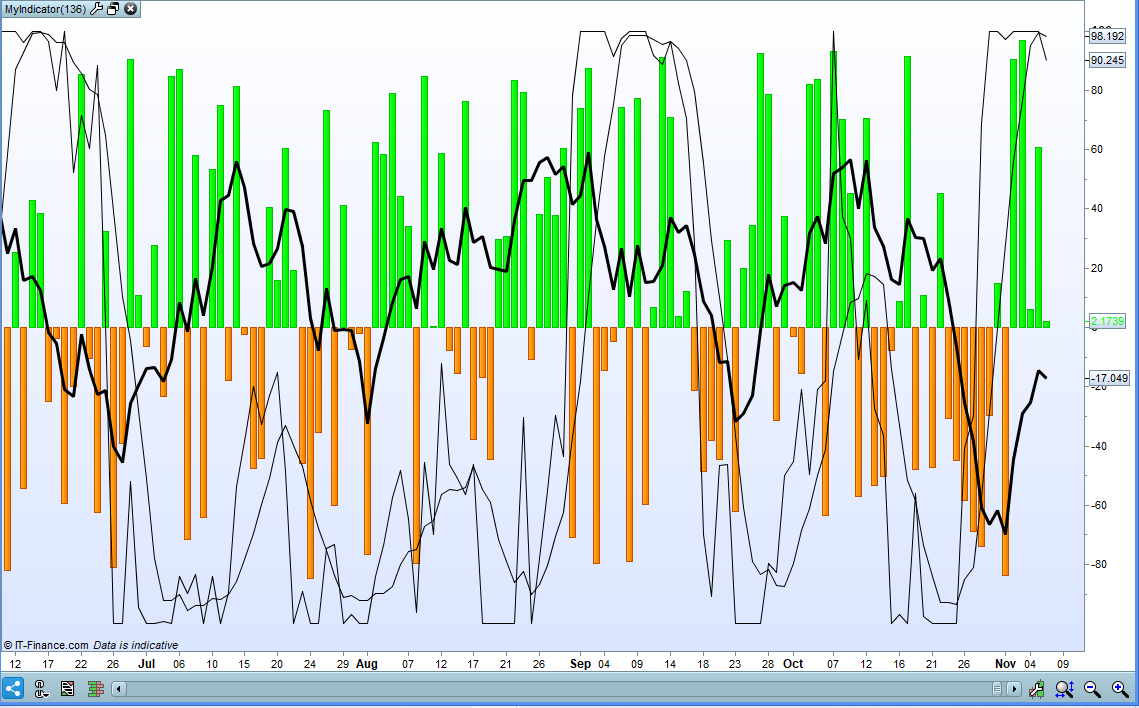
You explained yourself very well, but it’s impossible, since:
- TSV cannot drop below 0
- TSV has a different scale than BOP.
In your image TSV has been somehow normalised to only return between -100 and +100. We would need to know how this normalisation has been calculated. In this example I have normalised it by comparing the current TSV to the highest and lowest TSV values in the last P1 bars.
//PRC_True Balance of Power | indicator
//11.10.2017
//Nicolas @ www.prorealcode.com
//Sharing ProRealTime knowledge
//converted from Pinescript version

//---settings
per=30 //periods for Emoline
//---end of settings

trhi = max(high, close[1]) //true high
trlo = min(low, close[1]) //true low
trop = close[1] //true open
bop = 100*(close-trop)/(trhi-trlo) //True Balance of Power as percent
lin= 1.5*linearregression[per](bop) //linear regression as emoline

r=0
g=255
if bop<0 then
r=255
g=140
endif

// TSV Time Segmented Volume indicator
//
// --------------------------------------------------------------------------------------
// 13 = number of daily HALF HOURS
//  7 = ????
// --------------------------------------------------------------------------------------
//      Example Settings:
// Short Term Trading       :  TSV period between  9 and 12
// Intermediate Term Trading:  TSV period between 18 and 25
// Long Term Trading        :  TSV period between 35 and 45
//
// --------------------------------------------------------------------------------------

ONCE p1    = 13
ONCE p2    = 7
ONCE Mtype = 0

p1           = max(1,min(999,p1))
p2           = max(1,min(999,p2))
Mtype        = max(0,min(6,Mtype))
once lookback = p1

MyVol = 0
IF close > close[1] THEN
MyVol = volume * (close - close[1])
ELSIF close < close[1] THEN
MyVol = -volume * (close - close[1])
ENDIF
TSV    = summation[lookback](MyVol)

maxtsv = highest[lookback](tsv)
mintsv = lowest[lookback](tsv)
tsvresult = (((tsv-mintsv)/(maxtsv - mintsv))*200)-100
Signal = average[p2,Mtype](TSVresult)

RETURN  bop coloured(r,g,0) style(histogram) as "BOP", lin style(line,3) as "Emoline", TSVresult AS "Tsv",Signal AS "Signal"
Thank you both very much for your efforts. It is very much appreciated.
I will go away and do some more homework to see what I can find out.
Thanks again
I think the correct code should be like the one attached,
I don’t know if this is correct since I don’t know much about programming but it makes much more sense.
IF close > close[1] THEN
MyVol = volume * (close - close[1])
ELSIF close < close[1] THEN
MyVol1 = volume * (close[1] - close)
ENDIF

Vol = MyVol-MyVol1

TSV = summation[per](Vol)
Signal = average[sign](TSV)

if TSV >= TSV[1] then
color =1
else
color =-1
endif

RETURN TSV coloured by color AS "Tsv",Signal AS "Signal"
It’s the same, but since the formula I could find is TSV=(Sum( IIf( C > Ref(C,-1), V * ( C-Ref(C,-1) ), IIf( C < Ref(C,-1),-V * ( C-Ref(C,-1) ), 0 ) ) ,18)); I wrote as I did.
Multiplying 10*-1000 is the same as multiplying -10*1000.
There should be no difference on your chart.