Bonjour,
j’ai établi un code pour lequel je rencontre certaines difficultés.
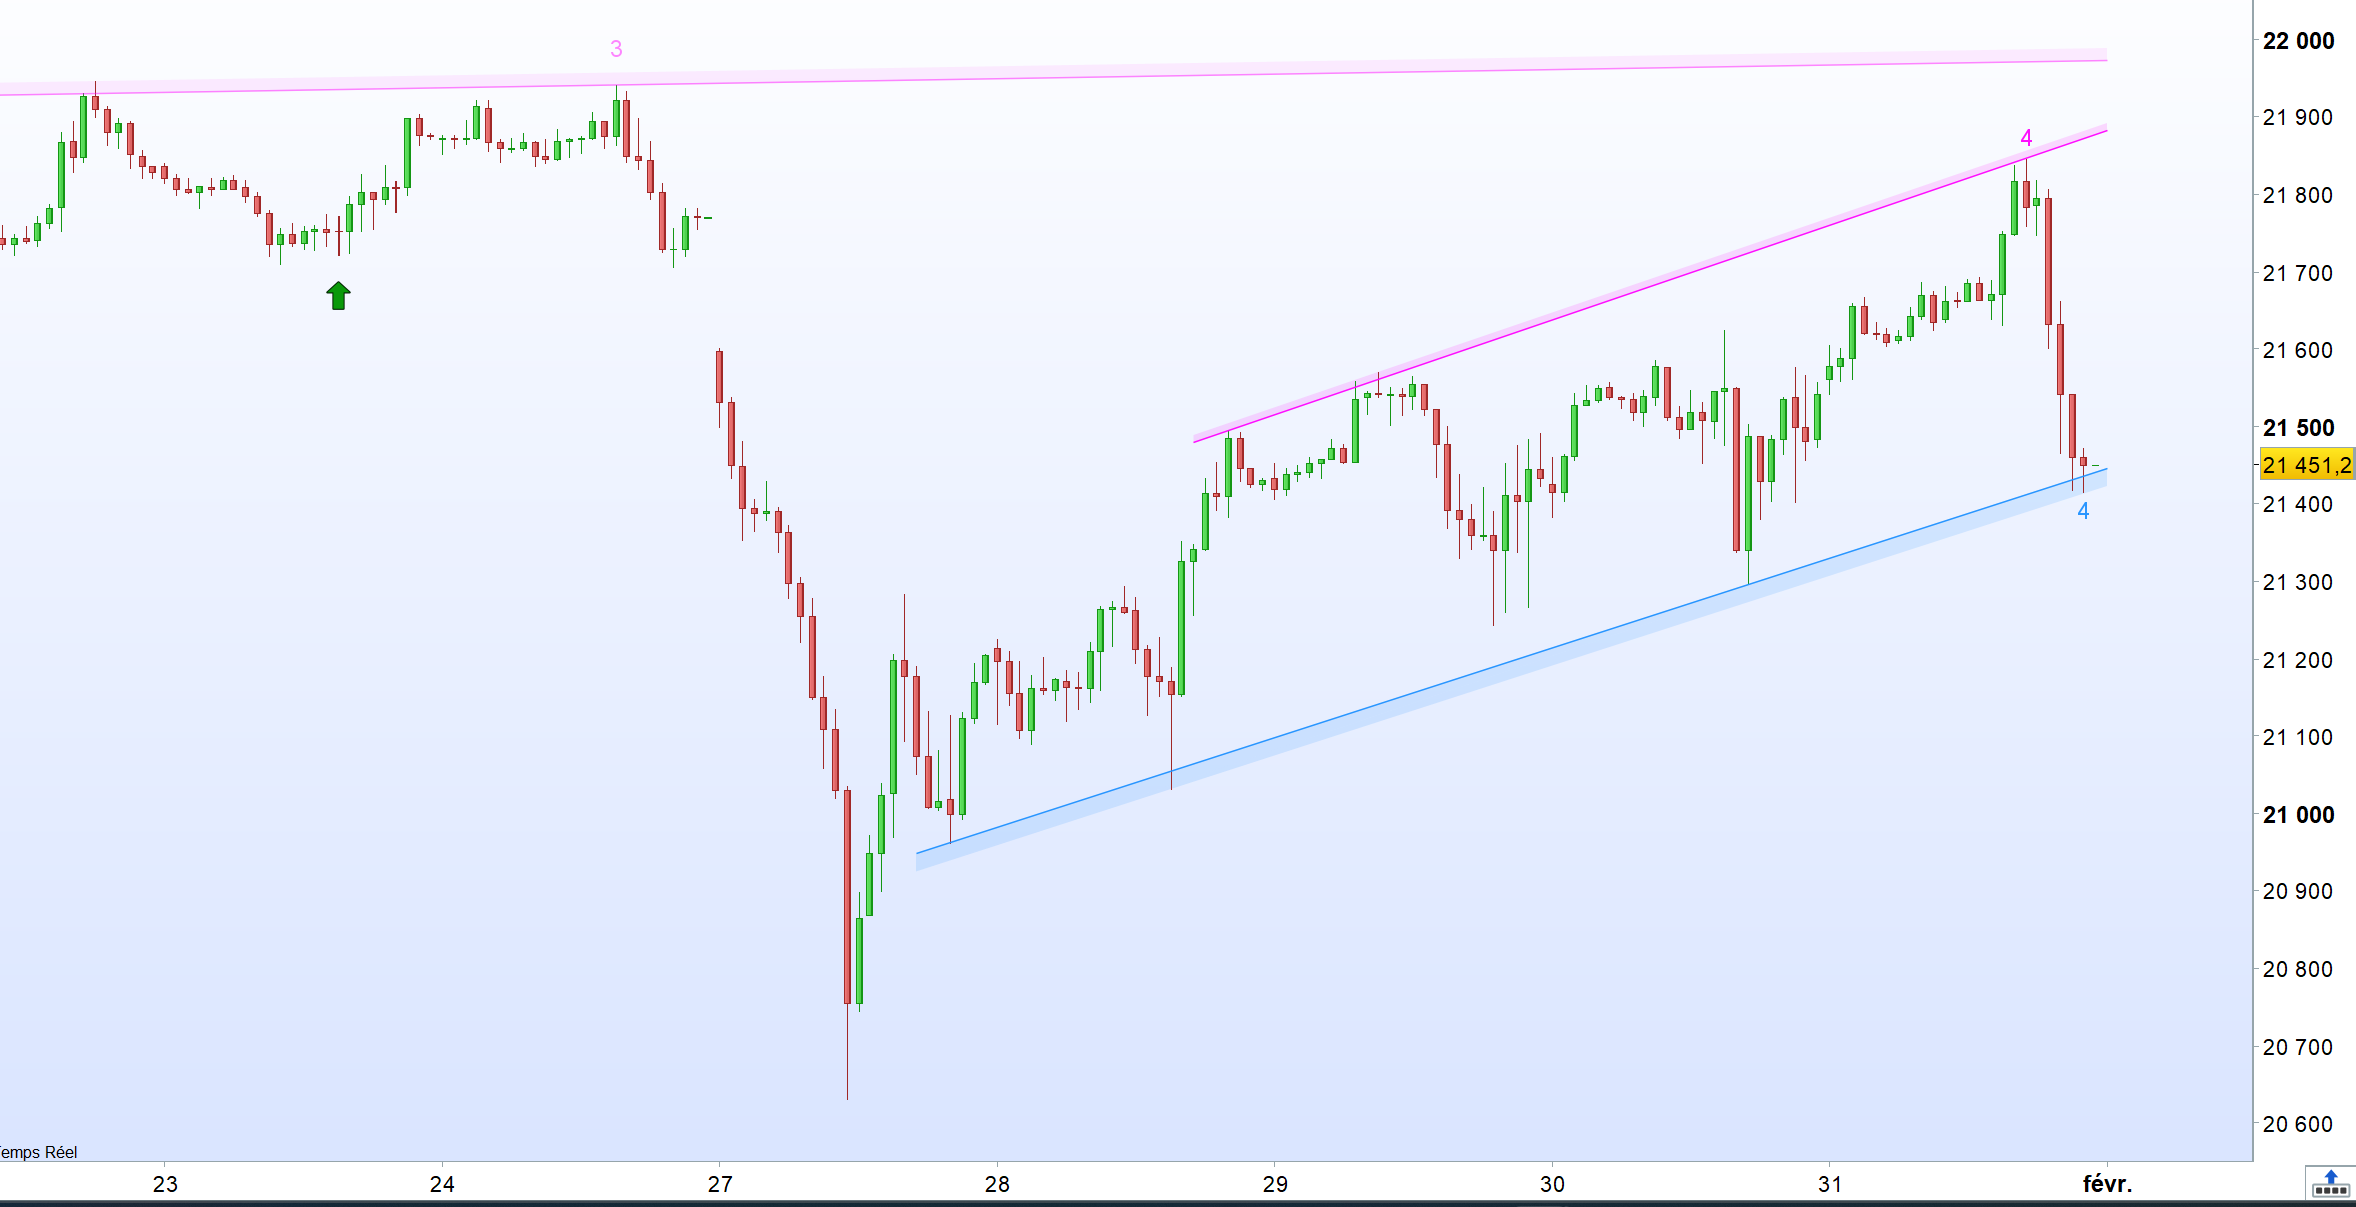
Conditions de départ pour définir une reprise de tendance haussière.
1) sommet 1> sommet 2 et sommet 2 < sommet 3
2) creux 1 > creux 2
3) Si sommet (S) et creux (C):
S1 est plus récent que S2 et S2 est plus récent que S3. Idem pour c1, c2 et c3.
4) S1 est en abscisse avant C1 et C2 est situé entre S1 et S2.
5) afficher texte sous low C1
Au niveau des ordonnées cela semble fonctionner mais cela ne marche pas au niveau des abscisses. c’est à dire que je n’arrive pas à bloquer dans mon code un enchainement correct des sommets et des creux.
Merci à vous pour vos lumières.
sommet=high<high[1] and high[1]>high[2]
creux= low>low[1] and low[1]<low[2]
if sommet then // sommet 1
xs1=barindex[1]
ys1=high[1]
endif
if Creux then // creux 1
xc1=barindex[1]
yc1=low[1]
endif
if sommet then // sommet 2
xs2=xs1[1]
ys2=ys1[1]
endif
if Creux then // creux 2
xc2=xc1[1]
yc2=yc1[1]
endif

if Creux then // creux 3
xc3=xc2[1]
yc3=yc2[1]
endif
ConditionY= yc1>yc2 and yc2<yc3 and ys1>ys2
ConditionX= XC1<XS1 AND XC2>XS2 AND XC2 <XS2
if ConditionY and ConditionX then // CREUX
drawtext("DOW UP",XC1,YC1,Dialog,Bold,10) coloured(10,153,10)
endif
// Once length = 1
once S1x = 0
once S2x = 0
once S3x = 0
sommet = high[length] = highest[2*length+1](high)
creux = low[length] = lowest[2*length+1](low)
If sommet then
S3x = S2x
S3y = S2y
S2x = S1x
S2y = S1y
S1x = barindex-length
S1y = high[length]
Endif
If creux then
C3x = C2x
C3y = C2y
C2x = C1x
C2y = C1y
C1x = barindex-length
C1y = low[length]
Endif
ConditionY = C1y > C2y and C2y < C3y and S1y > S2y and S2y < S3y
ConditionX = S1x > C1x and C1x > S2x and S2x > C2x and C2x > S3x and S3x > C3x
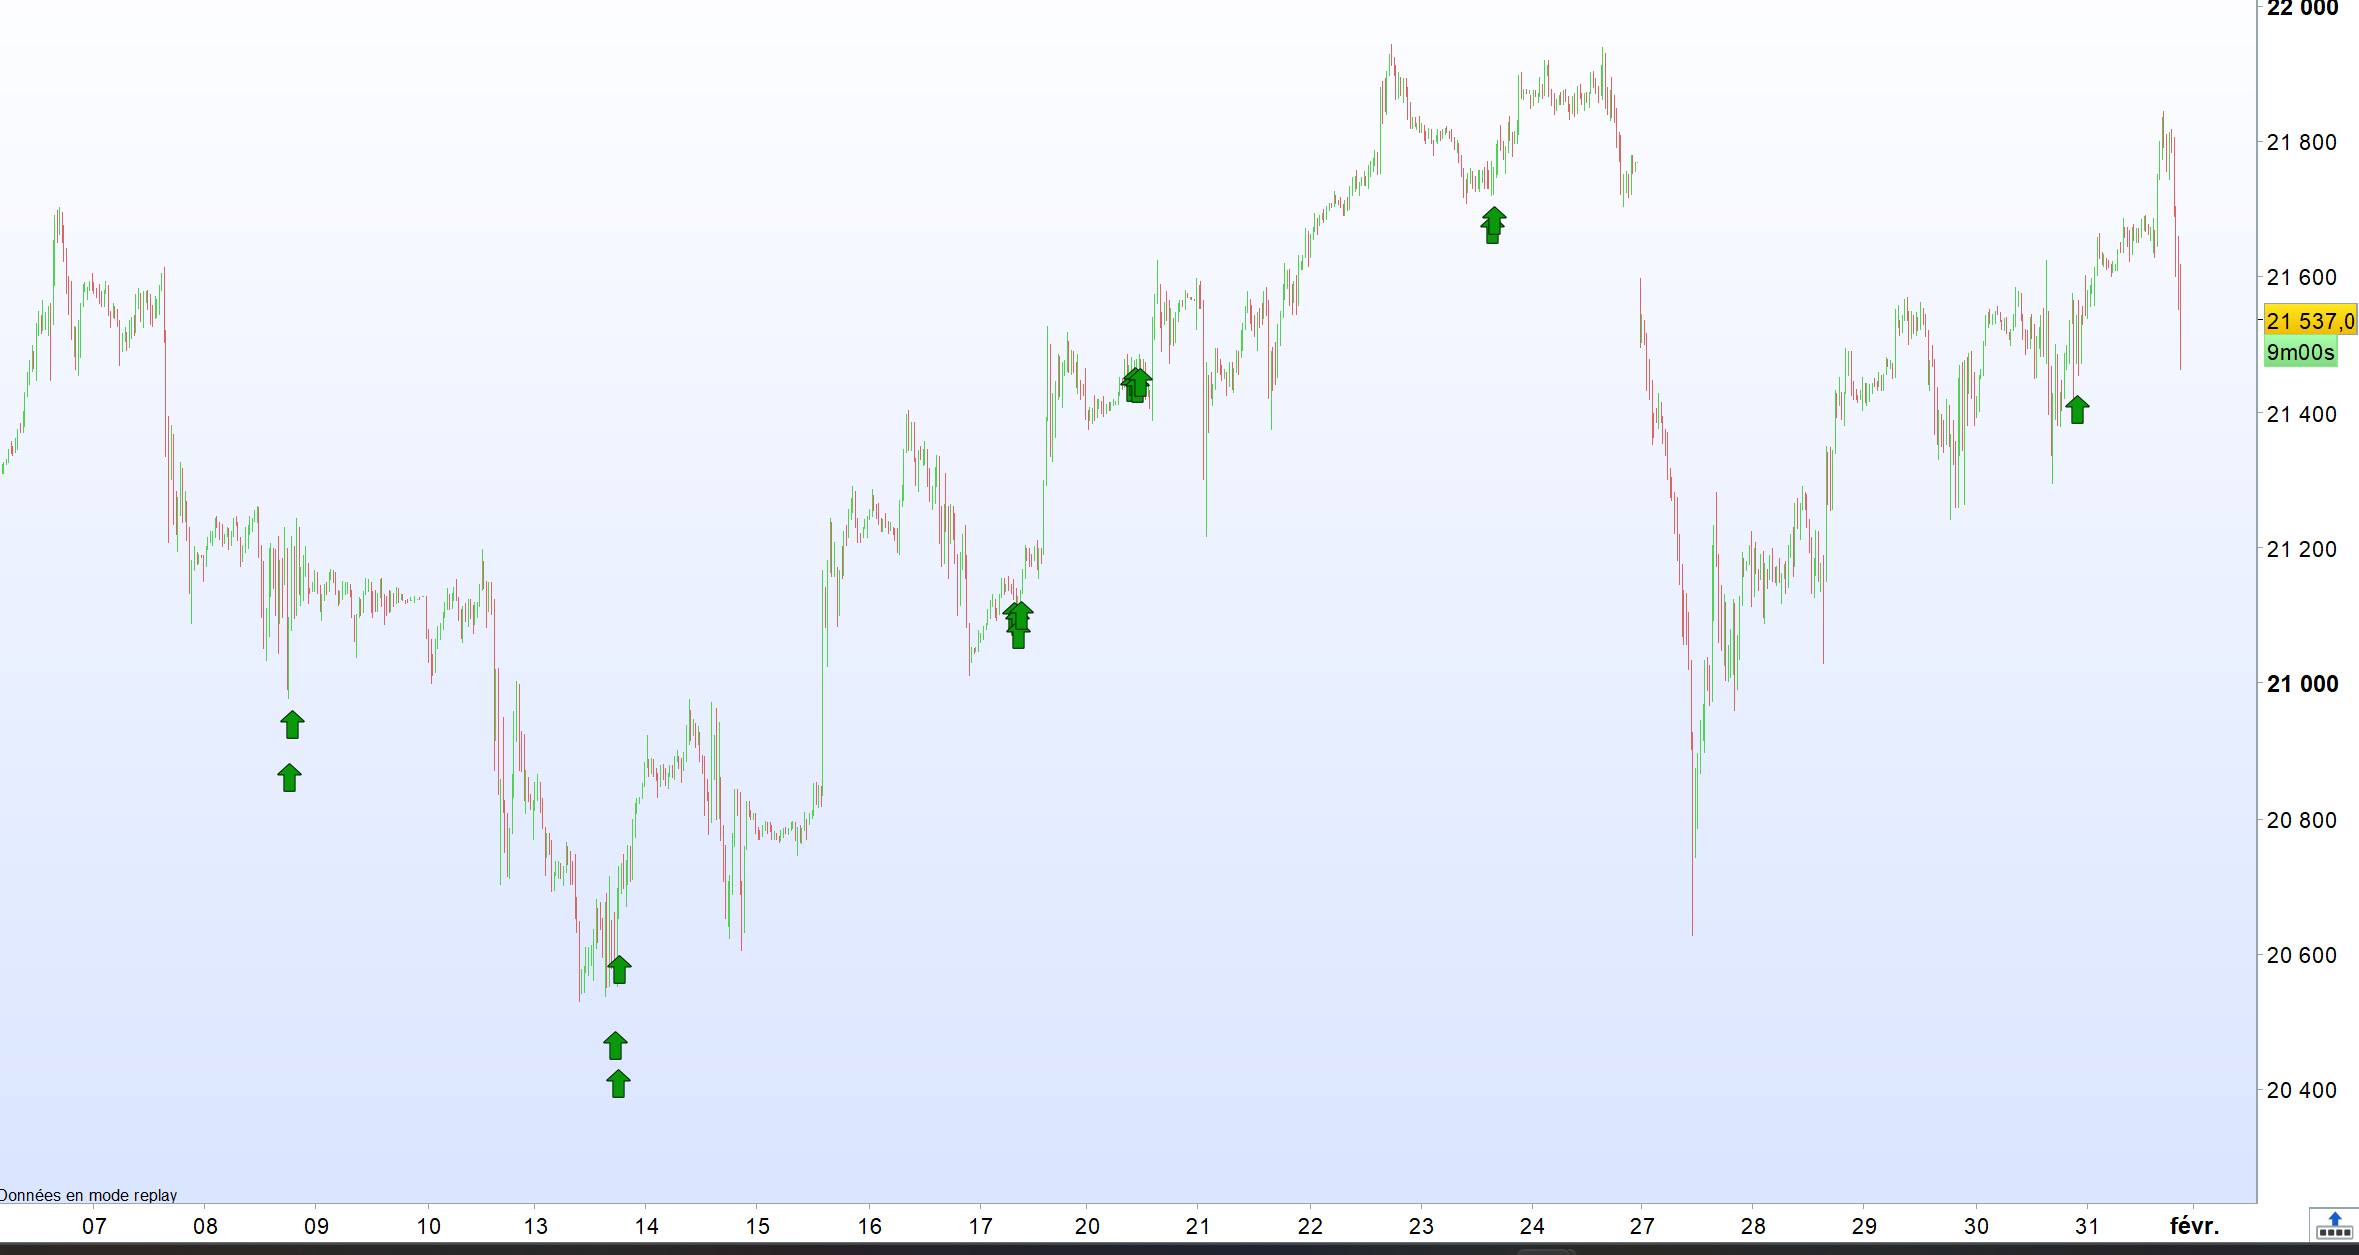
if ConditionY and ConditionX then
drawarrowup(barindex, 2*low-high) coloured(10,153,10)
endif
Return
Bonjour LucasBest,
Merci pour ton retour, ta proposition de code m’a bien aidé.
Pour que cela fonctionne correctement, je dois simplifier les conditions X et Y comme suit:
ConditionY = C1y > C2y and S1y > S2y
ConditionX = S1x > C1x and S2x > C2x
En effet, il peut y avoir plusieurs creux haussiers entre 2 sommets consécutifs haussiers et/ou plusieurs sommets haussiers entre 2 creux consécutifs haussiers.
Lorsque l’on calcule S2, S3 et C2, C3 respectivement en fonction de S1 et C1 on n’intègre pas les cas particulières ci-dessus.
Du coup, le code n’identifie pas la plus part du temps les creux haussiers.
Je ne sais pas comment modifier le code pour les intégrer, d’où ma simplification.
Je trouve intéressant ton code pour tracer les lignes de tendances et l’indication du nombre de sommet ou creux touchés.
Voudrais tu bien me le partager?
Bien à toi.
REM DEF SOMMET et CREUX NIVEAU 1
TDpointHighNiv11= high[2]<high[1] and high[1]>High[0]                                 and high[1]>close[3]
TDpointHighNiv12= high[3]<high[2] and high[2]=high[1] and high[1]>High[0]             and high[2]>close[4]
TDpointHighNiv13= high[4]<high[3] and high[3]=high[2] and high[2]=high[1] and high[1]>High[0] and high[3]>close[5]
TDpointSommet = TDpointHighNiv11 or TDpointHighNiv12 or TDpointHighNiv13
TDpointCreuxNiv11= low[2]>low[1] and low[1]<low[0]                                     and low[1]<close[3]
TDpointCreuxNiv12= low[3]>low[2] and low[2]=low[1] and low[1]<low[0]                   and low[2]<close[4]
TDpointCreuxNiv13= low[4]>low[3] and low[3]=low[2] and low[2]=low[1] and low[1]<low[0] and low[3]<close[5]
TDpointCreux = TDpointCreuxNiv11 or TDpointCreuxNiv12 or TDpointCreuxNiv13

once S1x = 0
once S2x = 0
once S3x = 0

Sommet = TDpointSommet
Creux =  TDpointCreux

If sommet then
S3x = S2x
S3y = S2y
S2x = S1x
S2y = S1y
S1x = barindex[1]
S1y = high[1]
Endif

If creux then
C3x = C2x
C3y = C2y
C2x = C1x
C2y = C1y
C1x = barindex[1]
C1y = low[1]
Endif

REM ordres des sommets et creux du plus récent noté (1) au plus ancien noté (2)
ConditiontheorieDowXup = S1x > C1x and S2x > C2x
ConditiontheorieDowYup = C1y > C2y and S1y > S2y

if ConditiontheorieDowXup and ConditiontheorieDowYup then
drawtext("DOW UP",C1x,C1y-atr,Dialog,Bold,20) coloured(10,153,10)
endif

Return
Question:
J’ai une superposition de résultats au même endroit donc un sur épaississement du texte, etc…
Comment peut-on éviter la superposition de résultat dans le code?
😉
// Once length = 2
once S1x = 0
once S2x = 0
once S3x = 0
once LastPivot = 1

sommet = high[length] = highest[2*length+1](high)
creux = low[length] = lowest[2*length+1](low)

If sommet and LastPivot = -1 then
S3x = S2x
S3y = S2y
S2x = S1x
S2y = S1y
S1x = barindex-length
S1y = high[length]
LastPivot = 1
Endif

If creux and LastPivot = 1 then
C3x = C2x
C3y = C2y
C2x = C1x
C2y = C1y
C1x = barindex-length
C1y = low[length]
LastPivot = -1
Endif

ConditionY = C1y > C2y and C2y < C3y and S1y > S2y and S2y < S3y
ConditionX = S1x > C1x and C1x > S2x and S2x > C2x and C2x > S3x and S3x > C3x

if ConditionY and ConditionX then
drawarrowup(barindex, 2*low-high) coloured(10,153,10)
endif

Return
Je trouve intéressant ton code pour tracer les lignes de tendances et l’indication du nombre de sommet ou creux touchés.
Voudrais tu bien me le partager?
Bien à toi.
Il s’agit d’un de mes 3 indicateurs les plus aboutis ; cela représente des semaines/mois de réflexion et plusieurs heures de code pour arriver à ce résultat… Il est évident que si je devais le poster quelque part, ça ne serait pas ici gratuitement mais sur la marketplace.
Pas de soucis, je comprends.
Merci pour ton aide !
Pas de soucis, je comprends.
Merci pour ton aide !
Avec plaisir.
Je viens de poster un indicateur de supports et résistances (horizontaux et donc beaucoup plus facile à coder). Il faut mixer ce type d’indicateur à celui-ci (dow) pour filtrer les signaux… Mieux vaut peu de signaux, mais une convergence de signes pour ne trader que les setup les plus prometteurs.