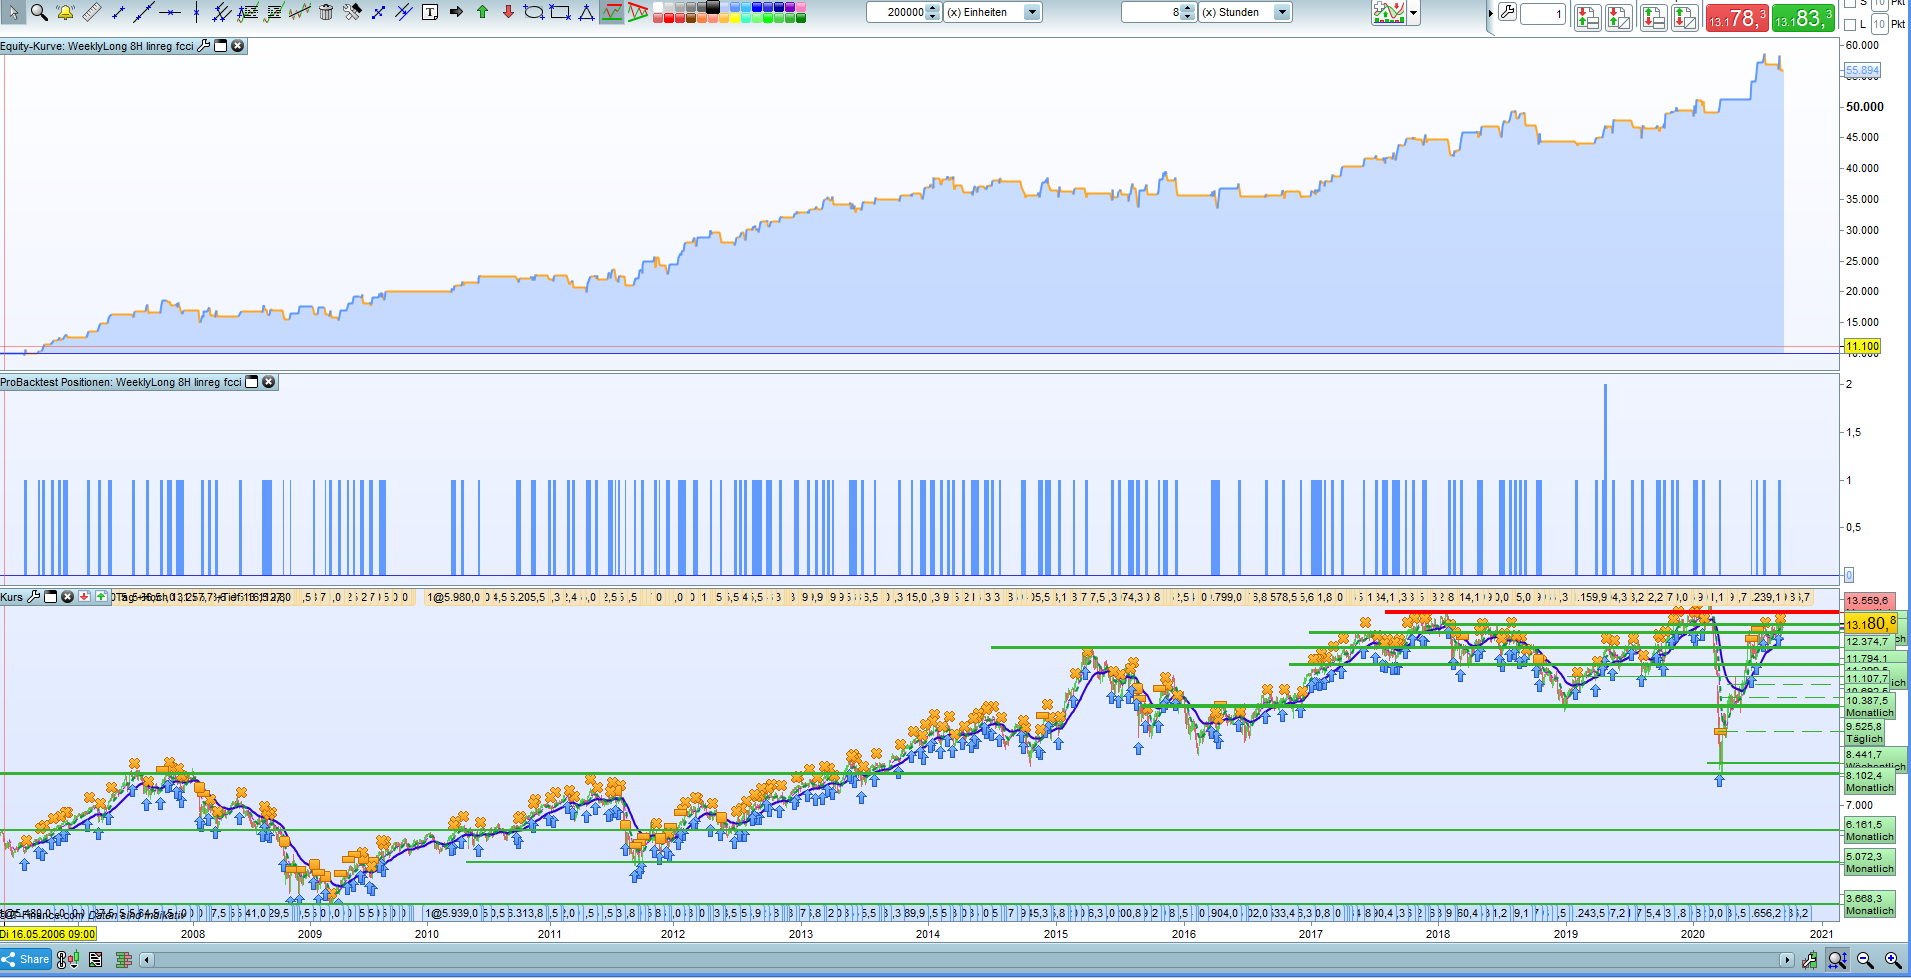
After observing it from the corners of my eyes for the last few years, I went here to measure it.
The seasonality is shown when I buy the Dax on Monday morning and sell it on Friday evening.
In order to have valid data going back as far as possible in a 200k backtest, I used the 8H chart. 200k offers a backtest in the 8H until the 1st trade on July 17, 2006 with an entry in the Dax Monday morning 09.00 a.m. and exit on Friday evening 05.00 p.m.
To measure whether it is a Low, I use a linear regression to form a corridor with its optimised values. For the Low I add a close < close [1] and set a filter with the CCI in standard values. That is all.
In the result I “measured” at which values one would have had to buy the Dax to achieve this brilliant result.
Whether the Dax will behave like this in the future, I dare to doubt, but it is worth a try with a limited budget.
//-------------------------------------------------------
// maincode "the weekly long - buy the low"
// from timebased-series
//
// timezone europe, berlin
// timeframe 8h
//
// created and coded by johnscher
//-------------------------------------------------------

defparam cumulateOrders = true // false no problem

for period = 50 to 60 do //floor
period = max(period, 2)
avg = LinearRegression[period](close)
next

tt = opendayofweek = 1  and time = 090000

c1 = average [1] (close)  < avg // low!
c2 = average [1] (close)  < average [2] (close) // low!
c3 = cci [20] > - 200 // filter, standard value

if tt and c1 and c2 and c3 then
buy at market
endif


if opendayofweek = 5  and time = 170000 then
sell at market
endif

set stop %loss 5 // as insurance - works without too
set target %profit 5 // hooray! - works without too
that´s all- untile then
johnscher
Hi John, thanks for the sharing the idea. I moved your post into the forum, because I think that there might be a problem with your linear regression loop. With this code, you will always use the same period (60) which is the last period of your loop. So your loop is not useful at all. But I might have wrongly understood your description: “I use a linear regression to form a corridor with its optimised values.” ?
Hello.
I go back to the topic Monday morning long in the Dax if …
The linear regression should only serve as a filter to show a certain depth of the Dax, which is a prerequisite that the long works on Monday morning
It makes no sense Monday morning to long the Dax if it is just at a new ATH.
It is better to long the Dax on Monday morning for the rest of the week when it is “down”.
Linear Regression can be used as a filter or the following filters are coded in.
My point here is the idea behind it.
Buy the Dax on Monday morning in the low, not in the high.
If the idea is good, I could prepare it for the library.
until
JohnScher
Translated with http://www.DeepL.com/Translator (free version)
//-------------------------------------------------------------------------
// Weekly Long Monday Morning - a seasonality
// instrument ger40
// from timebased series
// timezone europe time, berlin
// timeframe 4H
// created and coded by johnscher
//-------------------------------------------------------------------------
defparam cumulateorders = true
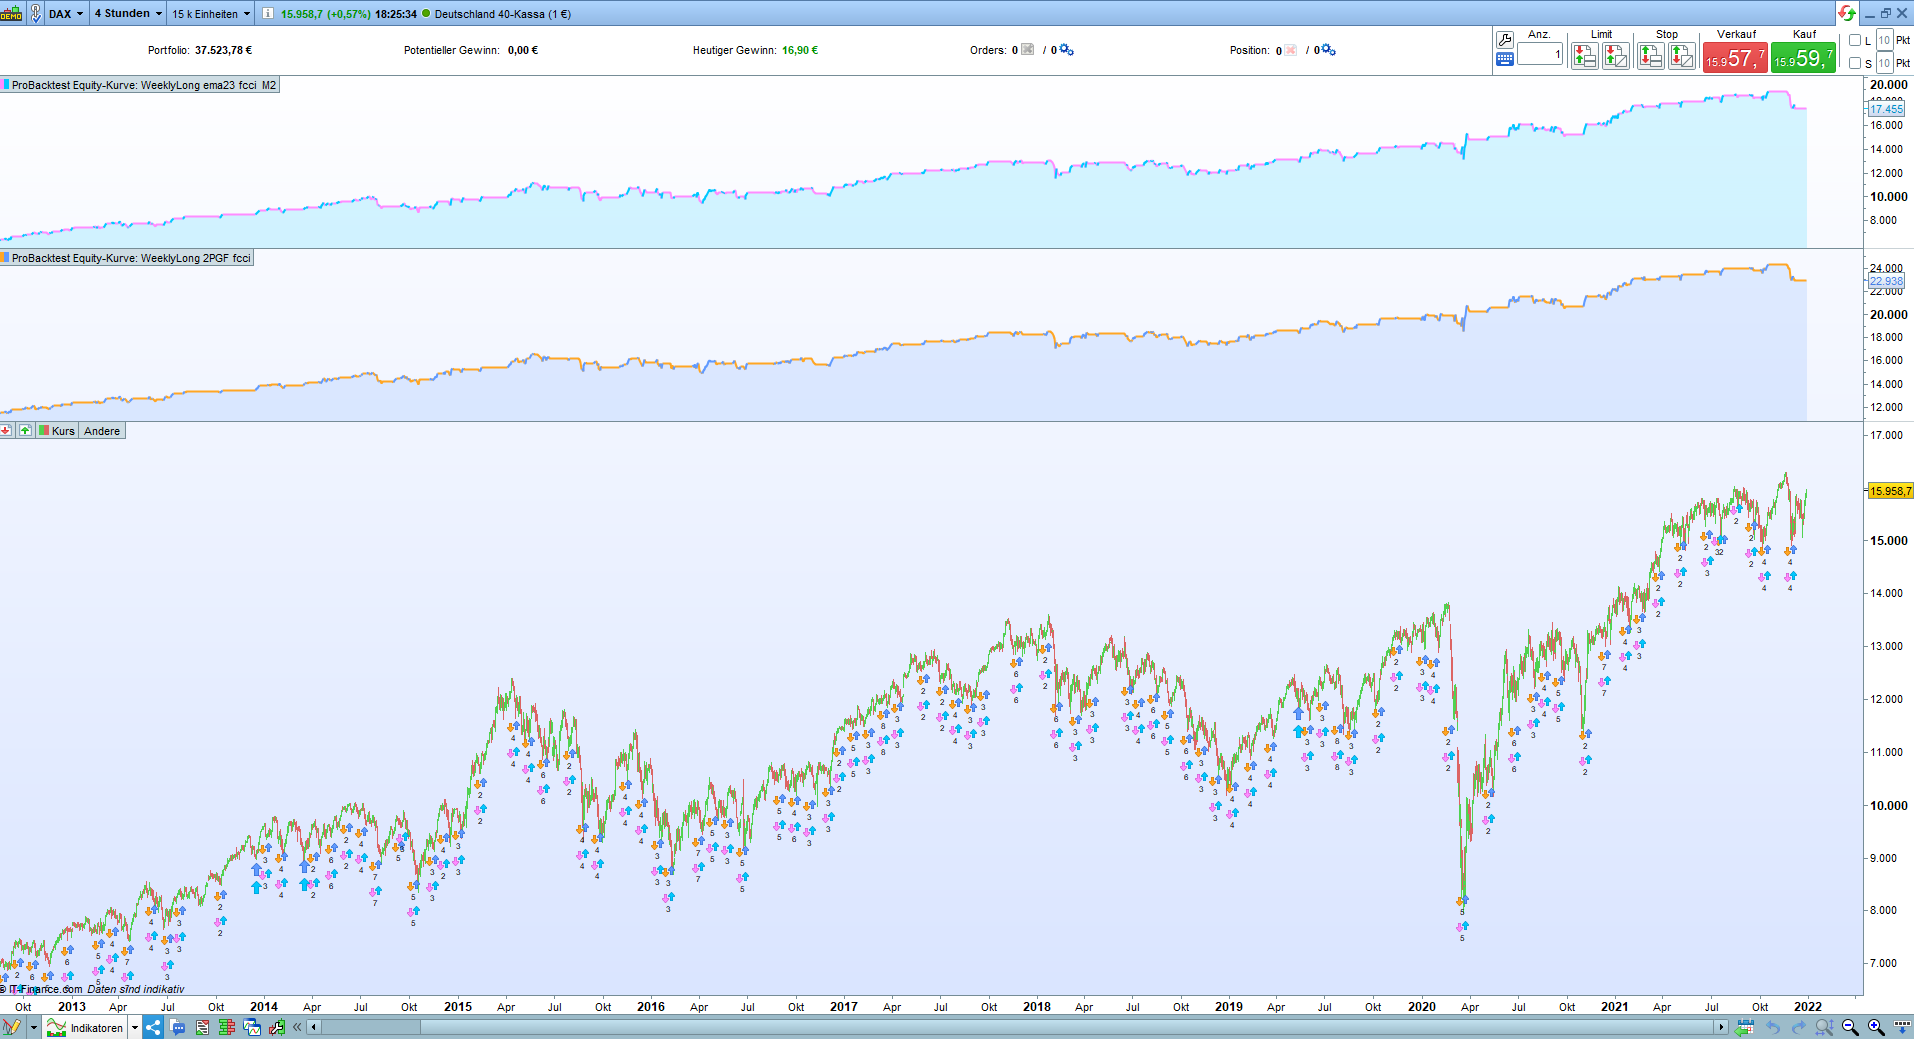
// Exponentialaverage and cci as filter
c1 = cci [20] > -180
c2 = close < exponentialaverage [23] (close)
if opendayofweek = 1 and time = 090000 then
IF c1 and c2 then
buy at market
endif
endif
if onmarket and opendayofweek = 5 and time = 210000 then
sell at market
endif
// end No1
//-------------------------------------------------------------------------
// Weekly Long Monday Morning - a seasonality
// instrument ger40

// from timebased series
// timezone europe time, berlin
// timeframe 4H

// created and coded by johnscher
//-------------------------------------------------------------------------

defparam cumulateorders = true

// Two Pool Gaussian and cci as filter
period = 70
period = MAX(Period, 2)
series = close

IF BarIndex = 0 THEN
w = 2 * 3.141592654 / Period
w = 180 * w / 3.141592654
b = (1 - COS(w)) / (1.41421 - 1)
aa = -b + SQRT(b * b + 2 * b)
a1 = 1 - aa
a12 = a1 * a1
a2 = aa * aa
y1 = Series
y2 = y1
ENDIF

y = a2 * Series + 2 * a1 * y1 - a12 * y2
y2 = y1
y1 = y

cfil = y


c1 = close < cfil
c2 = cci [23] > -180

if opendayofweek = 1 and time = 090000 and c1 and c2 then
buy at market
endif

if onmarket and opendayofweek = 5 and time = 210000 then
sell at market
endif
// end no2


screenshot also at
https://prnt.sc/24zaht2