The same Code doing different things

Forums ProRealTime English forum ProOrder support The same Code doing different things

Viewing 15 posts - 1 through 15 (of 18 total)
  • #157759

    All,

    This is for later reference and how things can be different with Backtesting vs Live trading.
    Mind you please, “Live Trading” as such, for me is the same as Paper Trading. Backtesting is just that. OK ?

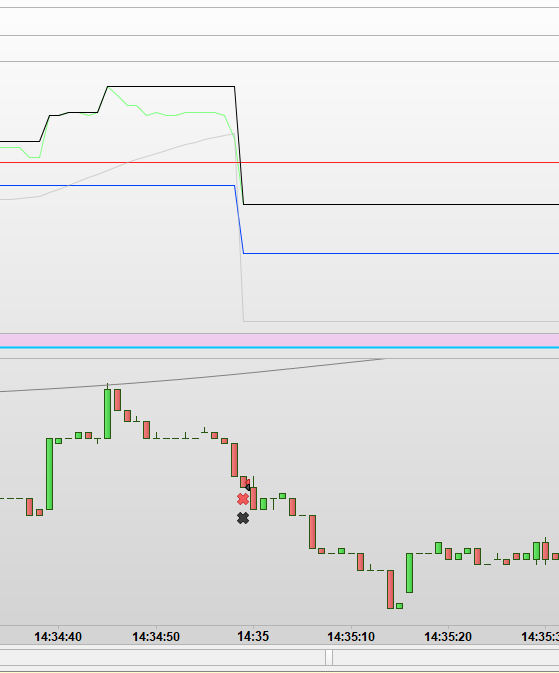
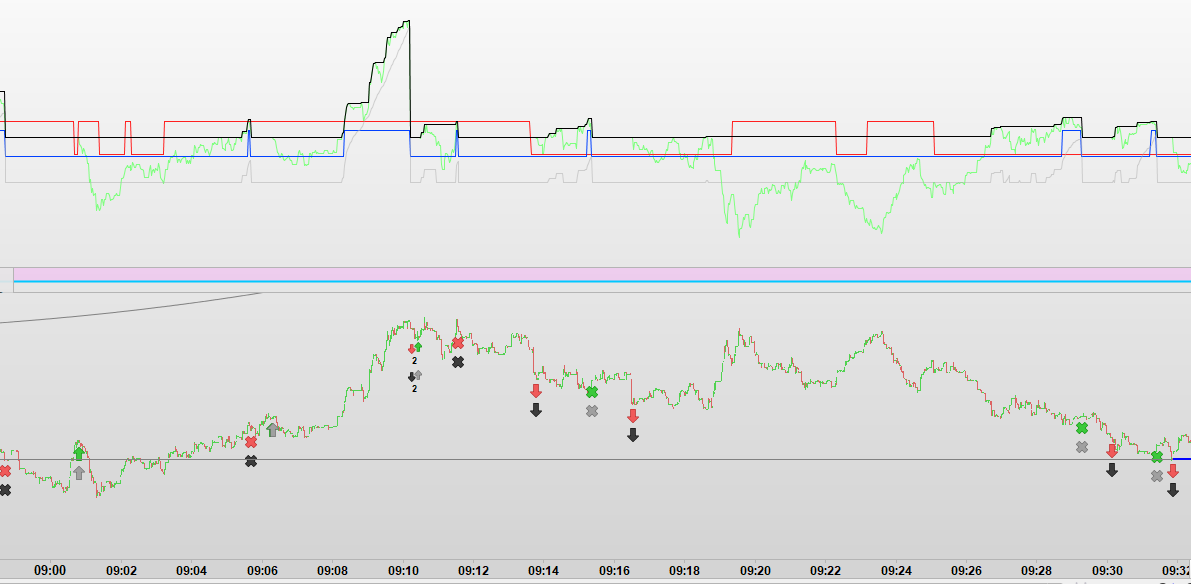
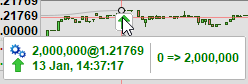
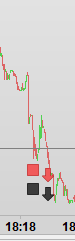
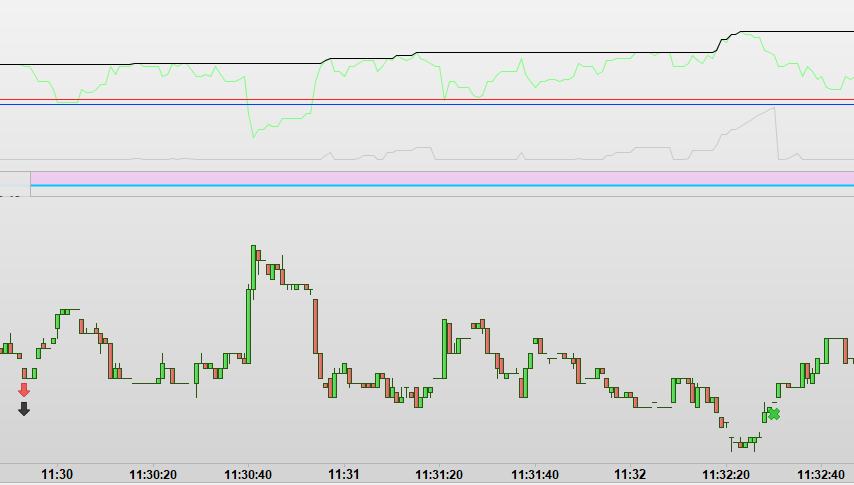
    See the first attachment. You see two trades occurring at the exact same time (to the second, in this 1 second chart). The red cross is from “Live” (though Papar !!) and the black cross is from the in parallel running Backtest. Notice that a Backtest can just run live when you let it end at the “Real time” date/time.
    This running in parallel can happen forever, and it can be the same forever. Actually it should. The two codes are the same (they are copies, with the Live version having the Graph commands excluded).


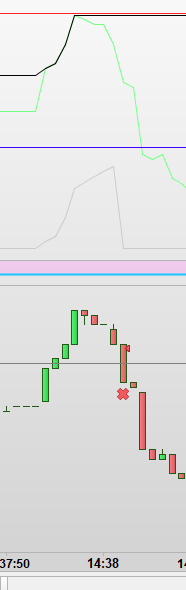
    Explanation of the graphing

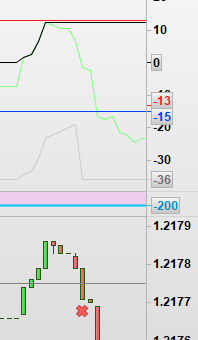
    Not really much to say, except for the importance of the Grey line. This is a Traling line. As soon as it touches the Green line, the position will exit.


    And here it goes wrong

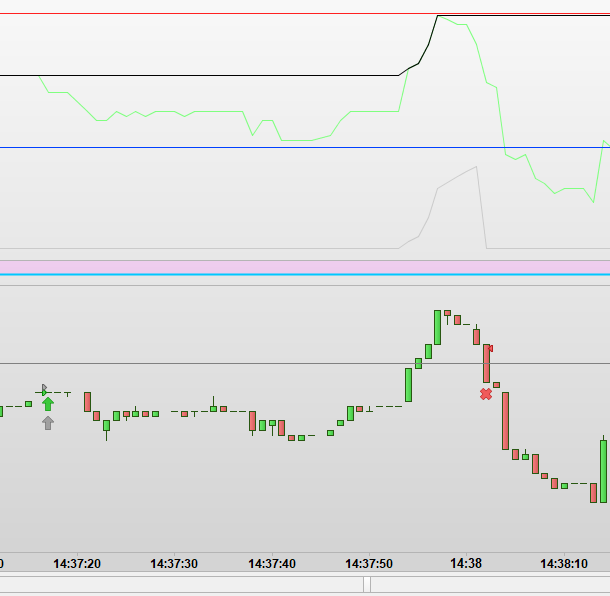
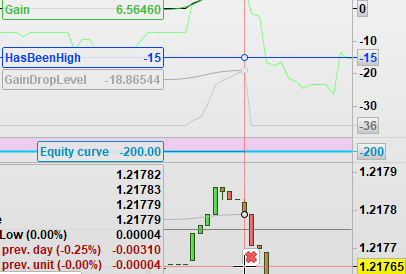
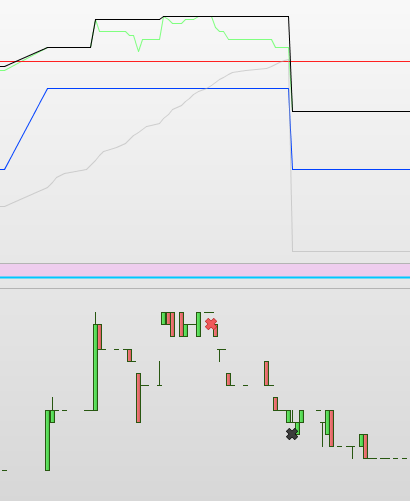
    See second attachment.

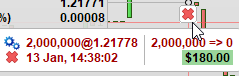
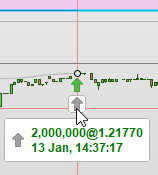
    At 14:37:17 there’s a new Entry for both Live and Backtest, but … at 14:38:02 there’s an unjustified Exit for the Live.
    Huh ?
    Yeah, huh. The Grey trailing line vs the Green line to touch clearly shows that no touching is in order. This makes the lot consistent for the Backtest version, because that version is graphing the lines. And the Backtest version still continues the Trade.
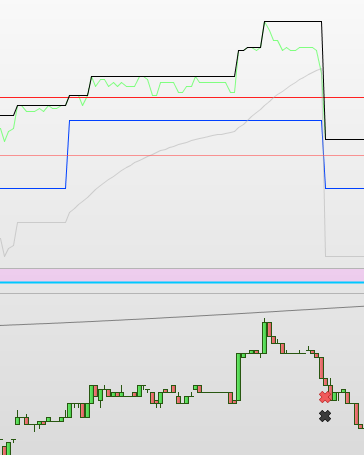
    Result ?

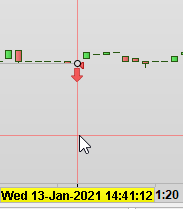
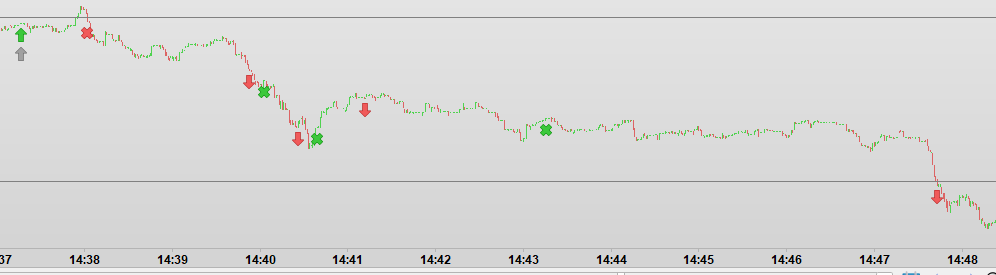
    The result is devastating because at 14:39:53 te Live enters with a Short, and from there on it has its own life … all NOT intended. Remember, the Backtest version is the boss, because that shows the Graphs and it shows it correctly. Or better to say : it acts to its own graphing.

    Conclusion ?

    Well, I have said numerous times (including to PRT support) that I can run Backtests with something like 100% gain, but a first trade in Live may fail right away. And subsequently so much so, that I’ll quickly bail out of the System. And do notice that this time I am talking about real-Live (at PRT-IG)  and not Paper (with the Backtesting performed on PRT-IG as well – just saying ;-)).

    Anyway, yesterday this started to happen and with several “synchronisation” points (orders Enter again in parallel) it kept on going wrong on and on and on. Today (Jan 14) all is fine so far.

    What’s next ?

    Good question. People may claim differences between Backtest and Live anyway, but this is on the very same “provider” (it is the same instrument provided by the very same PRT running code, though in two instances). The graphing shows to me that the real thing is in error.
    “Then send in your code, Peter !”. No, Peter is not going to send in his code, sorry. I suppose Peter has to learn to live with the differences and beat the system anyway, BUT that he will not be able to prove whether the system did something odd (graphing not possible by means of the Live code). And mind you, that un-planned Exit was not even a loss. But it changed the whole further sequence, which I deem out of control (it did not do what my code intended).
    Btw … this was with V10.3 already.

    The Backtesting is reproduceable (I just did it again today, while yesterday it was happening live for my eyes). The Papertrading (as would the real thing) is of course not reproduced as it just happened. So in theory PRT development should be able to see “error”, as the error is in the fixed data.

    Last thing : I did not plan to write this out for you, until I saw the other topic which mentioned issues possibly related to variables (parameters) in order, no matter they are fixed. Although that situation being different (I will put links in a second post), it got me thinking that it could be the same problem. I could obviously test this same Code with no variables and have them in the code instead. More later ?

    Peter

    #157767

    Here are a couple of links with related (?) issues :

    https://www.prorealcode.com/topic/backtest-results-changes-with-same-values/page/2/#post-157755
    https://www.prorealcode.com/topic/backtest-using-variables-giving-very-strange-results/#post-157738

    As a bonus, in the attachment you can see that today all is still fine.


    PS:

    the Grey line. This is a Traling line.

    Trailing.

    #157769

    Qu 1

    Image 1 and Image 2 are not showing the same time period … is that intentional??

    Qu 2

    Might spread and slippage differences account for different performance between Real Live and Backtest Live?

    #157771

    I could obviously test this same Code with no variables and have them in the code instead. More later ?

    All right. That does not make a difference. All is exactly the same with – and without variables.

    #157776
    1. tradeprice (open price of the order) = same one in both live and paper trading?
    2. your trailing line is using what price? Close?
    3. if the spread is different between backtest and live, then the order will close at slightly different level (Ask and Bid prices differ)
    #157780

    Qu 1 Image 1 and Image 2 are not showing the same time period … is that intentional??

    Thank you GraHal.
    But what do you mean ? The 2nd image is a few minutes later of course. But you won’t refer to that. Or ?


    Qu 2

    Might spread and slippage differences account for different performance between Real Live and Backtest Live?


    I can’t see how. This is not about profit being less or more. It is about orders Exited at different price levels, while my code does 100% all self. So it is not depended on Spread or anything (although it incorporates it all right).
    It thus it depends on the price. But if the price is different, the graph (the bars !) is different from the price in order. But notice that the difference is quite “huge” in my book.

    This tells me that the profit to make is 20x 18.86544 = USD 377.31 under par (that GaindropLevel graph is the Traling line again – the 20x is because all is scaled).
    FYI (you guys may see something I don’t), the Gain taken is 20x 6.56460 (Green) = USD 131.29 but which includes Broker Fee and Spread. Gross it is USD 180 (see 2nd attachment). This is not my set minimum Gain (this is harder to explain but obvious for me – thus, in the first post I said that the trade made profit anyway, but not as much as was intended, but more importantly, the whole sequence changes because of it).

    #157785

    tradeprice (open price of the order) = same one in both live and paper trading?

    Good one !
    See the attchments.

    Ehh …

    So it is NOT the same. And I already know why … (see next post because of lack of attachment space) …

    #157790

    OK, never mind attachments. The difference can be 1 pipette (1/10th of a pip).  I looked at a dozen Entries and Exits. Half of them differ one pipette. This can be so for Entries and Exists. But that can’t explain the relatively huge difference.

    #157792

    your trailing line is using what price? Close?

    Yes. Close.


    1. if the spread is different between backtest and live, then the order will close at slightly different level (Ask and Bid prices differ)

    I understand that. But I don’t see how it can happen regarding what I see from my graphs. This is not “slightly” PLUS , well, both are Paper. This is hard to wrap my head around. Also please notice Nicolas, this is not IG with relatively large spreads. This is IB (where we pay my means of commission (Broker Fee). Also, I have been extensively observing the prices from Paper with Real-Live at the tick level. I see no difference. But I can’t see what happens internally at the PRT server, of course. My point here would be : we should be able to trust the candles. Also, tick by tick is not engaged (doesn’t make a difference anyway).

    Please keep on asking because I want to cover for this myself (and if it’s a bug it is a bug).

    I don’t suppose you’re suggesting that I better work with the Open prices ?

    #157794

    This is IB (where we pay my means

    by means. Sorry.

    #157798

    Look again at the attachment please.

    I can imagine this is hard to follow, but look at the distance of the bars from where the Grey Trailing line starts to climb and what the Green (Gain) does just the same. They all have the same distance in height. This means they work relative to each other but what you see is absolute. I mean :

    The height of the bars is (coincidentally here)  equal to the height the trailing line still needs to cover before an Exit will occur. Thus, the program at the PRT server did wrong regarding that same height ? and this while it can work whole days in a row without error ? That would be a sudden super spread. 🙂 Look at the price (edit : in the 3rd attachment now).
    For me also counts that this does not happen within a (1 second) bar, but that the climb ranges over 4 bars = 4 seconds. All hard to explain … or hopefully not ?

    Also, if the real system would sell too late, it would give me an entire different feeling. But it sells too soon …
    And again, the Backtest just does what it should do, the graphs tell me that. Next (I) take into account that the gain isn’t even right and I start to be confident that something is not working right. Here too, how to explain it. But might you want to look in the very first attachment in the first post again, you there a blue line which implies whether we’re in the stage of allowing Exits. It is minus (15) and thus my code isn’t thinking about selling at all. But the PRT server does … haha – ignorant beast.

    See second attachment for how it should work. I can’t even count how often it is fine (hundreds of Trades a day). Currently, at 12:00 all is still fine.

    #157803

    I can’t see how.

    If spread is different then bid ask prices will be different.

    #157808

    The trailing level is calculated at bar Close and updated at next Open.

    Look at when the STOP orders are updated in your orders list, slippage/lag will certainly happen on a 1-sec timeframe, while they are updated instantly in backtest!

    #157842

    The trailing level is calculated at bar Close and updated at next Open. Look at when the STOP orders are updated in your orders list, slippage/lag will certainly happen on a 1-sec timeframe, while they are updated instantly in backtest!

    Nicolas, thank you very much. But I don’t use any Trailing or Stops or whatever. I do everything myself. I only have emergency Stops but these are not in order. Regarding this :

    I feel that you did not get it yet that this Gray Trailing line is working for real. It is not a simulation. It represents 100% how the code works. The only thing which could (actually should) be out of my control, is :

    1. if I say that I buy something at a price, it is bought at a different price (Spread). This is irrelevant because I (obviously) will detect at which price I bought which still is irrelevant because I know what the Gain is at each moment (at each second). What *is* relevant, however, is that I really bought at a price I am not aware of in the program; this is how I deem your 1st question (in your first post) to be crucial because indeed there I could “miss” something and the Live program will have a different life because of it. But as we have seen this is only one pipette difference.
    2. If I sell (Exit) something which is to happen at a certain price, it is sold at a different price (spread). But here too, this is not in order because it is not about a more or less profit at the Exit … the exit happens too soon and way too soon at it.

    RaHal, to you too – thank you;
    It can well be so that we all too easily think “oh that will be the spread”. But this is EUR/USD in the middle of the day. Please think with me :

    Would it really ever be so that a spread on this instrument “hangs” for 4 seconds (see my earlier post about this) because that would be the suggestion ? Regarding this, keep in mind that the both programs do exactly 100% the same and they look at “about” the same data. If you people think this could be spread, would you please be so kind to explain that to me with the help of my own given screenshots ? Must I make more of them for you ? I will be glad to do that !
    Also, might you have a good idea of graphing something for (counter)proof, … easy to do. Just ask.

    It is now 3pm and 34 trades further. There’s not a single miss. Wouldn’t we think that if this is spread or slippage related, that at least I would see trades at 1 bar (1 second) off in relation to each other ? They are all at exactly equal prices, or at one pipette off. But not so yesterday.

    FYI, in the 1st attachment how an emergency stop looks like (SET STOP $ LOSS) and indeed from experience I know that *those* can differ quite a lot (in this case it is 7 pipettes which is still “nothing”).

    Might it help for better insight, in the 2nd attachment an other example from yesterday. Here too, the Exit makes no sense to me.
    Important : It is most certainly not so (ever) that an Exit is executed randomly somewhere (like with a high loss). I feel it must be related to math working out differently in Paper vs “Live”. And regarding this, notice that I don’t use Indicators whatsoever. Only small stuff like Average and a few more. … And what I do NOT know, is whether such a same “math mistake” (?) can happen in both systems at the same time. The (my) problem is, the system will also Exit when things tend to go the wrong direction, if only there has been sufficient Gain already. Although I could see that (the blue graph) it is tedious to go through everything. So you can well say that I find these bugs (??) because I can compare two instances. With one only ? forget it.

    Meanwhile I found an other one – an interesting one, see the 3rd attachment. I myself should be able to make something of that. Let’s remember that the red cross is the “Live” – Black is Paper. The Live exits at maximum gain, as if there were no Trailing stop in order (yea, if I could really make that eh ? ;-)). But it tells me that the curve the Trail is following is steeper than we wee it here. As if *or* that calculation is done wrongly *or* an old curve is active (I have had them steeper). Regarding this, I looked in the uploaded program (not my version – PRT’s version) and the values for the curve are exactly the same as the Backtest version (should be, because I copy the lot right before uploading).

    It has to do with that curve … This is not only the math of the curve, but also how it resets …
    (sorry for talking to myself a little)

    #157851

    Peter, please in simple words, 2 small sentences, what is the grey line, what is the black line and what about that green line too? Step by step please. Are they graph by the strategy backtest?

Viewing 15 posts - 1 through 15 (of 18 total)

Create your free account now and post your request to benefit from the help of the community
Register or Login