For many this is old news and obvious, but for everyone else, i wanted to show a picture that pretty much sums up “the holy grail” of systematic trading.
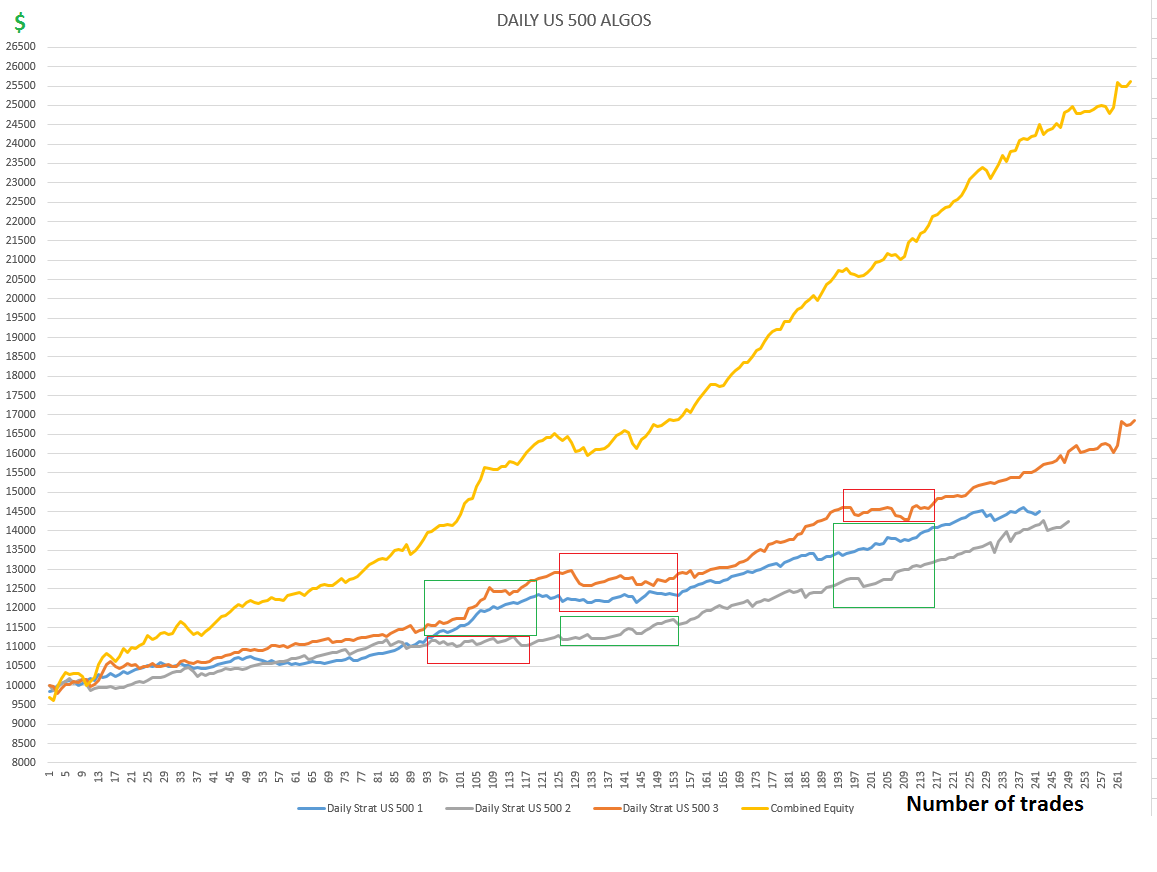
Ive combined 3 daily strategies that i run live in US 500, the 3 strats have done 240-265 trades each in backtest shown from year 2000 -> 2019.
Please notice 2 things: The correlation + the combined EQ.
Ive highlighted a few areas of interest where 1 or 2 are going slow/down, while 1 or 2 is picking up the slacks, letting the combined EQ never really drop by alot.
For me there is little doubt: This is the “secret”, this is “the holy grail”.
This is of course BACKTEST from year 2000 -> year 2019 (today) I have been running them live for the last 10-20 trades on each system.
Edit: More systems (of course depending on the systems) will give a smoother “Combined Equity” graph, and obviously will push it higher.
Please attach a report for live trades 2019-2028. I’m in no hurry.
Ive combined 3 daily strategies
So the yellow equity curve is the same as running the 3 strategies separately (but only the combined curve could then be viewed on the Detailed Report) ?
Sorry @GraHal: to clear things up: Yes 🙂 I run the systems seperatly as independent systems. They do different things in the same market. The yellow is just the cummulative profit/loss of the 3 systems!
@robertogozzi Lol 😀 thats indeed the hard part of this!! Creating systems that will keep performing year after year, with or without much being done to them each year or whatever.
Dont get me wrong guys, this game is in no way or shape a simple game! And in this post i only wanted to show that creating multiple OK looking strategies can give you a fantastic Combined equity curve! You dont have to create 1 100% insane system that takes 10000 lines of code and 4 years of dev!
Multiple easy and good/robust strategies can bring your equity to new all time highs 🙂
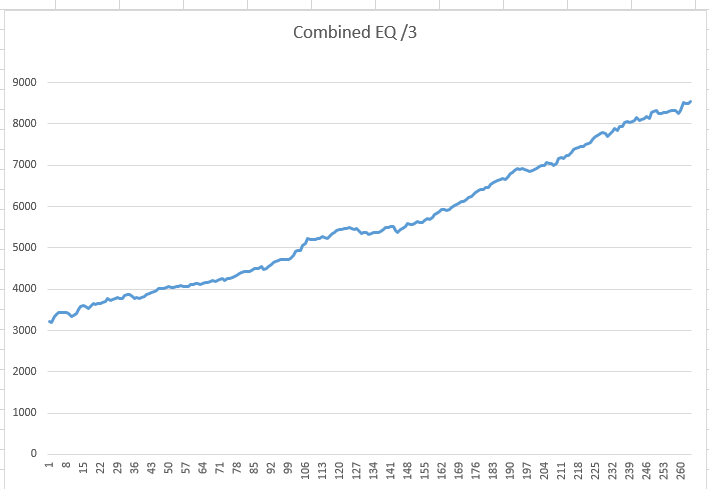
It would be interesting to see the combined equity curve divided by three or the individual equity curves multiplied by three so that we can compare the curves on a level playing field.
Hey Vonasi, im not sure what you get out of it?
i can do it no problem, just not sure what you hope to see from it? 🙂
Attached a photo where i have taken the combined EQ /3 on each point.
So .. you were not aware that the SP500 has been continuously higher for decades? 😆
Joke apart, as long as the strategies are not highly correlated, you made a good job.
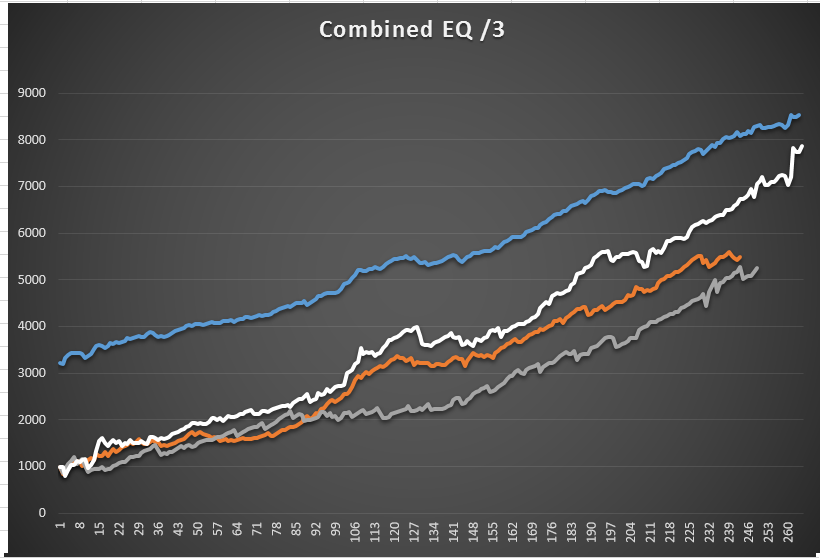
I mean all four lines on the same chart but with levelling stakes. So as if you had staked 3 per trade on just one strategy or divided your stakes as 1 per trade on three strategies. This way we can directly compare the smoothness of the combined equity curve with each individual equity curve. As it is currently shown it is difficult to see the true benefits of multiple strategies over just one strategy except the fact that if you bet three times as much you make three times as much profit!
just not sure what you hope to see from it
It be good to see the 3 separate curves as well as the combined / 3 curve.
I wish all the Systems I run (200) resulted in a rising combined equity curve!!! 🙂
Well actually they did for several weeks / months up to Christmas, but have been net losers overall in the last 2 months or so! (:
So more like this i guess?
Wanna add that in the backtest sample (2000 -> 2019) the market has been down over 50-60% 2 times over a period of years. My whole point is that combining multiple strategies reduces the drawdown on ur total equity.
So more like this i guess?
Yes and no! Your starting capital is not equal.
haha god damnet, so u want the single strats to have a starting capital of 10.000, and u want the combined one to have a starting capital of 10.000/3? (Starting then at 3.333?)
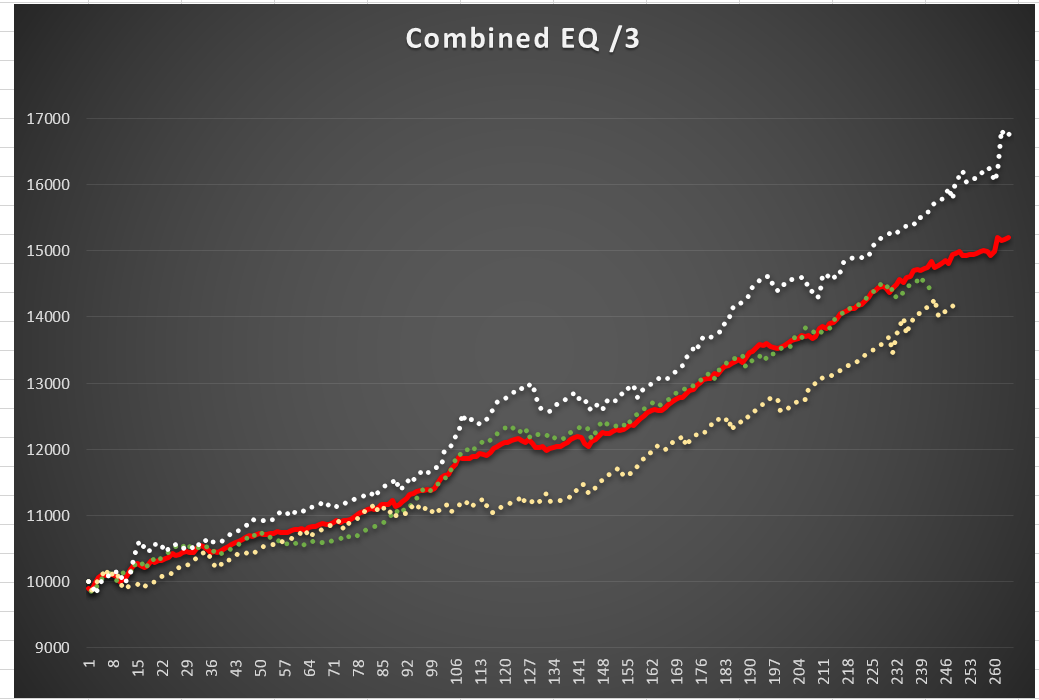
Oh i might have understood what u mean now haha. Like this?
So i made the starting capital on the combined curved = 30.000 / 3
dots = single strategies, red line = combined
Yes like that. We can now directly compare performance. The top equity curve is the most profitable strategy but has had a couple of rough patches. The other two have had single long periods of sideways profitability which may have made a trader give up on any of them but combining all three has resulted in only a short period of losing and going sideways meaning that a trader is more likely to persevere with the strategies.
My only concern would be the correlation as all three are on the SP500. If the SP500 takes a dive then you may find you have a nice smooth equity curve but in the wrong direction! It would be far better to have multiple strategies on multiple uncorrelated instruments or at least strategies with different trading styles on the same instrument. So long or short, mean reversal and trending using all combinations of these four preferably.
On a similar theme I have considered running one strategy multiple times on one instrument with say ten different sets of variable values. When I find a strategy that has a broadband of values that work picking one value and running with it into the future just because it worked best in the past can seem a bit of a gamble but running with ten values and taking an average equity curve from them seems like a more sensible idea. The down side of course is that you need a lot of starting capital – especially if you want to run on several different instruments with the idea.
Hey again Vonasi!
These are 3/14 im currently running live, so rest assured i have multiple strategies on multiple markets! (that being said, majority is LONG ONLY on different stock indicies! But also on multiple different timeframes, which helps alot with the correlation.)
The S&P has been down 50-60% 2 times during this backtest sample on all 3 strategies (2000 + 2008 crisis’) so im not that worried about taking a huge nosedive down. of course they might all be curvefit and in 1 year they will all break and die. But thats not the point of this post anyway. Lets assume that the strategies keeps performing, i would say its alot better to run the combined 3, rather that going 3* into 1 of these.
Regarding the thought of running multiple versions of the same strategy, i understand completly what ur talking about and i have been thinking about the same thing myself. I have only heard of 1 trader who does this (belive it was via the bettersystemstrader podcast. I personally would think it would be way to correlated to run say 5 versions using different variables but the “same core system”. That being said, it might also be a great idea, it depends alot on the type of systems of course, and what they try to do.
And finally i wanna say yes! to the fact that long periods of sideways choppy markets and equity thats not really rising might make u wanna shut off the systems and by running these systems at the same time you can be much more calm ( at least in my mind) while the sideways action is going on because you at least have 1 or more systems that (hopefully) is still banking in profits.
In october almost all of my systems went into drawdown because of the global drop in share prices.. and that was really hard to watch. i of course wish i had more different systems on different markets (commodities and fx) but atm i dont… working on it tho 🙂
Probably gonna make a photo with all my systems comparing them to eachother later