JS
JSParticipant
Veteran
Yes, I use a “moving average”, but I don’t see it as an “indicator”. To me, it’s just a simple calculation where you add and divide values, like in basic arithmetic…
(I don’t see why you would immediately label a basic averaging calculation as an indicator)
(I don’t see why you would immediately label a basic averaging calculation as an indicator)
I have not labelled it as an indicator… even if it can be labelled as an indicator, or even as a non recursive filter.
I am not against indicators at all. And i think RSI is the best one and it is not so dependent on time period. 🙂
JSParticipant
Veteran
It was more of a general comment (not meant personally)…
Of course, if you believe in indicators, you should definitely continue using them…
Hi JS
Is your System(s) always onmarket?
If Yes, is this due to Close > x or Close < x ? 🙂
Also does ‘GRAPH x’ show weird values on chart axis (even though resulting in profits)?
JSParticipant
Veteran
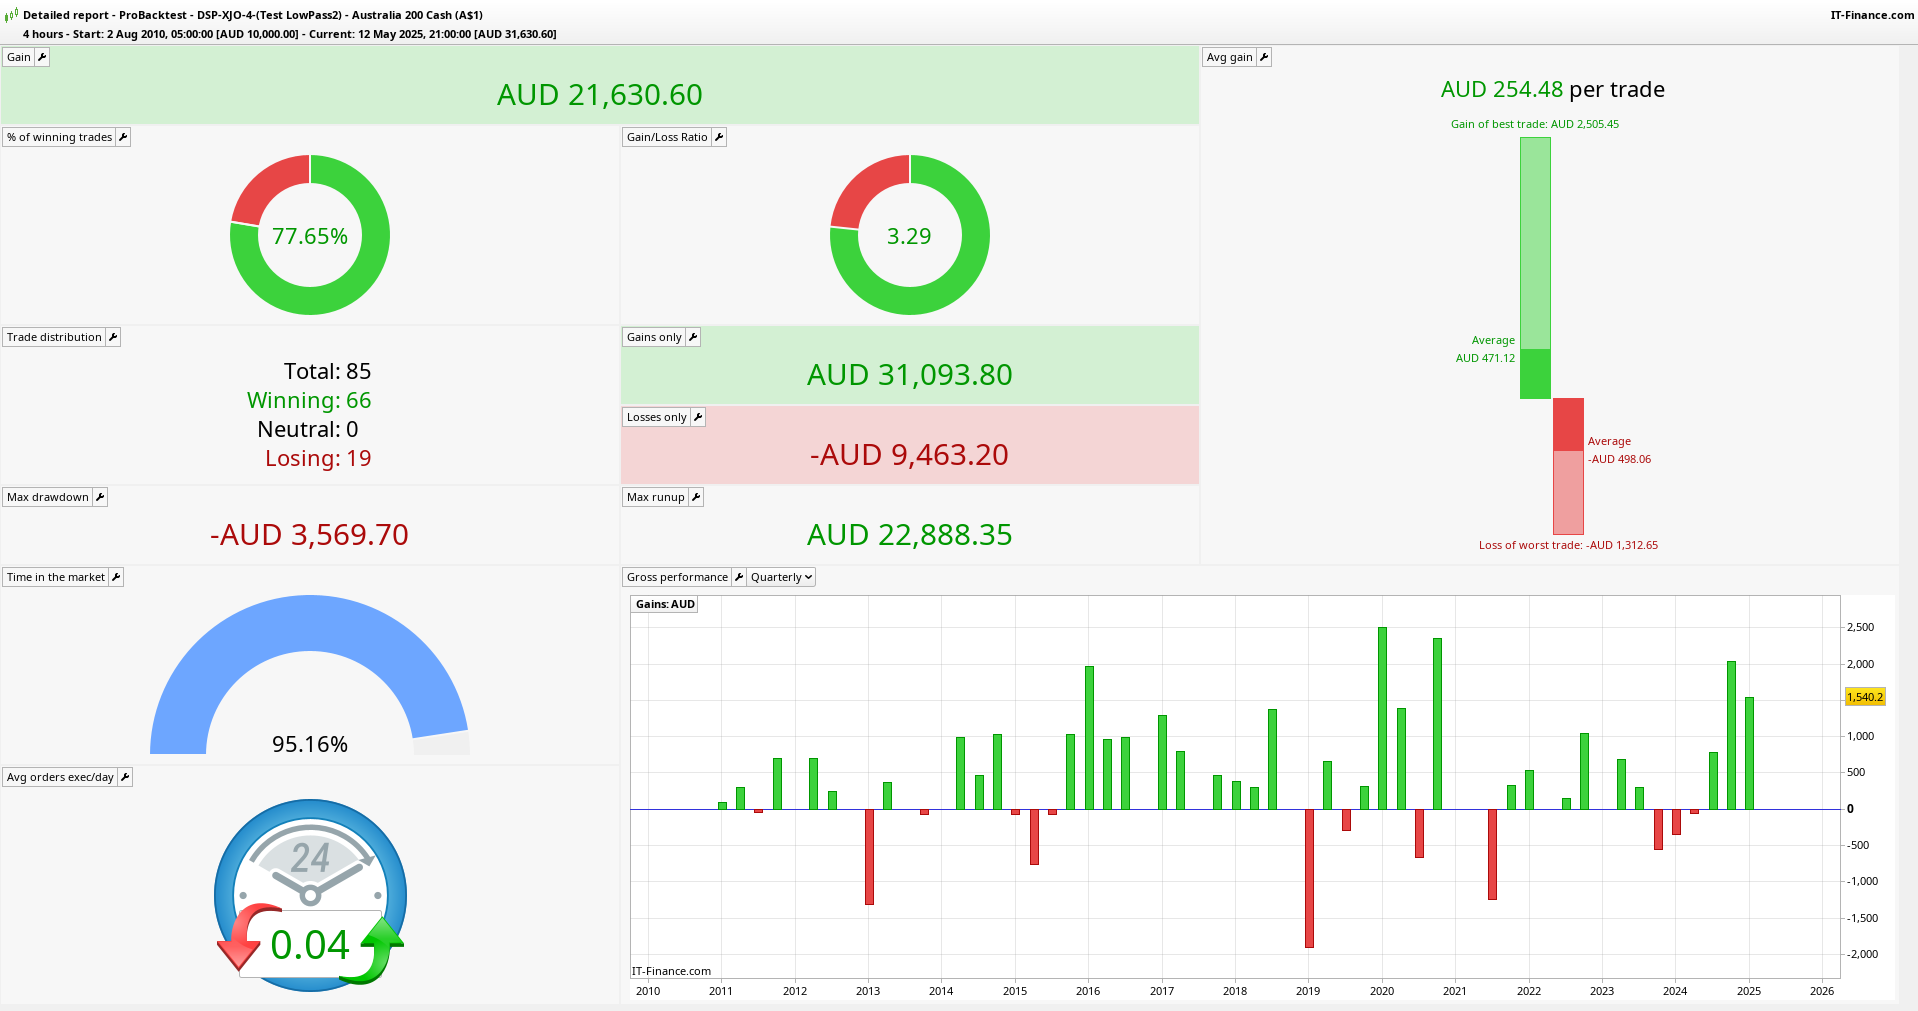
Have you seen the backtest results?
That’s right — my system is “always on market” about 99% of the time. When it’s briefly out of the market, it’s because it was stopped out by the emergency stop…
I’ve run a lot of tests, and the system turned out to be surprisingly stable with no unexpected outcomes…
Of course, the win rate is only 60%, so I take into account that on average, 4 out of 10 trades will result in a loss.
The image shows the system running live since April 21…
JSParticipant
Veteran
The settings visible in the image:
Starting capital = 2000
Maximum position size = 10
Minimum position size = 0.2
Margin percentage = 0.05
1.7 = threshold setting
1.6 = threshold setting
Lookback period = 100
…
JSParticipant
Veteran
The minimum I need to know to build a DSP system:
- General DSP notation – Essential for understanding formulas and interpreting technical literature.
- x[n], y[n], domains – Fundamental concepts for system modeling (e.g., time, frequency, or spatial domains).
- Convolution – A key operation in linear time-invariant (LTI) systems for calculating system output.
- Impulse response – Critical for describing how a system reacts to a unit impulse input.
- Decomposition / Superposition – Important when analyzing linear systems or separating/combining signal components.
- Standard deviation – Useful for measuring signal variability and setting dynamic thresholds.
- Statistics / Probability – Necessary for handling noise, performing filtering, and making decisions under uncertainty.
- Basic mathematics – Required as a foundation for all DSP concepts.
- PRT code – Essential for implementing the system logic within ProRealTime.
@JS
Would love to see dates attached to that live performance as a bias reference.
Having so much fun with this, and even better it has defined and built on concepts I have already proven to myself and had in the “meaning to get to” basket. I think I get the filtering process in concept and practice after a few lectures, but the sequencing and vector classification is going to take me a very long time I think 🙁
JSParticipant
Veteran
Here is the “live” performance so far…
@JS
My head is on fire! Too many lectures, maths and testing. Not much sleep!
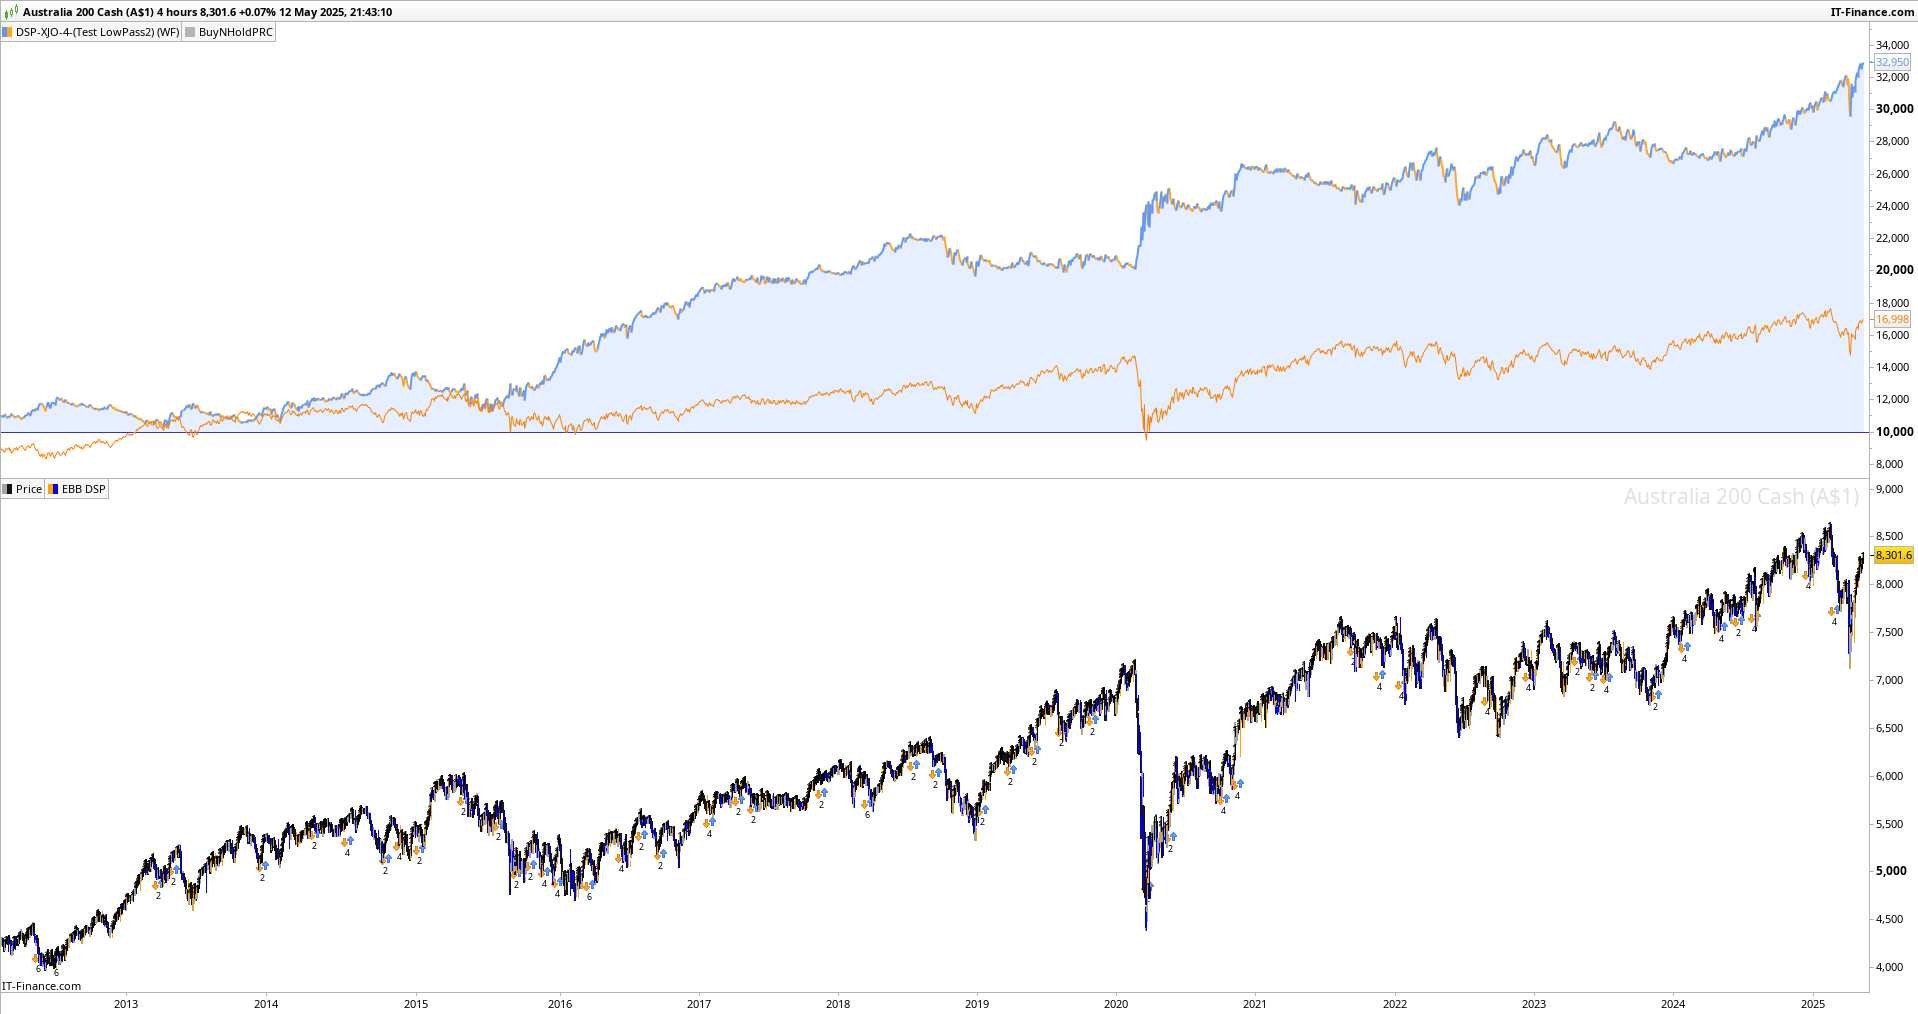
So I have made huge inroads and am now looking at price/time in ways I had only dreamt of. Below is my first result, however it is missing the D and I used one of my known signals for simplicity to play around with the concept. So an OK slowbot and the true equity curve minus the noise is beautiful. Beats the market no problem at all (double) and deals with fomo because it is always holding something. The risk I see is the 2020 crash could go either way. A hard stop kills it and there are limited signals. Most of the profit comes from the long side and the shorts seem to exist as a hedge but still profitable in themselves.
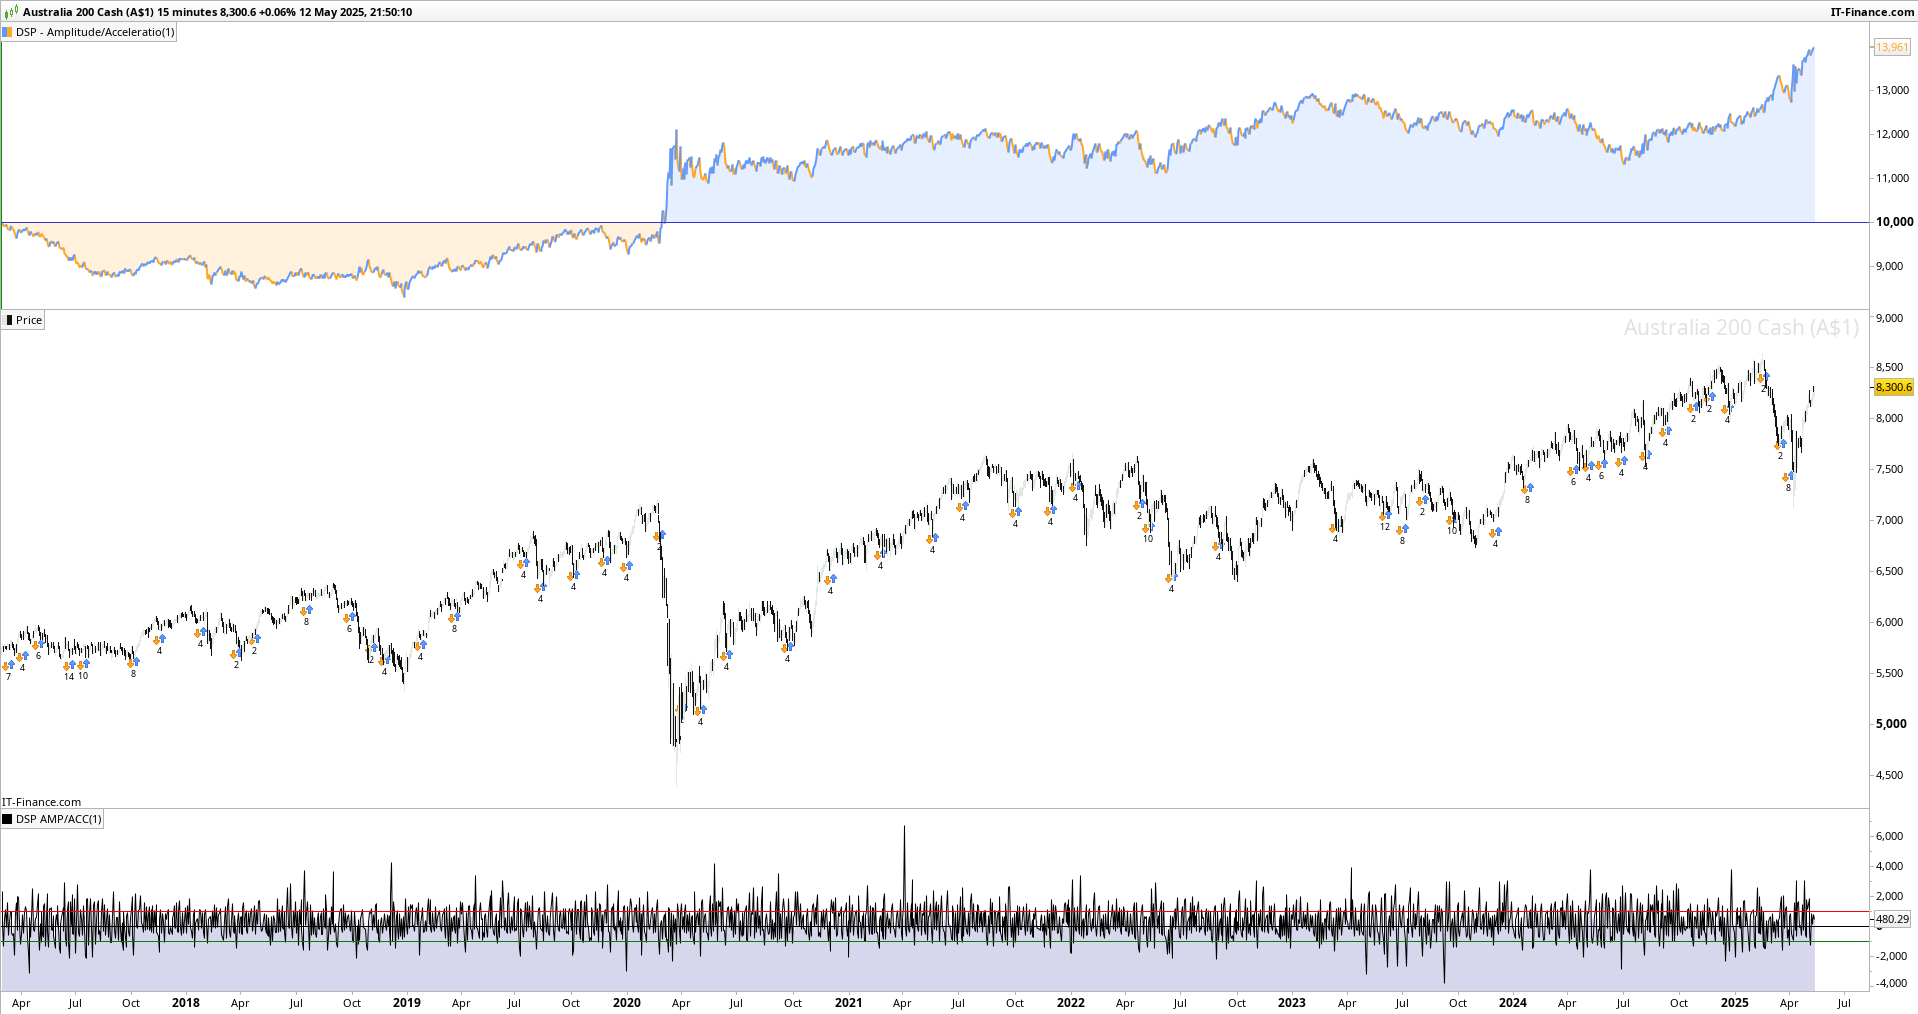
But the problem lies in having enough signals to look at. I have a scientist friend and this is his concern also but he has not ever worked with price data just soil. So DSP solves this but I am still early days. If I’m even close to being in the right direction then I will be doing this for a very long time. The third slide is a visual I made to stop my head hurting so much. So far only includes Amplitude, Acceleration and STD. Fun stuff indeed. I am finding other uses for this information to build with too.
How am I going then? Also, how is your work going?
it is missing the D
What is the D please?
Decomposition?
Yes I was unclear Grahal, I mean the Decomposition as the data we work with is already digital.
Really, that 4hr slowbot has not much done in the way of defining individual characteristics. That is in my indicator sample.
I did use however an impulse bar I build with regularly/exclusively that forms part of a cycle regime filter so i thought it may be fit for purpose.
My head has exploded at the Fourier Transform to get wavelets. Not all the way there conceptually I don’t think. Just need some feedback.
How about you, what are you working on?
JSParticipant
Veteran
You’re doing well — your stats (win rate, P/L ratio) look solid…
I assume you’ve tested other timeframes as well, since the number of trades is obviously tied to the 4-hour timeframe you’re currently using…
It definitely looks like you’re on the right track, especially considering the relatively short amount of time you’ve been at it…
My own system is still profitable, but since early May things have stagnated a bit, and this morning’s market open triggered my emergency stop…
Nothing unusual or unexpected, really — but to draw any real conclusions, we’ll need at least another six months of data…
Great. Thanks, yes I have tested it for robustness and it works on many indices incl ftse, dow…No optimisation. I’m very careful here. I don’t like 4hr but it suits my thin market. Actually built it on the Dow 60% data.
I only want a Gamma distribution. Anything that ever makes me money has this character. The longer I trade, the more I trade for tails.
In fact it was the ftse test that alerted me to the downside of such a system, also now confirmed as just happened to you! Your in place as per normal and cop a huge gap. I guess it will happen often enough hence the 2% stop.
I was lucky and had a huge win on the Nasduck on this occasion this afternoon after buying the gap up on a breakout system.
All the best, let’s see the next few months for you. It’s years and quarters for me haha.