The Clenow Plunger
“Trend Followers buy on 50 day breakout with the trend using a 3 ATR trailing stop. Position volatility is adjusted using ATR, targeting 20 basis points impact.
So when do trend followers suffer? On sharp trend pullbacks of course. Whether that happens right after breakout or later in the trend, it’s these pullbacks that cause the problem. In particular when there’s a pullback far enough to trigger a stop loss and then turns back into the trending direction. This happens all the time and it’s highly frustrating.
But what if we could quantify and measure trend following pain? Perhaps we can find a way to enter trades just as many trend followers are forced out?
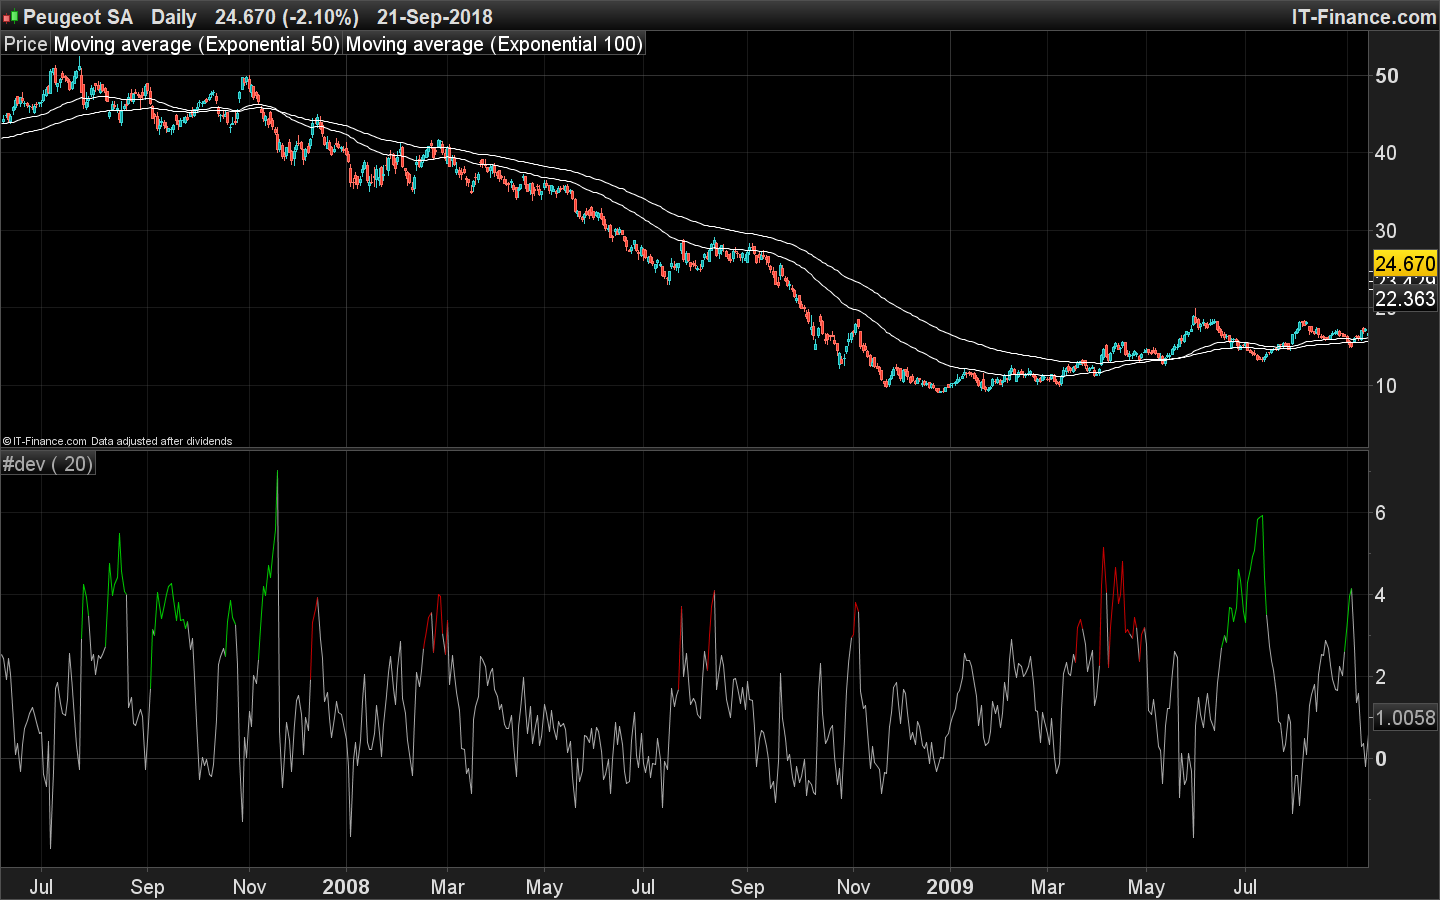
Let’s start with the trading model presented in my book and make an indicator to measure pain level. Quick recap: The model had a trend filter using 50/100 day EMA, entered on 50 day extremes and took stops at 3 ATR units against the trend. And that’s the one sentence summary of my 300 page book. Sorry for the spoiler.
The stop logic is key here. What if we made an indicator that measures how many ATR units we are from the recent peak? Yep, that’s exactly what The Clenow Plunger does.
The input numbers can of course be changed:
- Check the trend filter, using a 50/100 EMA.
- Check the last 20 day extreme price, in the direction of the trend
- Check current price.
- Calculate the difference between current price and 20 day trend extreme.
- Normalize this difference by dividing it by a 50 day ATR.
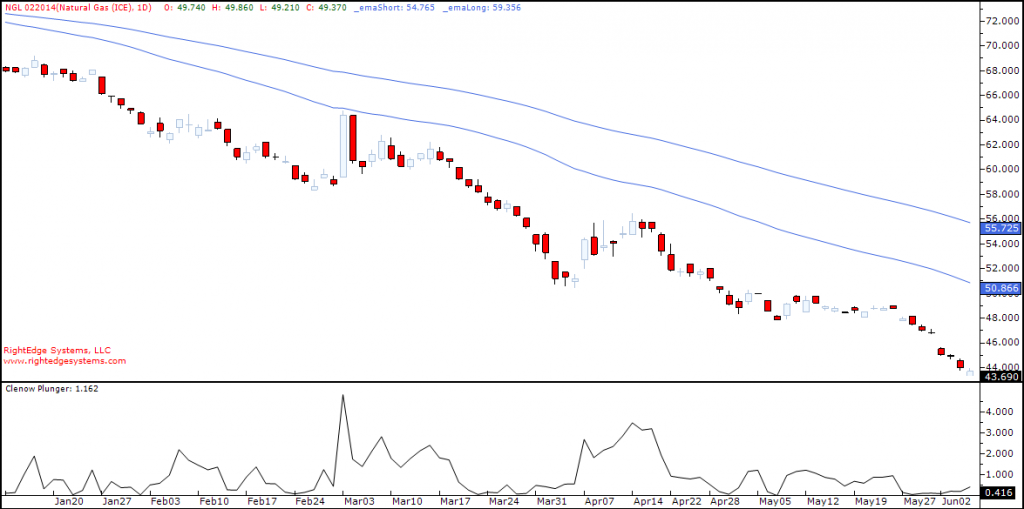
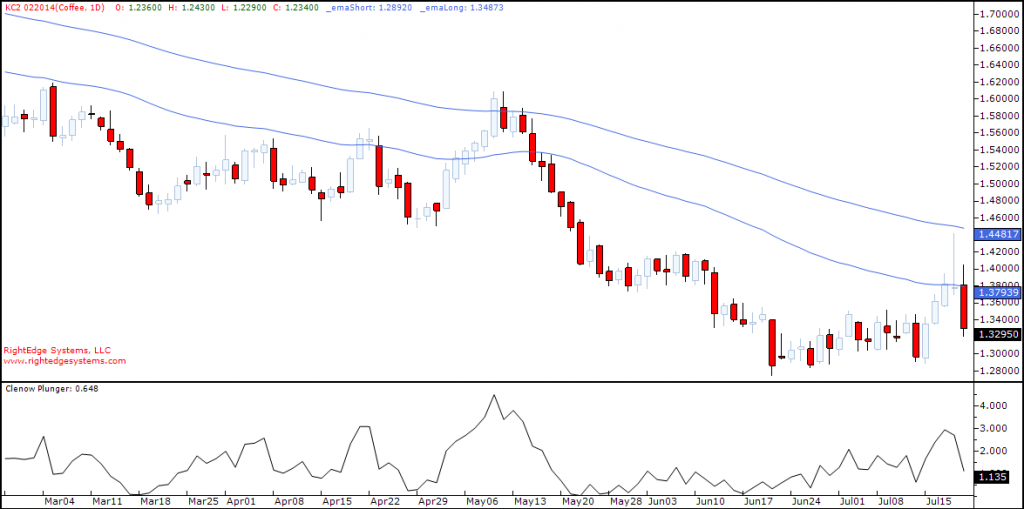
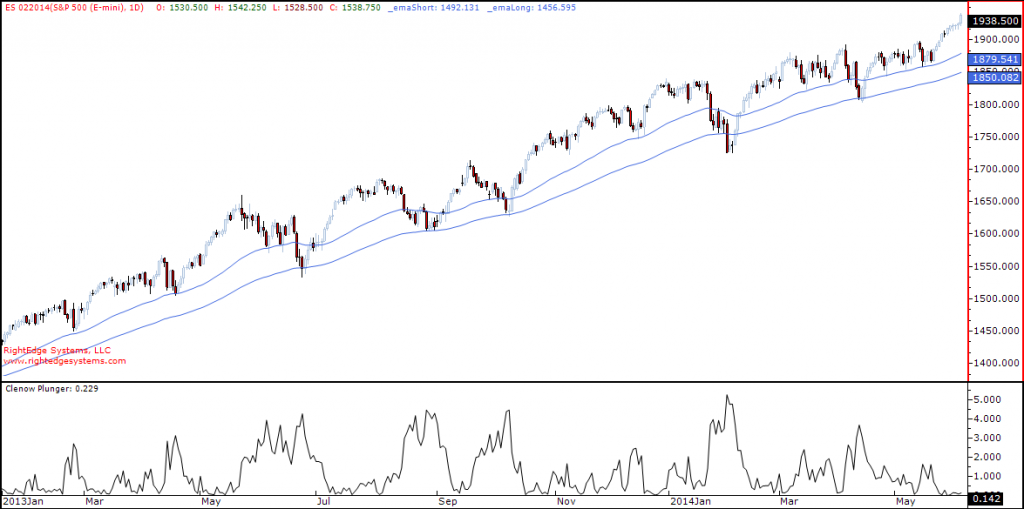
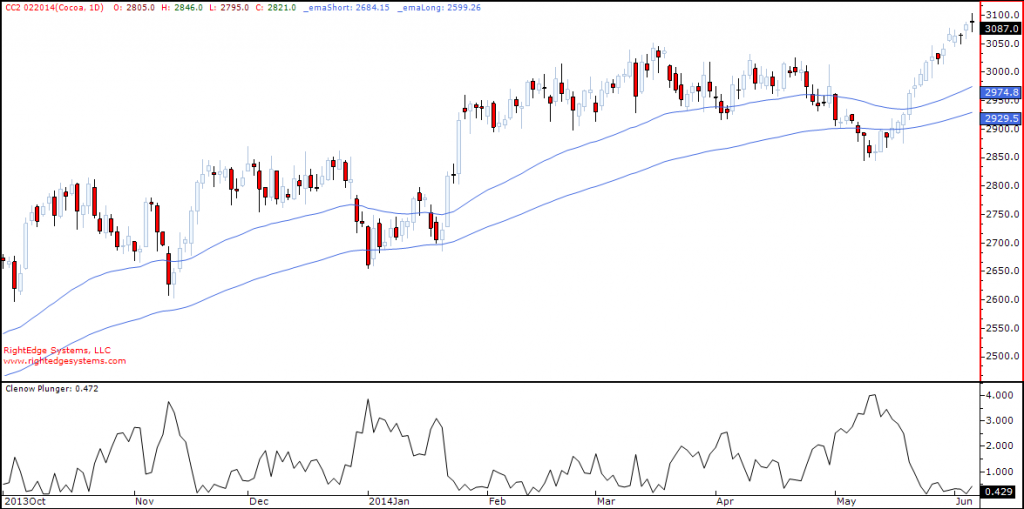
Now you’ve got an interesting indicator. When the reading is around 3, many medium term trend followers are exiting. If you do some simulations, you’ll also find that this is a pretty good entry point.
This indicator can be used for entries into both counter trend and trend models, depending on how you want to handle your exit strategy.
Note in these charts how the Plunger spikes up during pullbacks (downtrend), just as it should. It measures the extent of the pullback on a normalized basis.
In essence, it measures trend following pain levels. This can be traded in a few different ways of course. Having a good entry point is only part of making a complete trading model.” —
Andreas F. Clenow, Chief Investment Officer of ACIES Asset Management AG.
http://www.followingthetrend.com/2014/06/a-counter-trend-indicator/
Andreas Clenlow Code:
if (trend() ==1)
			_plunger.Current = (_top.Current - Close.Current) / _atr.Current;
		else
			_plunger.Current = (Close.Current - _bottom.Current) / _atr.Current;
Amibroker Formula for the ClenowPlunger:
http://backtestwizard.com/the-clenowplunger-amibroker-afl/
Trendup = EMA(C,50) > EMA(C,100);                 //Change the (50) to as you please.
TrendDown = EMA(C,50) < EMA(C,100);             //Change the (100) to as you please.

TwentydayHigh = ValueWhen(C > Ref(HHV(C,20),-1),C,1); //Change the C to H if you prefer.
TwentydayLow = ValueWhen(C < Ref(LLV(C,20),-1),C,1);  //Change the C to L if you prefer.

CurrentATR = ATR(50);                 //Change the (50) to as you please.
CurrentClose = C;

PlungeUp = (TwentyDayHigh – CurrentClose) / CurrentATR;
PlungeDwn = (CurrentClose – TwentyDayLow) / CurrentATR;
ClenowPlunger = IIf(trendup,PlungeUp,PlungeDwn);


Plot(abs(ClenowPlunger),”ClenowPlunger”,IIf(Clenowplunger >= 3
AND Trendup,colorBrightGreen,IIf(ClenowPlunger >= 3
AND TrendDown,colorRed,colorBlack)),0,0,0,0,0,2);  //Change the 3 to as you please.
The above formula uses extreme Closing prices. Andreas Clenlow may prefer to use extreme High or Low prices.
The above formula also turns the indicator Red where possible shorts might be considered, or Green where possible longs might be considered.
This looks interesting, an indicator written by a hedge fund manager that measures how many ATR units the price spikes within a trend.
The trade logic is that you enter in the direction of the trend (or you can use it for counter trends) on sudden wide moves in a trending price series – this is the point when Trend Following systems can fail as positions are stopped out but the trend then resumes. To reiterate:
“So when do trend followers suffer? On sharp trend pullbacks of course. Whether that happens right after breakout or later in the trend, it’s these pullbacks that cause the problem. In particular when there’s a pullback far enough to trigger a stop loss and then turns back into the trending direction. This happens all the time and it’s highly frustrating.”
Would anyone be interested in coding this?
Cheers,
Bard