Hi Everyone,
We all know the perils of curve fitting. But let’s just imagine for one moment that they don’t exist – and if you could find a SIMPLE strategy that performed well over a decently large sample, it would continue to work just like the backtest….
With this thought in mind and just for a bit of fun:
What are the best theoretical results you have ever created from a backtest? Regardless of how it might actually perform in real time?
Can you, from a few rules, curve fit the data as much possible over a ‘largeish’ sample to create a great looking strategy? Even if this strategy will fall apart in live trading?
My own attempt at this is below:
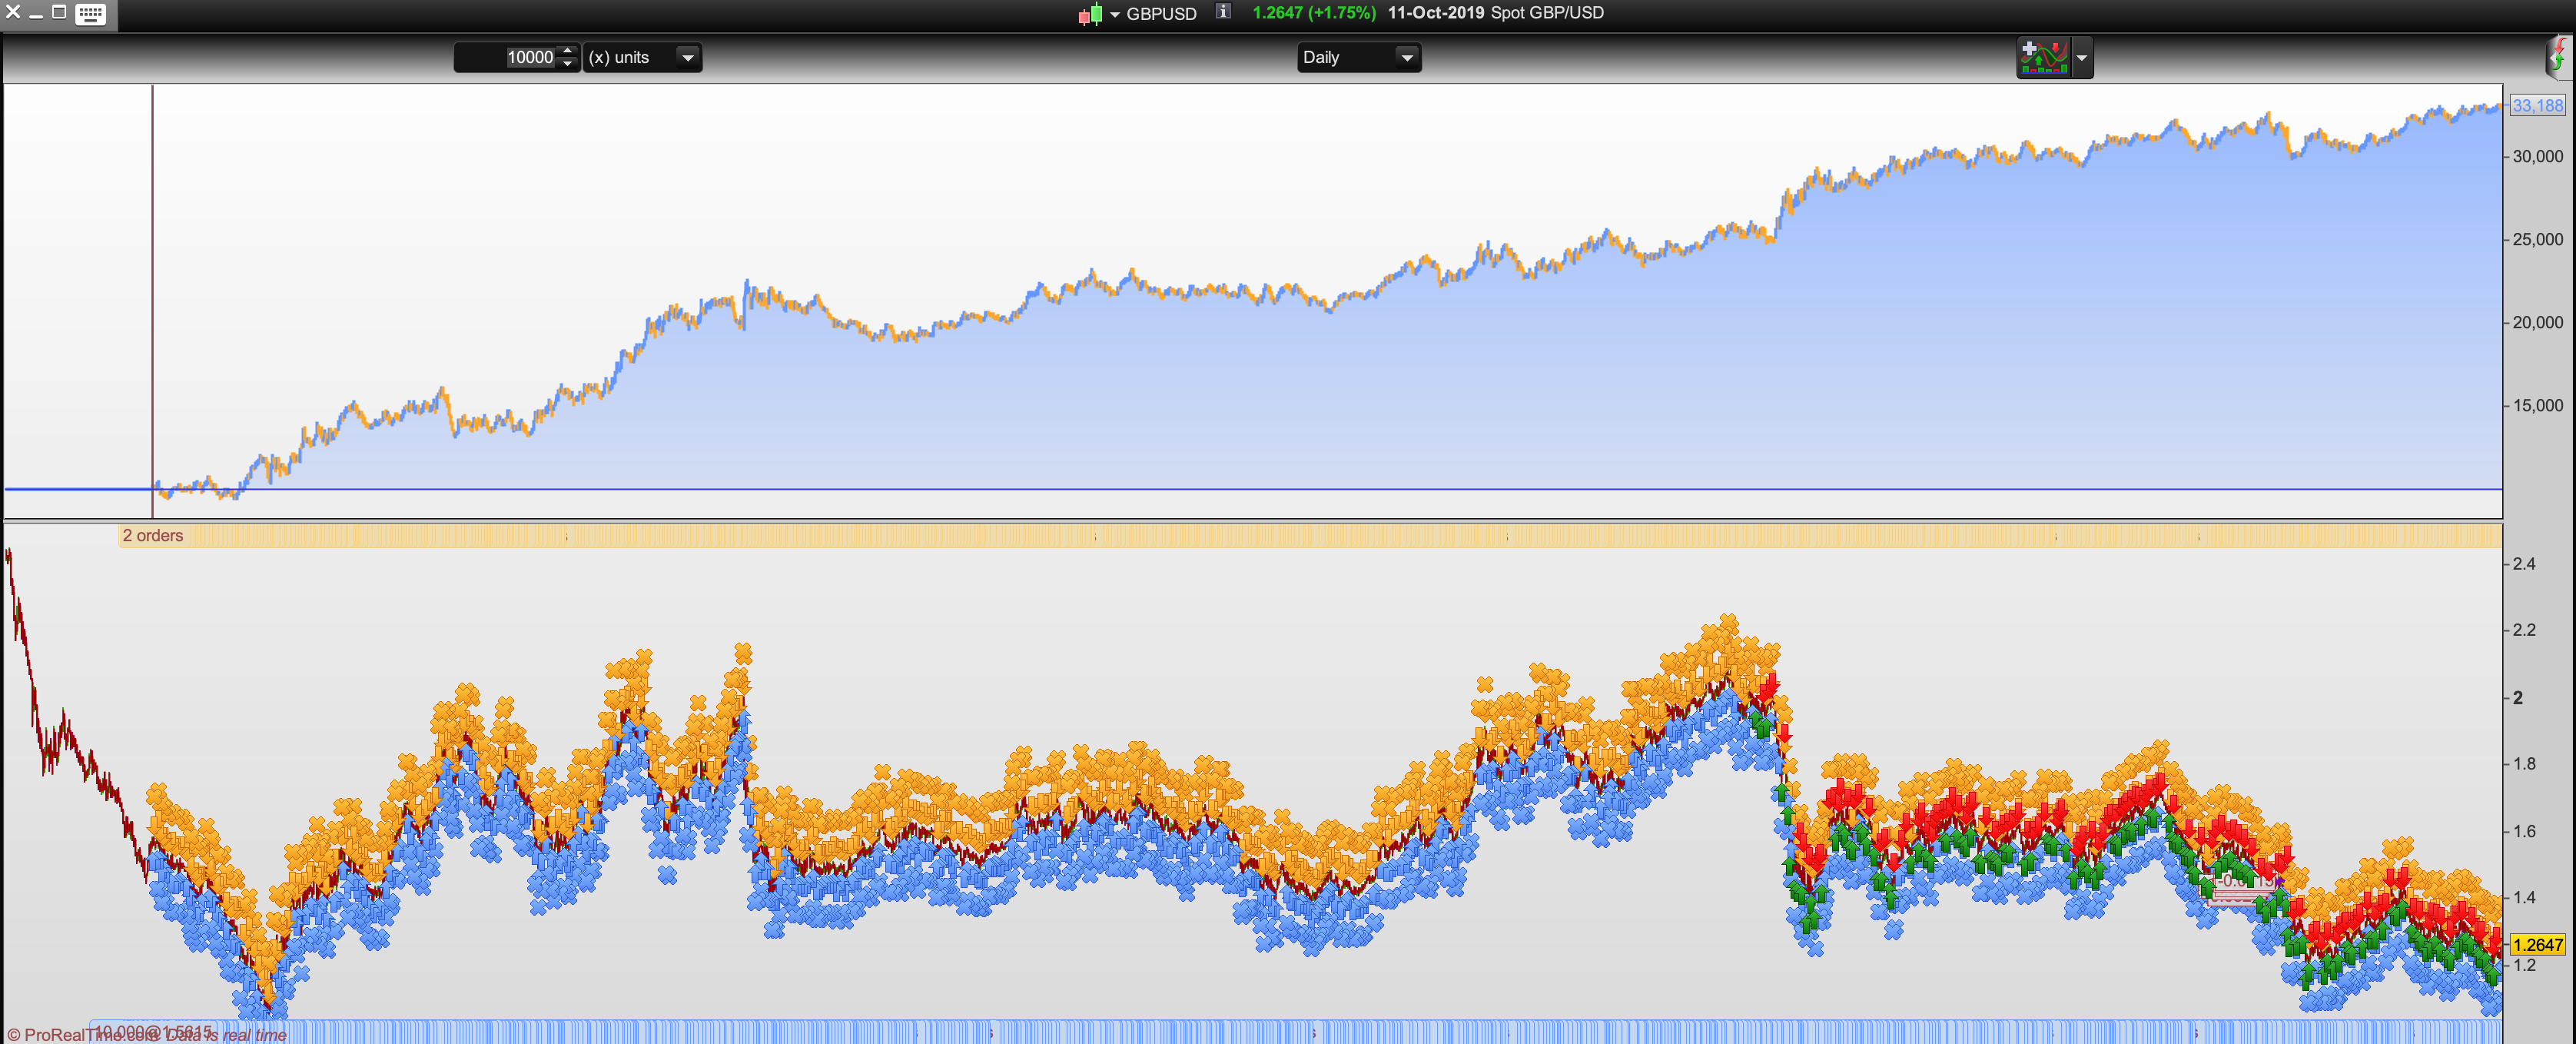
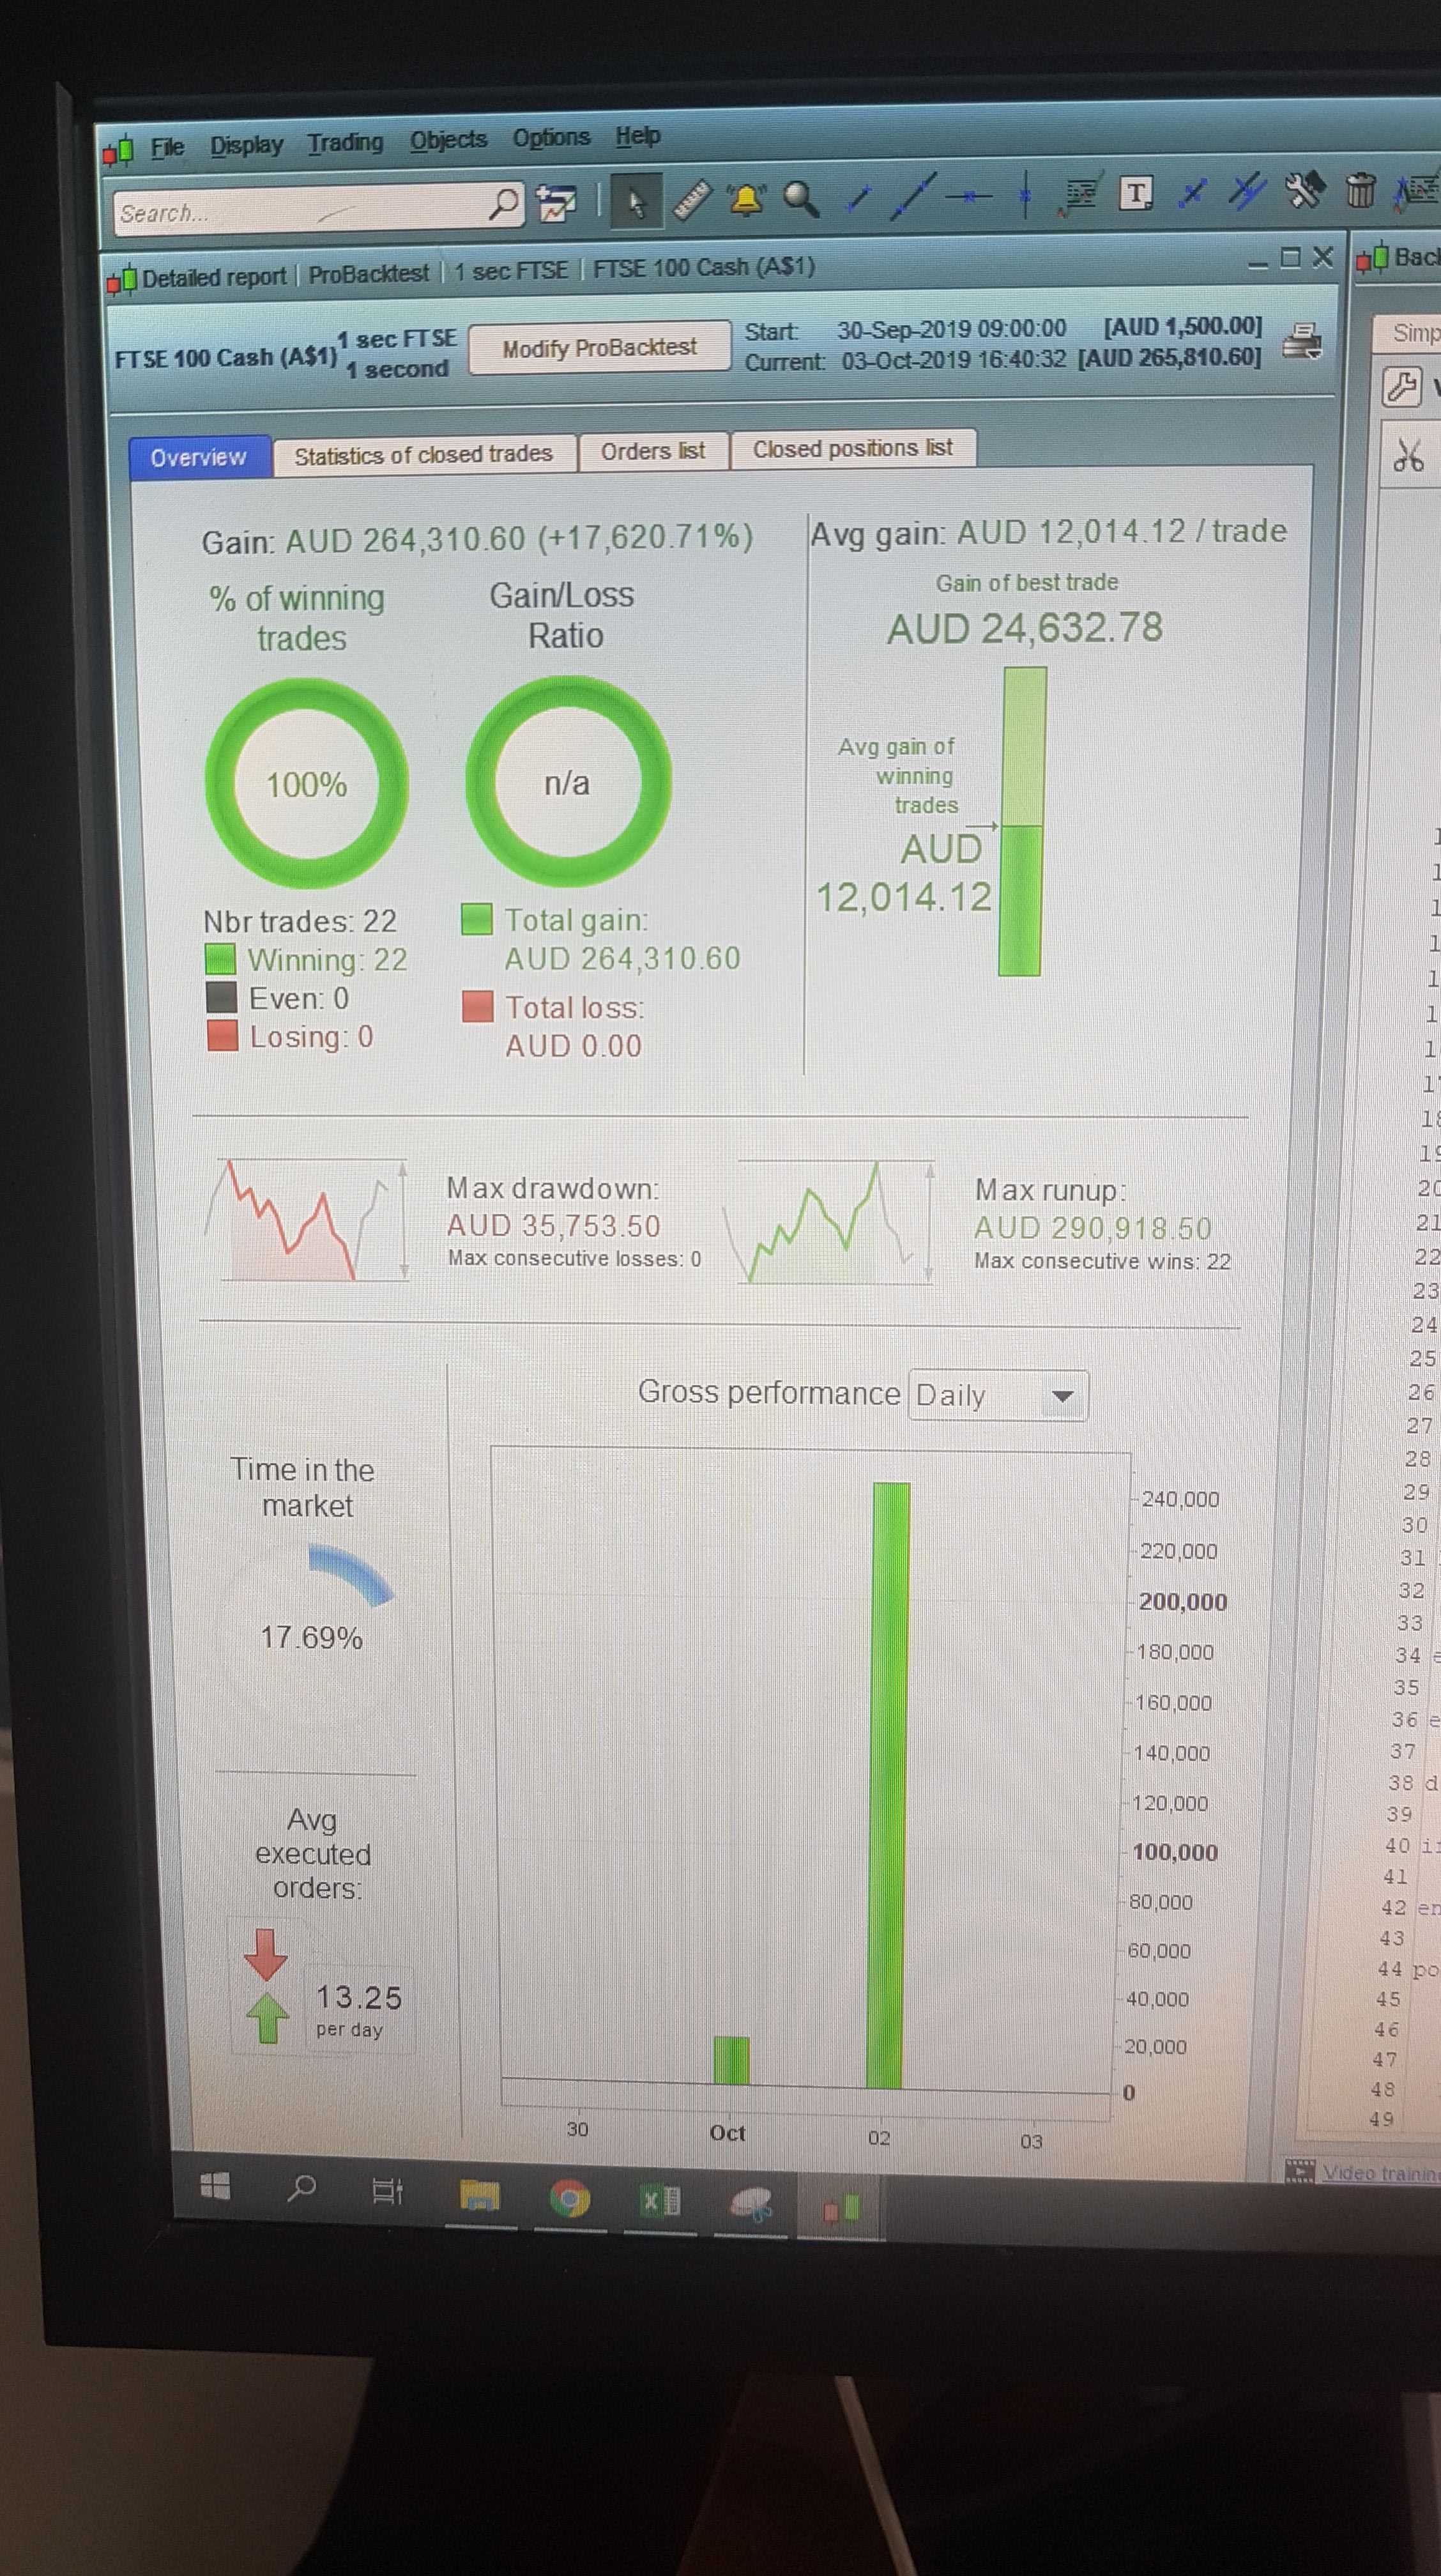
GBP/USD Daily TF
Always in the market – Long if X above Y, Short if Y above X.
Test goes from 1982 to present.
Can you beat this?
Ross
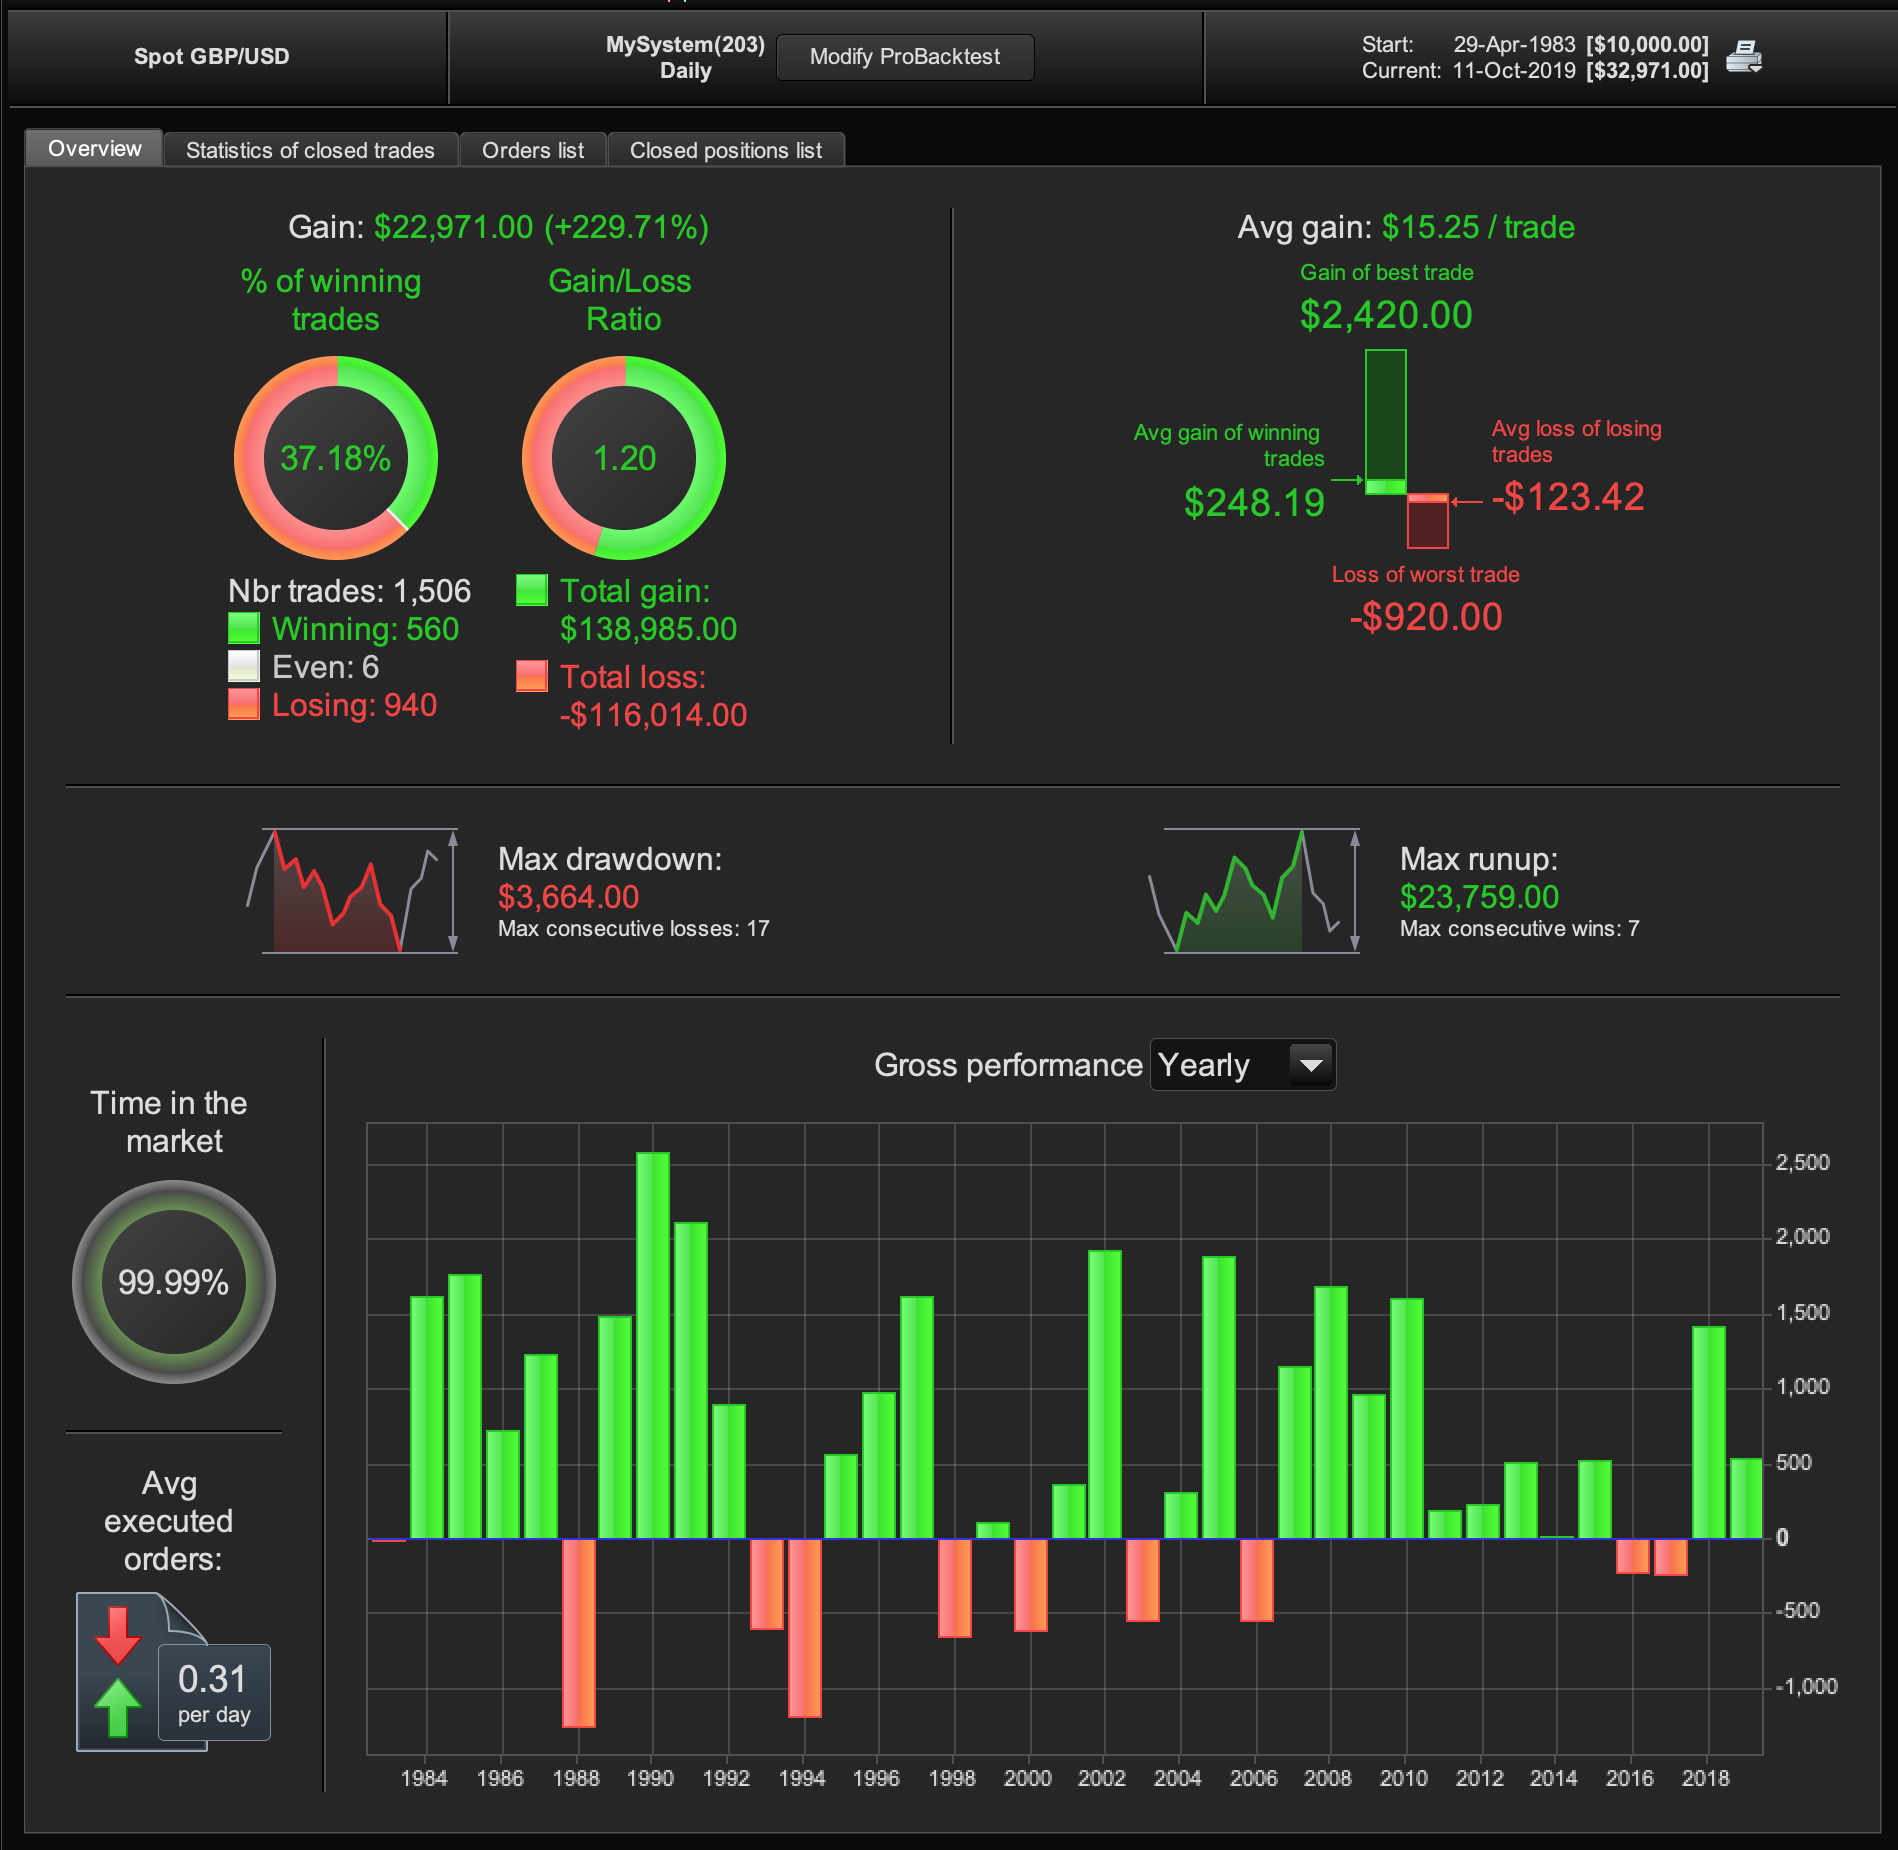
I forgot to say: Since I can’t for the life of me find out how to tell PRT to compound any gains and use a fixed % of capital per trade. These results are just a fixed dollar amount per trade over the whole sample using no leverage…..
If you add the code snippet found in this link to any strategy then they can all be judged on a level playing field of a position size of 1.
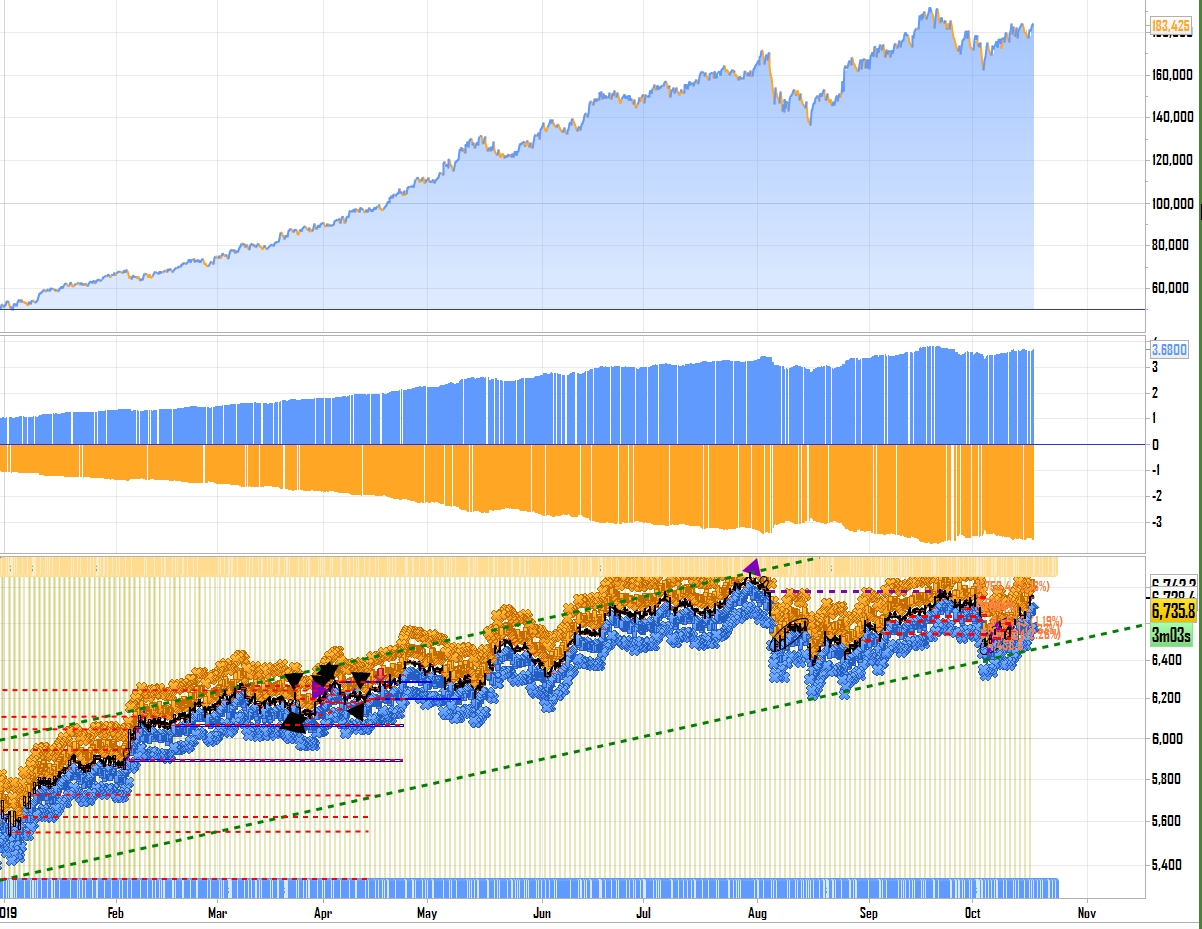
Average Gain Per 1 Code Snippet
Image attached of an equity curve from a new strategy that I am working on and currently evaluating that is based purely on one indicator with dynamic position sizing based on that same indicator whilst averaging down. The black graphed line shows the average gain for every size of 1 risked thanks to the the ‘average gain per 1’ code snippet added to the code.
I think that a strategy trading competition would be a great addition to the forums but one based on future performance rather than past curve fitted performance would be a better option in my opinion.
Well if we ignore the spread, its very simple to create a mean reversion strategy on exotic forex which looks insane, but spreads are so high that unless you add filters/other rules, it becomes uselss.
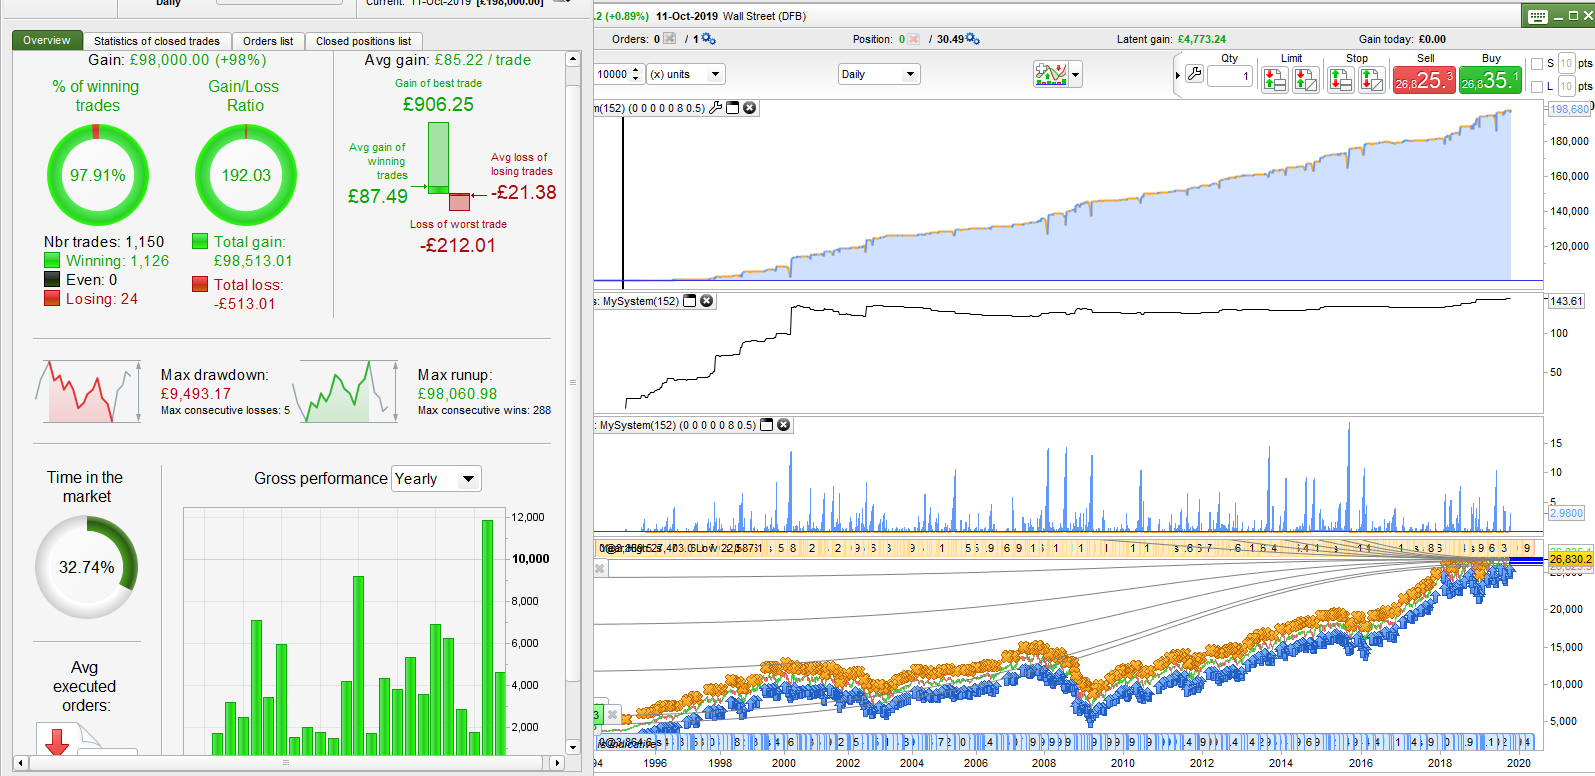
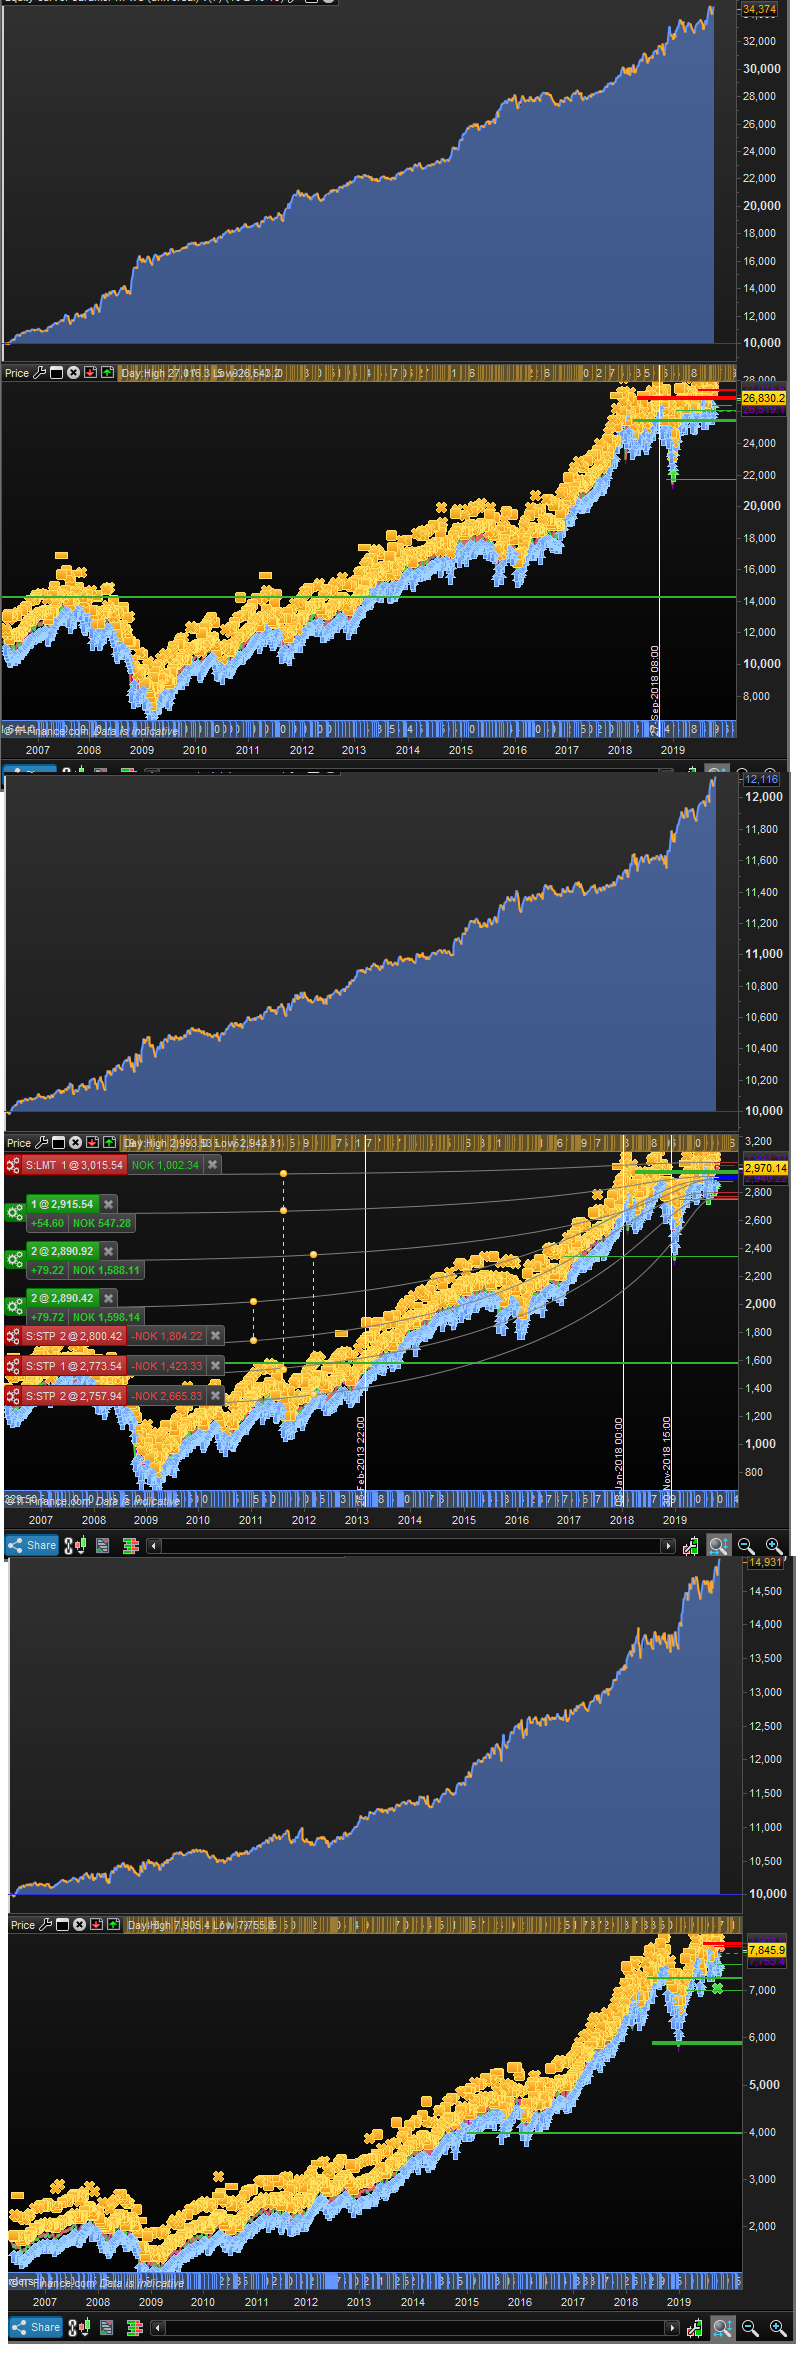
My personal best one so far is one that looks very similar in 3 major US indicies: Wall st, US tech, US 500. I only trade it in Wall st because the edge is biggest there. But seeing how well it performs (without spread added in any photos just so thats clear) does boost my confidence. Its been about 1 year out of sample.
Photo is 1* contract 1€, 1h timeframe.
My personal best one so far is one that looks very similar in 3 major US indicies: Wall st, US tech, US 500.
Those three indices are very correlated so I would not read too much into the fact that a strategy works in all of them. I would however check to see which one gave the most profit with the least draw down using minimum position size allowed – and also check which had the nicest looking equity curve. The DJI is currently a minimum position size of 0.2 and the SP500 is 1 so we should always test using the minimum size allowed to understand if our bank account can afford to actually trade an index!
I could write a novel on monopoly money. Spread is a deadset killer-even 1 lousy point.
Hey @Vonasi! I agree with the fact that all those 3 markets are very correlated. That being said the backtest is roughyl 1200 trades on 1 h candles, and all thought the main direction of the markets are highly correlated, each candle is *that* correlated.
I also have multiple strategies that works very well in 1 of those 3 markets, but does not look nearly as good in the other 2 markets, as this one strategy does. I dont know how everyone else strategies are working or how they look in similar markets, but this is by far the best results ive seen across markets. To me at least that speaks to the robustness of the systems. If it was curvefit to the max to fit 1/3 markets, it should not be looking this good when switching to another market.
We can all optomise a crap system to look fantastic but its an illusion . There has to be some logic behind it based on repeating price action patterns . I aim at reducing the lag while maintaining respectable win rates and pursue mean reversion . This curve looks great but it has no robust future , all i did was optimize MA cross from 8100 different combos , this is not the holy grail and many guys pursue this type of thing thinking they have made it but its not real . In 6 months i will post the out of sample follow up , i already know it will be negative if not blown up . This is using dynamic position sizing using the same leverage all the way through
@jebus89 – if those results look similar-ish after spread and slippage and are based on a simple pattern, they are…. insane! Well done!
@Wilko Thanks! The photos you see are without spread, but with spread they are more or less the same as you see, with a minor extra bump here or there. The edge is biggest in wall st, so im running it there. If i apply same algo on Japan, Hong Kong, Spain, France, FTSE, Dax, it does not look as good, but it is very profitable and it gives me more confidence.
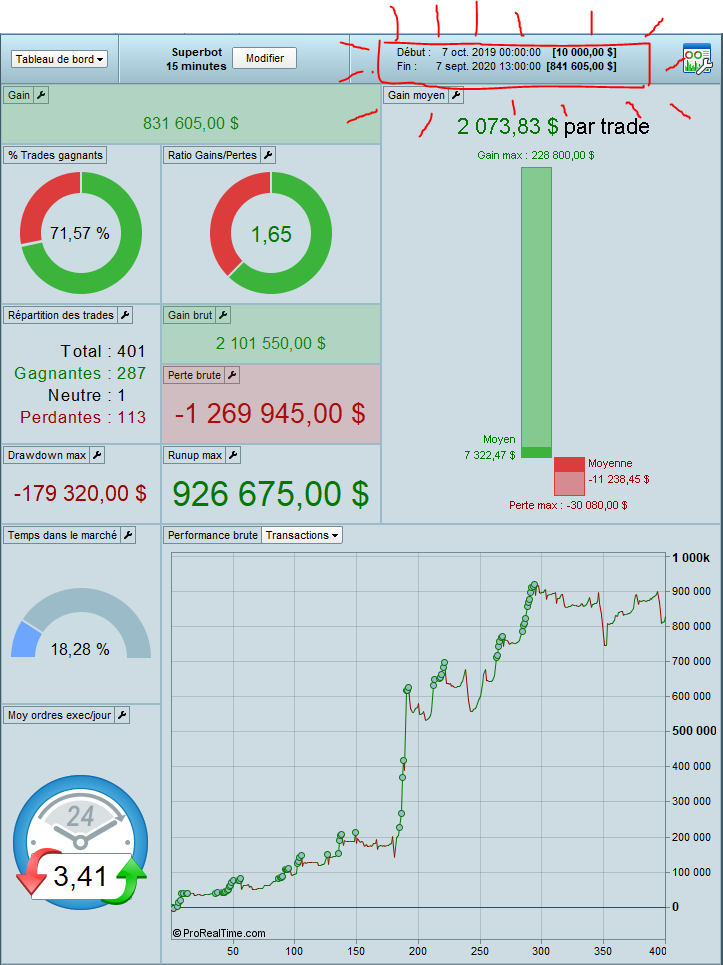
I created a bot that generated more than 8000% return in 1 year with 400 trades.
The account grew from 10k to 800k, using a spread of $2 + $5 commission per round trip to simulate futures trading conditions.
The idea is simple: trade fake breaks in TF 15min and aim for a return to the average. It also uses a filter on TF daily to detect the presence or absence of a trend.
Normally the bot generates $64,000 in winnings in 1 year (740%), but with a simple formula that increases the number of lots when there are winning trades and decreases it when there are losing trades, the bot has gone to +$831,000 in winnings.
By trying to optimize some variables the result could certainly have been even better, but the bot would have been over-optimized and therefore invalid.
The bot gives very good results on US indices, commodities and some forex pairs on the TF 15/30 and 60min.
This result was obtained on the NQ in TF 15min.
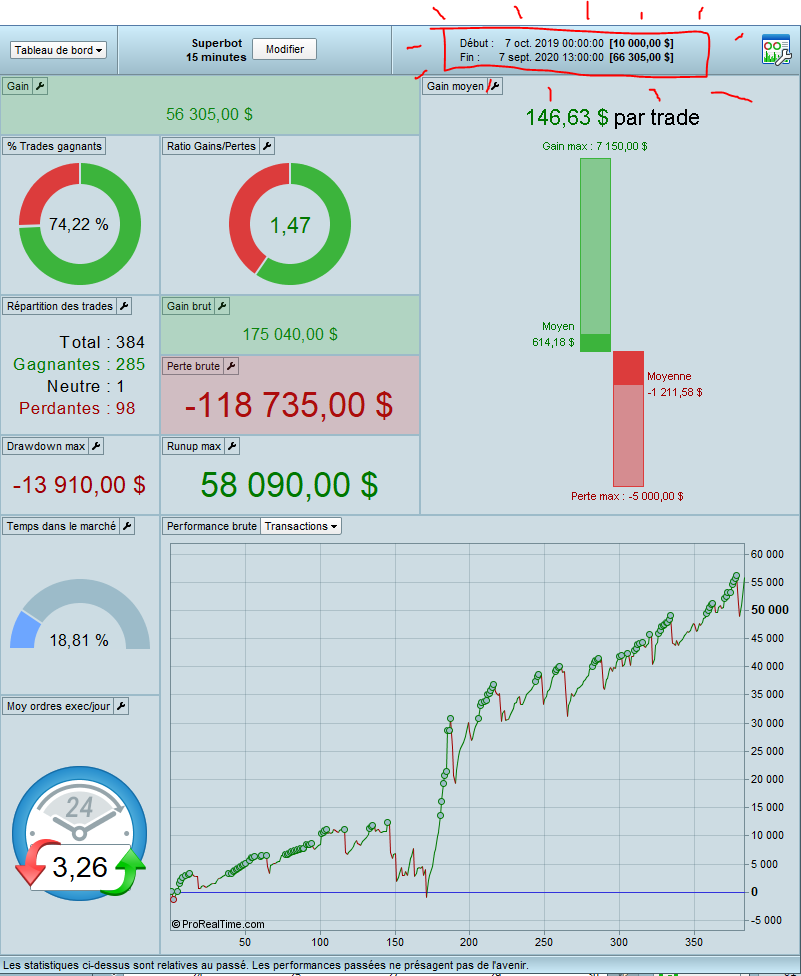
Mea culpa, without the formula to increase the lots after the gains and reduce them after the losses the gains go to +56,000$ and not +64,000$, it is the capital that went from 10,000 to 66,000$.
On the other hand, the number of trades increased from 401 to 384.
I wonder how the moneymanagement of a strategy can have an impact on the number of trades if the conditions of the strategy are not changed?
Interesting to say the least @Oliviertrader2020 ! 🙂
What is the position size to get the results above?
And the results from Backtest or Live running Forward Test?
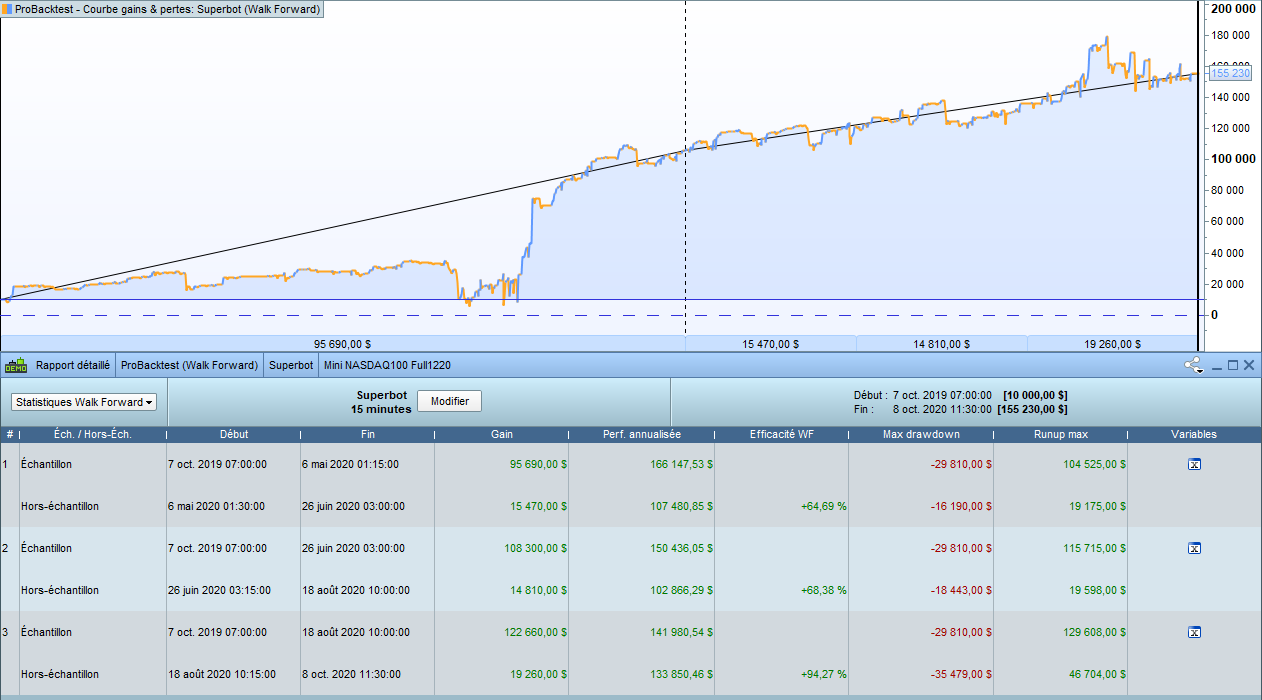
Hi @GraHal, I always use Walk Forward.
The number of lots varies from 1 to 20 lots in the first case (10k to 841k)
In the 2nd case (10k to 66k) the number of batches is always 1.
I also made an approach between the 2, with a number of lot that varies from 1 to 4 depending on the capital and the series of trades (adding lot when the last trade is winning, removing lot when the last trade is losing.
In this case the capital goes from 10k to 150k in 1 year.
I am coding it on NT8 to test its robustness with more advanced tests and a much longer period (16 years instead of 1 year in TF 15min).
I love PRT for quickly coding certain ideas with the simplicity of its language (even simpler than Tradestation’s Easylanguage). When the tests are interesting, I code them in C # to validate them and possibly run them on futures.
I always use Walk Forward.
So the results you show and discuss are on Backtest and Walk Forward ( I can see the WF results in your last attachment) ?
Would you like to post the code and I would run it on Forward Test for you (at min position size) and let you know how it performs on Live Real Time data?