Hello Everybody,
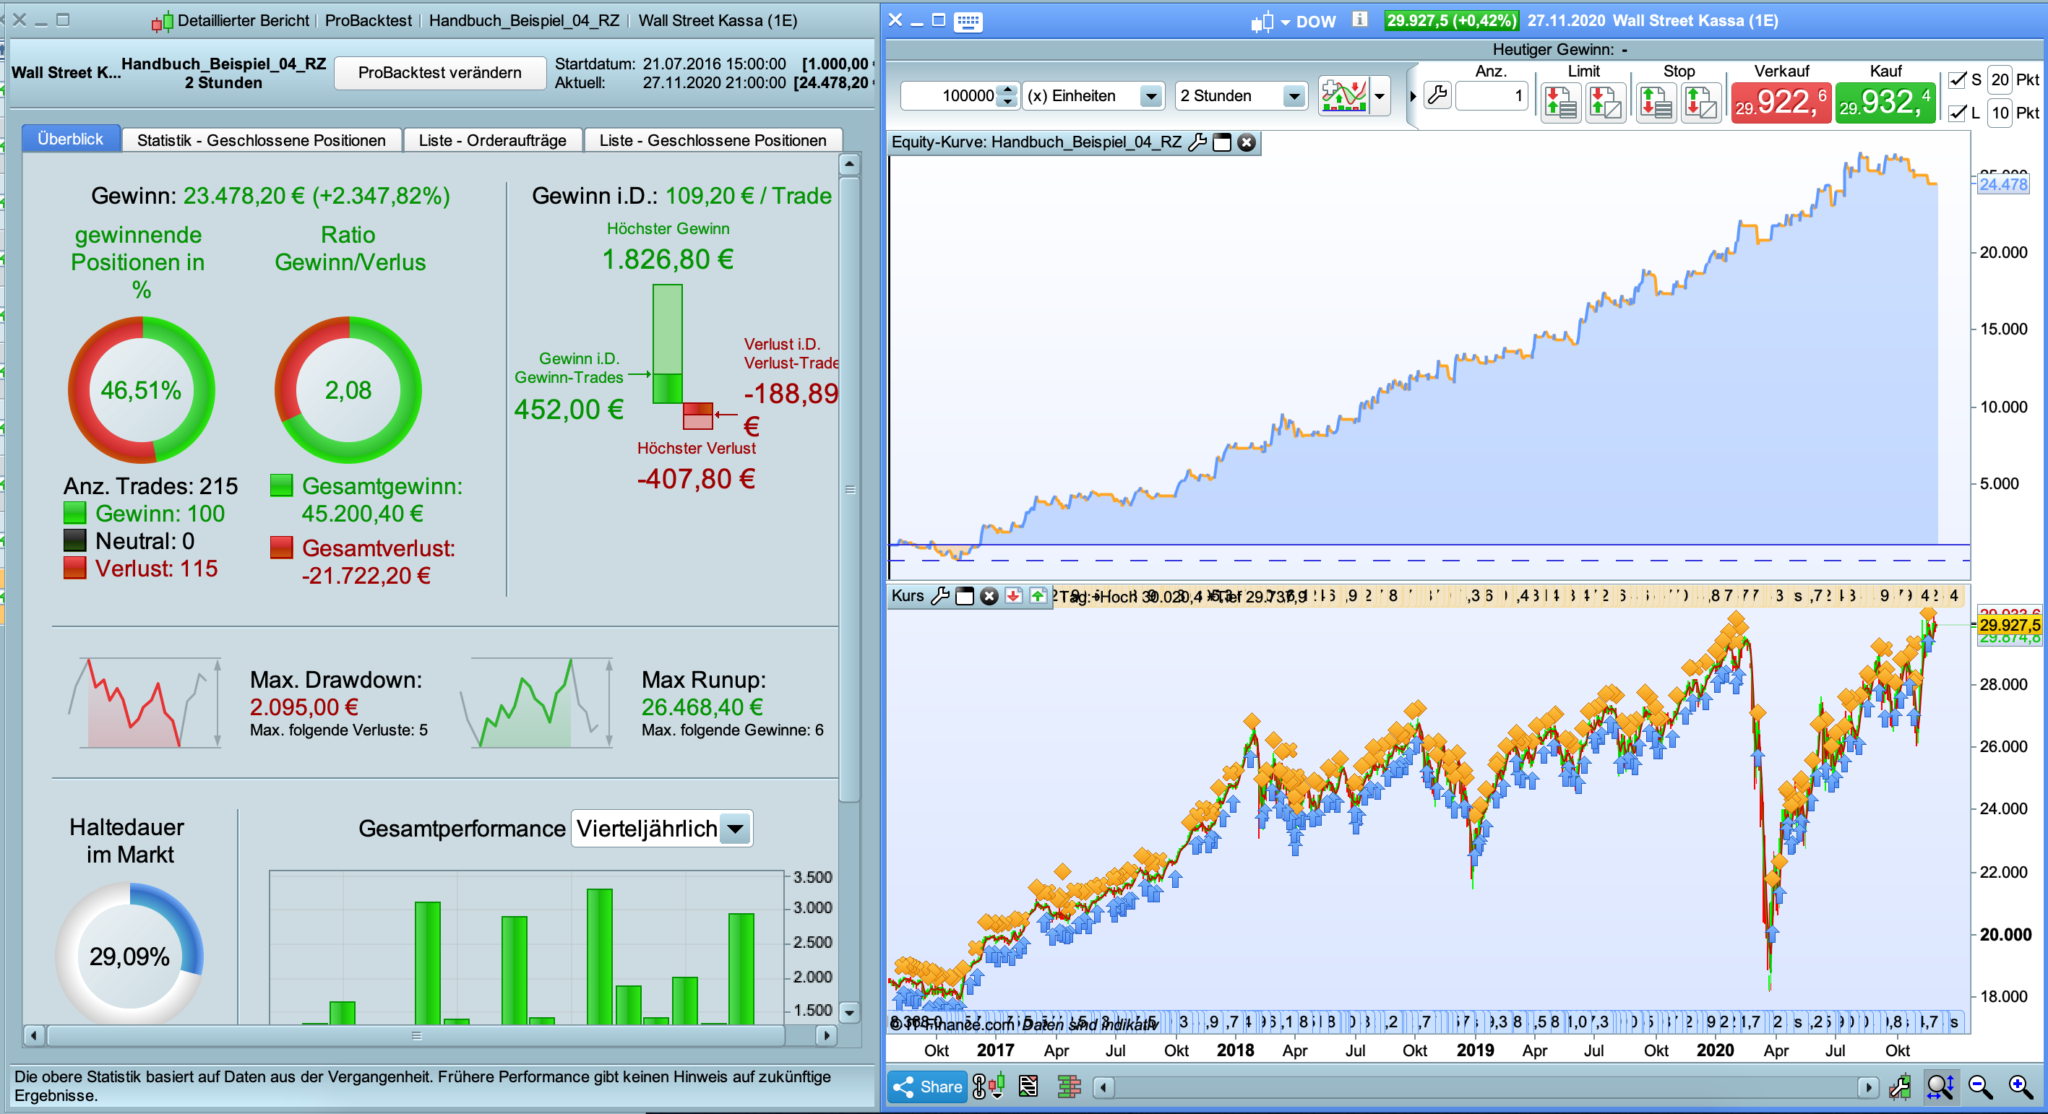
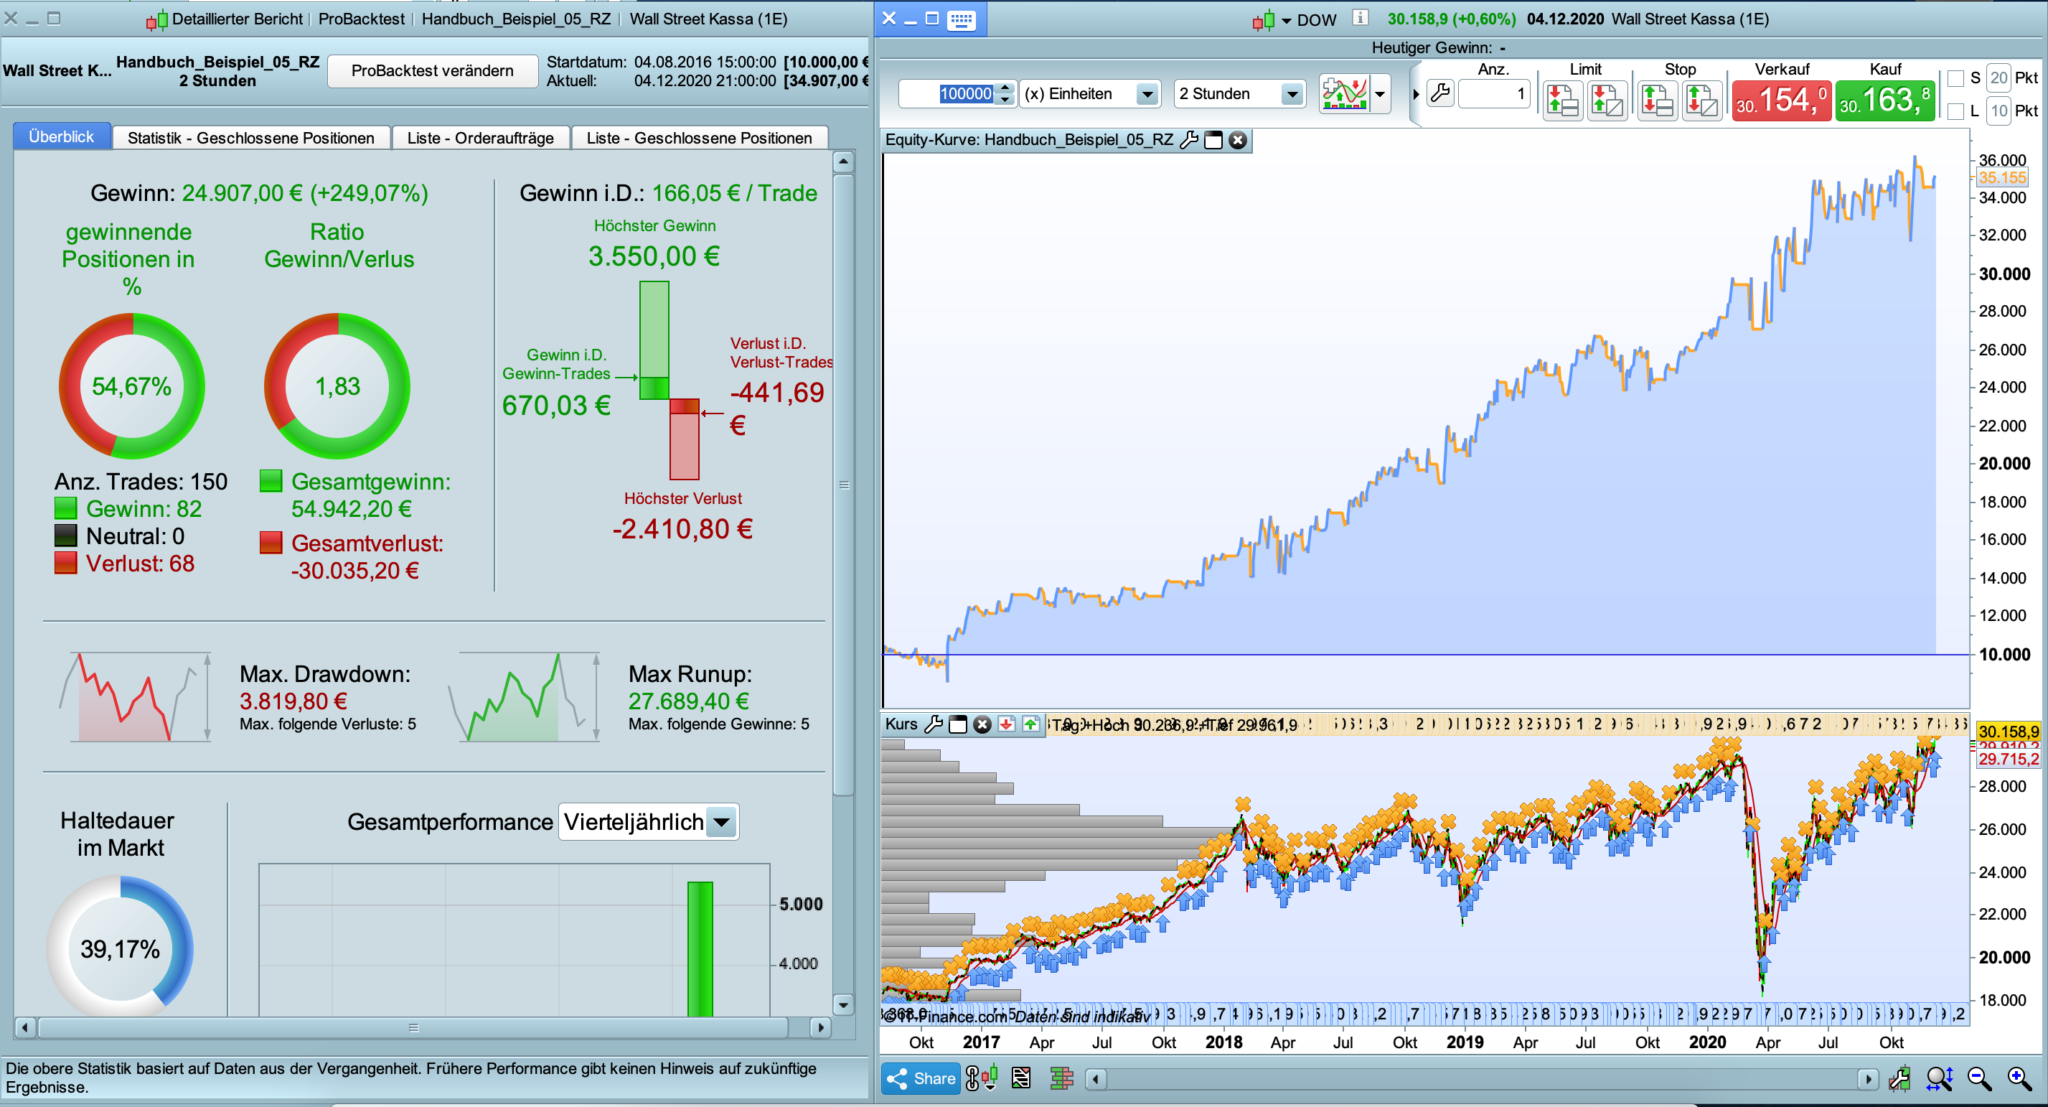
At the moment i learn from reading the First pages PRT-ProOrder_Workbook pdf and making some simple experiments and different markets and Timeframes an try to tuning them up. Here is what i found on the Dow on 2h Timeframe with a spread of 2. I wanted to ask if you see potential in this system or not? And when Not/yes, then why.
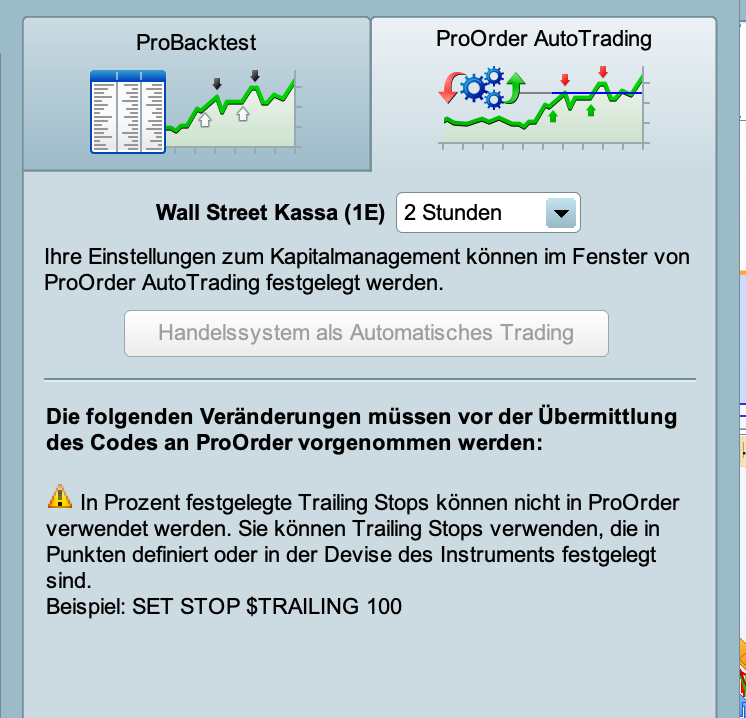
The Problem i have with this, is that i couldnt take it live if i would to. IG Proorder says that i cango live with an %trailingstop. Are there any ways to get around that?
// Hanbuch_Beispiel_02

// Allg.
DEFPARAM CUMULATEORDERS = false
DEFPARAM PRELOADBARS = 200

// Positionen ab 9 Uhr
noEntryBeforeTime = 090000
timeEnterBefore = time >= noEntryBeforeTime

// Positionen bis 18 Uhr
noEntryAfterTime = 210000
timeEnterAfter = time < noEntryAfterTime

// Trading am Mo, Di, Mi, Do, Fr
daysForbiddenEntry = OpenDayOfWeek = 6 OR OpenDayOfWeek = 0

// Menge der Kontrakte
n = 2

// Indikatoren
GD20 = Average[20](close)
GD41 = Average[41](close)

// Bedingungen
c1 = GD20 CROSSES OVER GD41
c2 = GD20 CROSSES UNDER GD41

// Gültigkeit Limitorder
ONCE NbBarLimit = 12

// Bedingung der Limitorder
IF c1 THEN
MyLimitBuy = Close
MyIndex = BarIndex
ENDIF

IF BarIndex >= MyIndex + NbBarLimit THEN
MyLimitBuy = 0
ENDIF

// Long
IF MyLimitBuy > 0 AND not LongOnMarket AND not daysForbiddenEntry AND timeEnterBefore AND timeEnterAfter THEN
BUY n SHARES AT MyLimitBuy LIMIT
ENDIF

// Long Exit
IF c2 THEN
SELL AT MARKET
ENDIF

//Stop + Trailing
SET STOP %Loss 0.75
SET STOP %TRAILING 0.75
Delete line 53. IG dose not allow set loss and set trailing together.
imokdesign – Topic moved to ProOrder forum as it is a strategy related topic. Please try to post in the most relevant forum (as described in the forum rules) with any future topics.
Okay i delete row 53. In the testrun it comes to the same Result. But Proorder forbids me to go live (see screenshot). It Says that, i cant go live with an %Stop oder %Trailingstop. It must be a $ Stop, Points or else… why does IG make such restrictions? 🙁
if i would change the stop, i would come possibly to worse results.
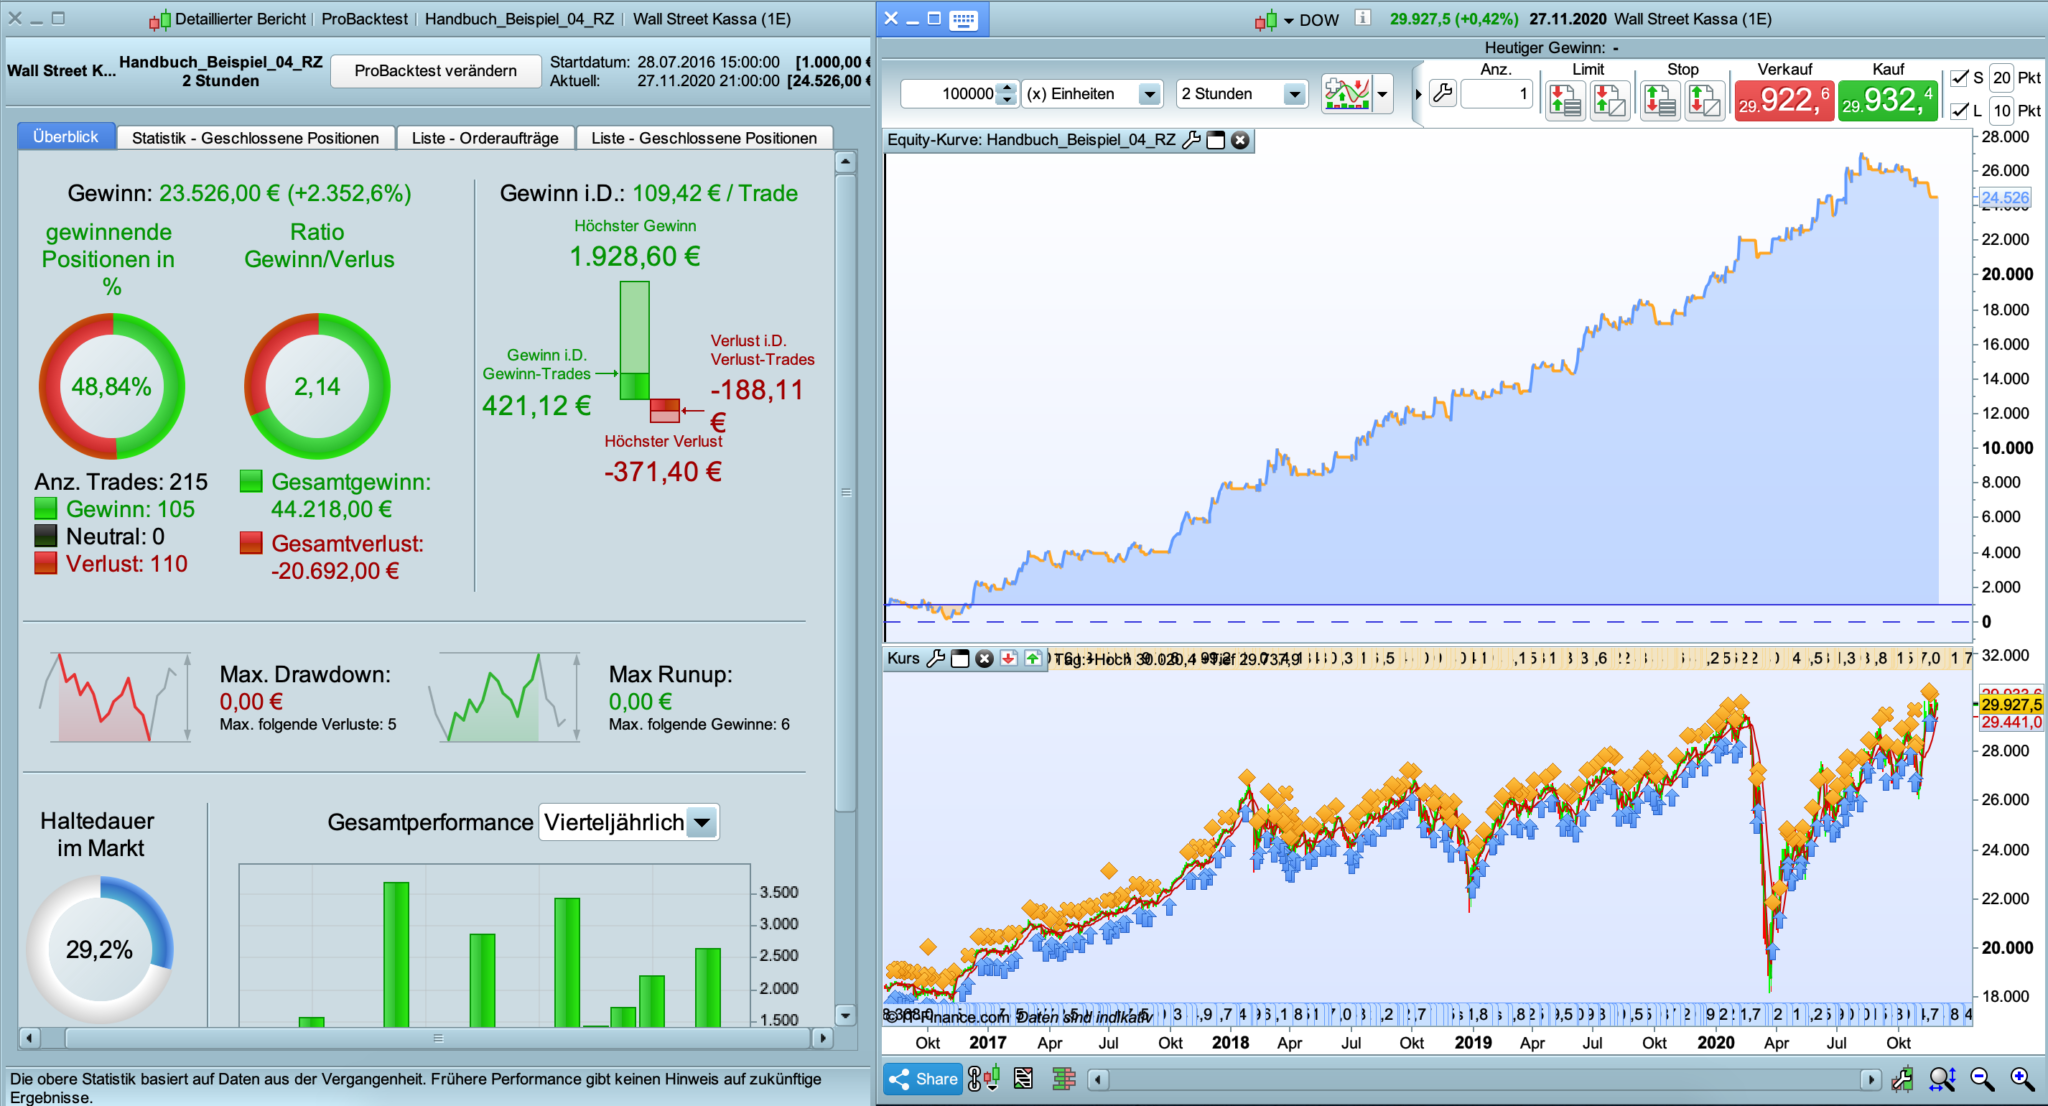
Okay with this trailing i get slightly diferent but also good results, whitch ist good. but there is a bit more Drawdown, at the End.
SET STOP $TRAILING 369.4
why does IG make such restrictions
We have to accept that is how it is.
Why don’t you use a coded Trailing Stop?
A good one is on the link below, and many more in the 2nd link
https://www.prorealcode.com/blog/trading/complete-trailing-stop-code-function/
Snippet Link Library
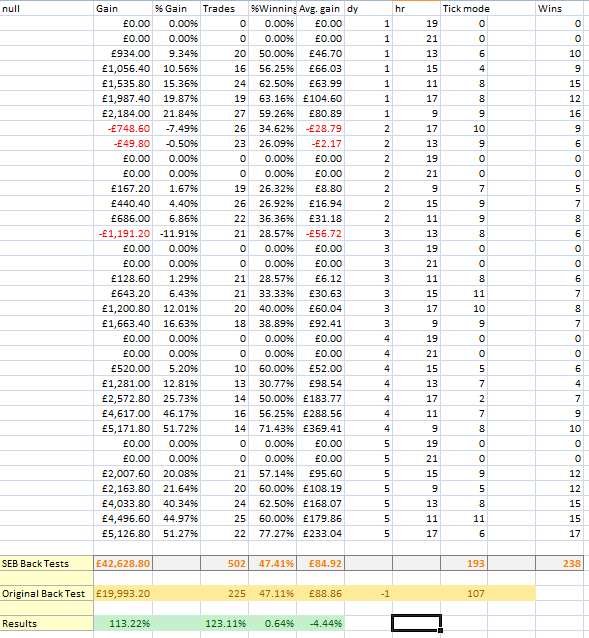
I did try applying my SEB (Strategy Every Bar) robustness test idea to your strategy and the results seemed too good to be true – because they were.
After thinking about how the code worked this was to be expected from the test as the strategy simply waits for a cross of two lagging averages and then buys if price crosses the closing price at the time of the cross within 12 bars. This sort of strategy is not very easy to robustness test as basically you get 12 chances to open pretty much the same trade. However it was a good lesson in how not every strategy suits every robustness test.
Basically the strategy is about getting in to a trade within 12 bars after a lagging average cross has occurred and then trailing a 0.75% profit. Testing the variables it is actually better to give an even bigger window to open a trade – but perhaps that just works because the market has been pretty much in an upward trend with one major drop which the the averages were tuned to exit early in. It did however seem to be profitable over a large range of variable values though which is a good sign – although perhaps also due to the large amount of long trending data.
It is a difficult strategy to robustness test and so I think long term forward testing before risking real money is the only way to see how it truly performs.
I have attached the results of the SEB test even though they are pretty meaningless!
… thx. After I replace the stop, I get good Results. If I also change the NbBarLimit, i get even better results.
After I replace the stop, I get good Results. If I also change the NbBarLimit, i get even better results.
Yes but this could just be more efficient curve fitting.
The strategy basically has 6 variables that could be curve fitted – start time, end time, 2 x moving average periods, number of bars to look for a trade and trailing stop loss level. There is actually a 7th variable as you have also excluded Sundays. That is quite a lot of combinations of variables to analyse even if many would consider the strategy to be simple!
I would start with testing each variable for how it performs with values either side of your chosen best value using 2D graphs in v11 and then use the 3D charts to test combinations of values. This is a lot of work and a lot of data to analyse but then who ever said winning at writing strategies was easy?
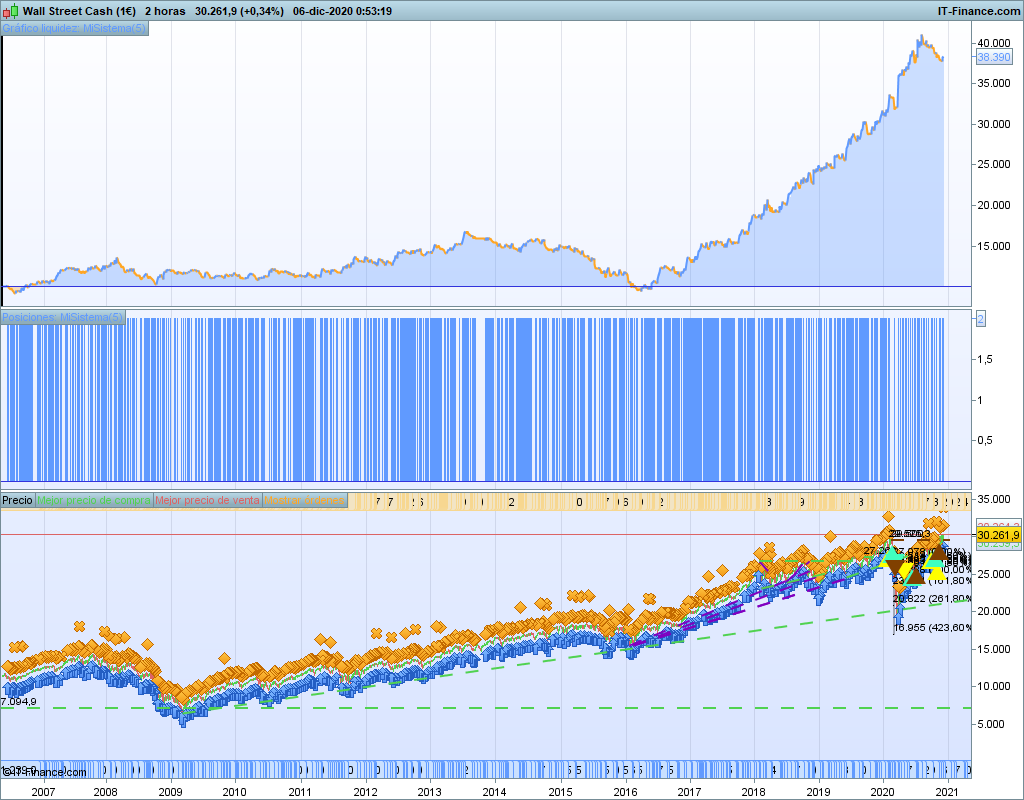
It seems that the system is curve-fitted to the Dow from the end of 2016 until today. If you run it from end 2006 to now the results are not so good (see attached img). I have only been able to test 100k bars, we would have to see the result with 200k bars…
… oh too bad. I wish I had more Data-History. 🙁