Bard
BardParticipant
Master
Hi everyone,
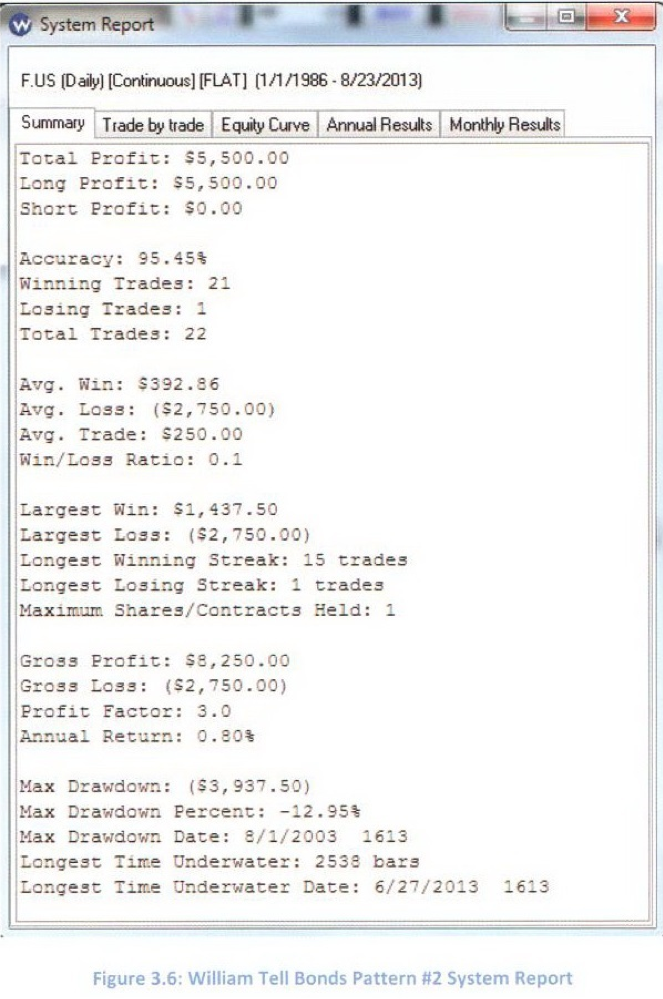
I came across a profitable Bond Trading System and was interested in it’s pattern entry exits (and combining those pattern with some indicators that filter the direction of the market). The system’s logic is this: (Note: Despite it’s 95% accuracy, you would run this system with other similar systems to compensate for the large very rare losses that create long drawdown periods)
Entry: Thursday or Friday (ignore)
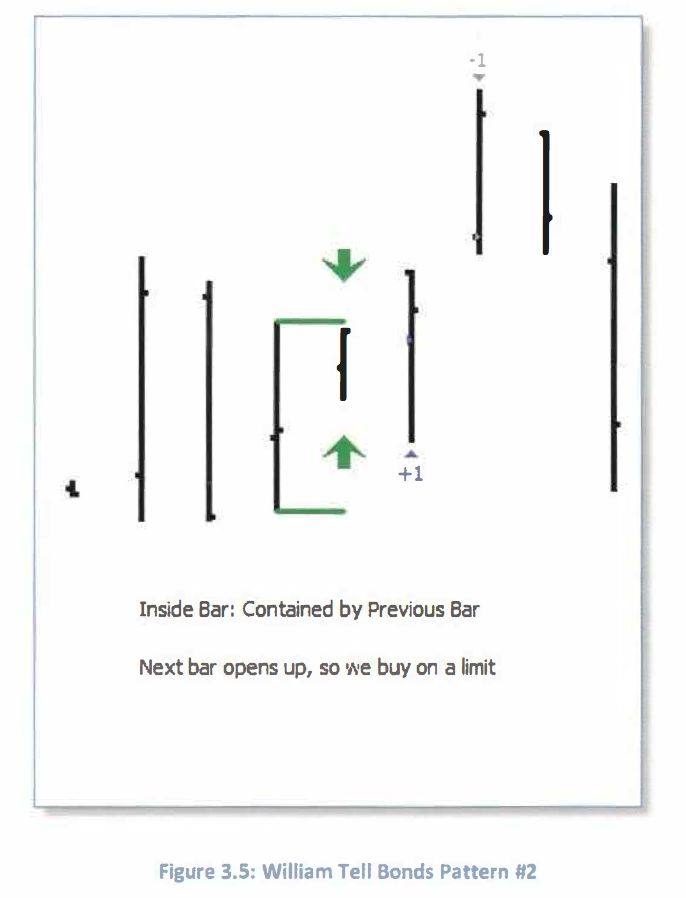
If yesterdays bar has a lower high and higher low than yesterday[1] (day before yesterday) (i.e. an Inside Day)
If yesterdays close is above yesterdays open
and if todays open gaps above yesterdays high then,
Buy, limit order set at high of yesterday minus 15% of yesterdays range.
Exit: On first profitable opening
Reasoning/Logic: Mkts are like a coiled spring with inside days and also don’t like to leave gaps so the gap will be filled allowing a better fill price.
What I can’t figure out is how to write the Exit part and also the 15% Limit Order?
Any ideas?
Thanks in advance for any help,
Bard
I coded this, would appreciate you to test it, because I didn’t. I think it should be tested on an intraday timeframe since code are only read once and I think it may be too late, at daily Close to check everything..
defparam cumulateorders=false

insidebar = Dhigh(1)<Dhigh(2) and Dlow(1)>Dlow(2)
bullishbar = Dclose(1)>Dopen(1)
gap = Dopen(0)>Dhigh(1)

buylevel = Dhigh(1)-range[1]*0.15

if insidebar and bullishbar and gap then
buy 1 contract at buylevel limit
dayopen = Dopen(0)
endif

if onmarket and Dopen(0)<>dayopen and positionperf>0 then
sell at market
endif
BardParticipant
Master
Hi Nicolas, I had the entry written as 4 separate Conditions… so thanks for streamlining it and adding the Exit.
What does this symbol mean: <>? Dopen(0) <> dayopen… Normally it’s less than and greater than.
There were not enough 1 hour bars on the £/$ so I tried it on the daily and there was only 1 inside day in 39 years which is surprising?
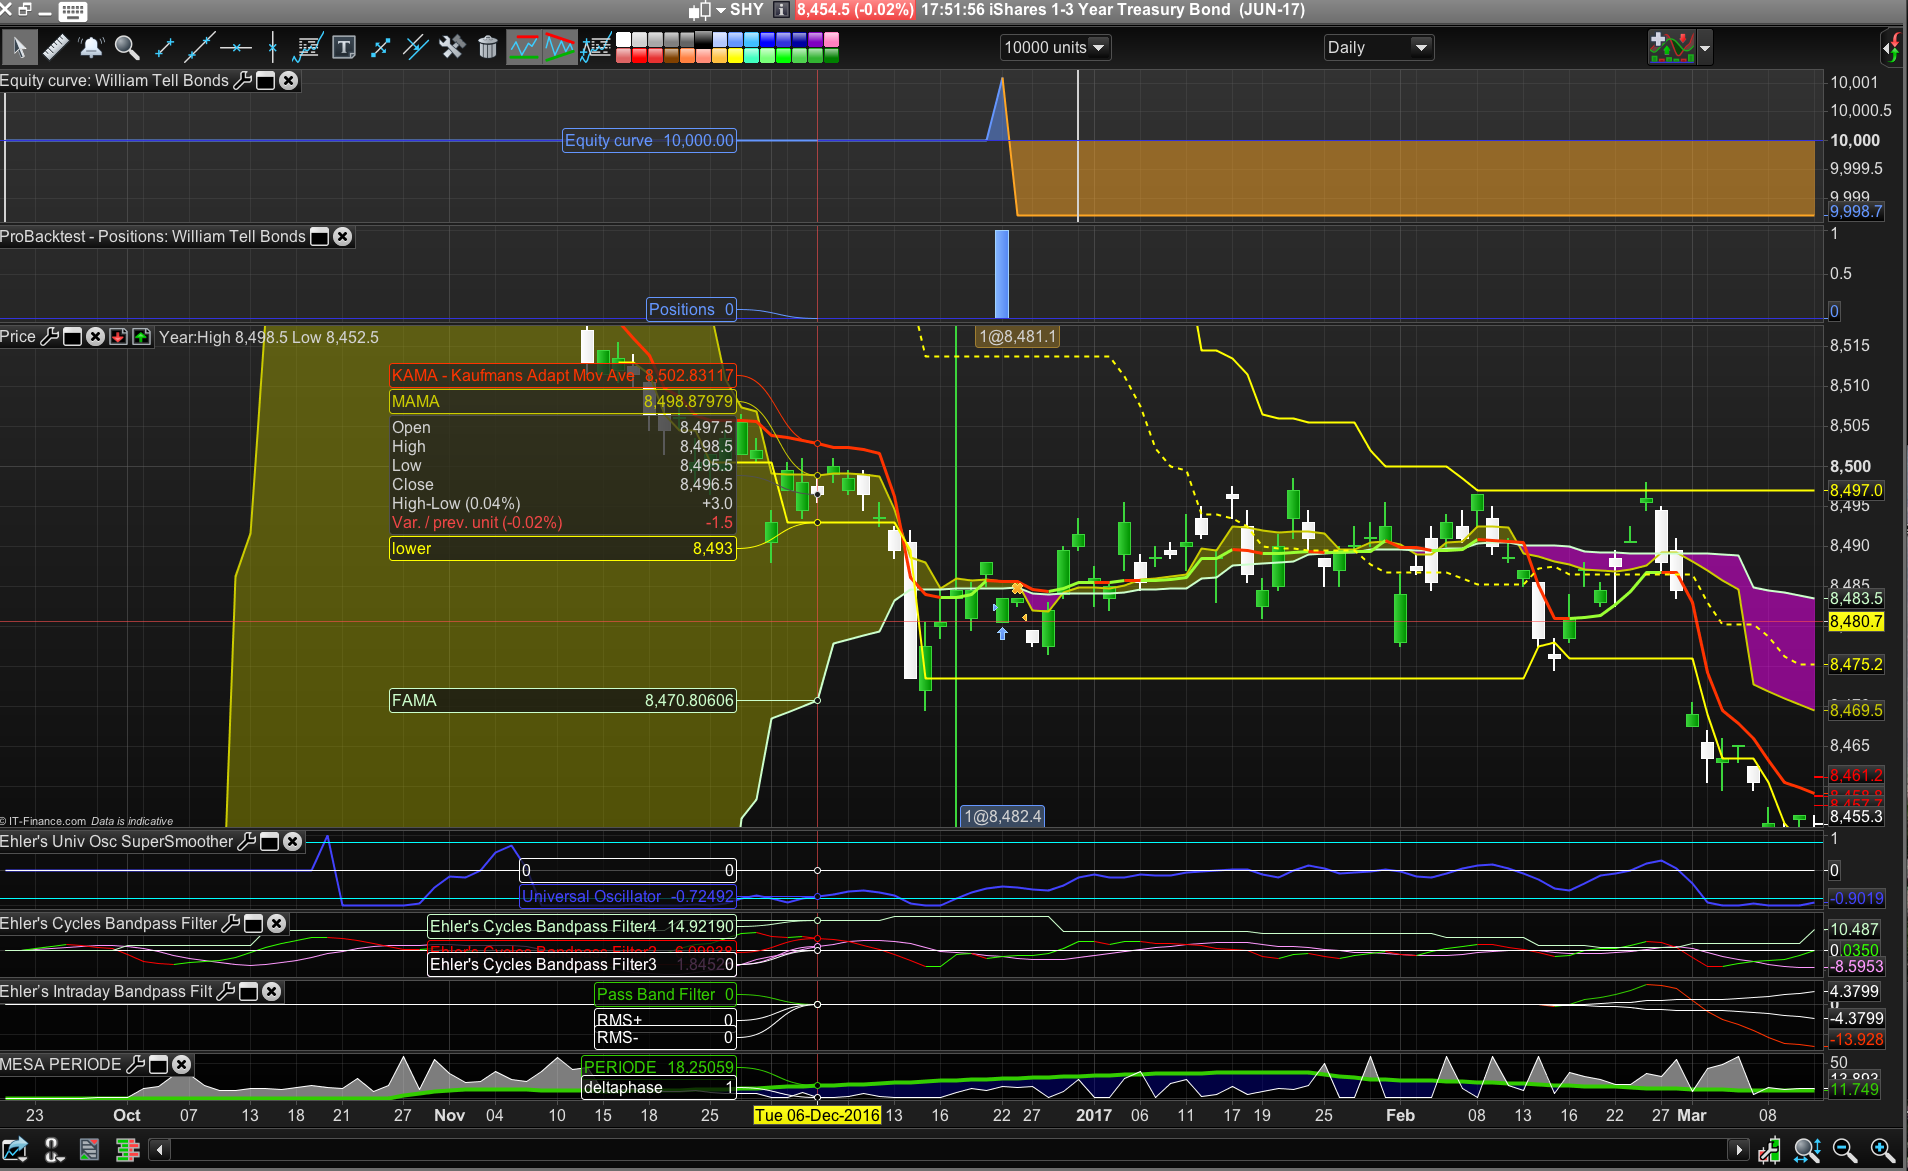
I tried it on ishares 1-3 yr Treasuries and I don’t see the insidebar or gap conditions being fulfilled?
i.e. I don’t understand why it traded where it did, as I don’t see an inside day two days before the entry day or a gap up the day before entry, however I do see one 9 candles back (white candle) from the wide green doji/vertical spike line (6th Dec) but no trade was taken? Please see screenshot.
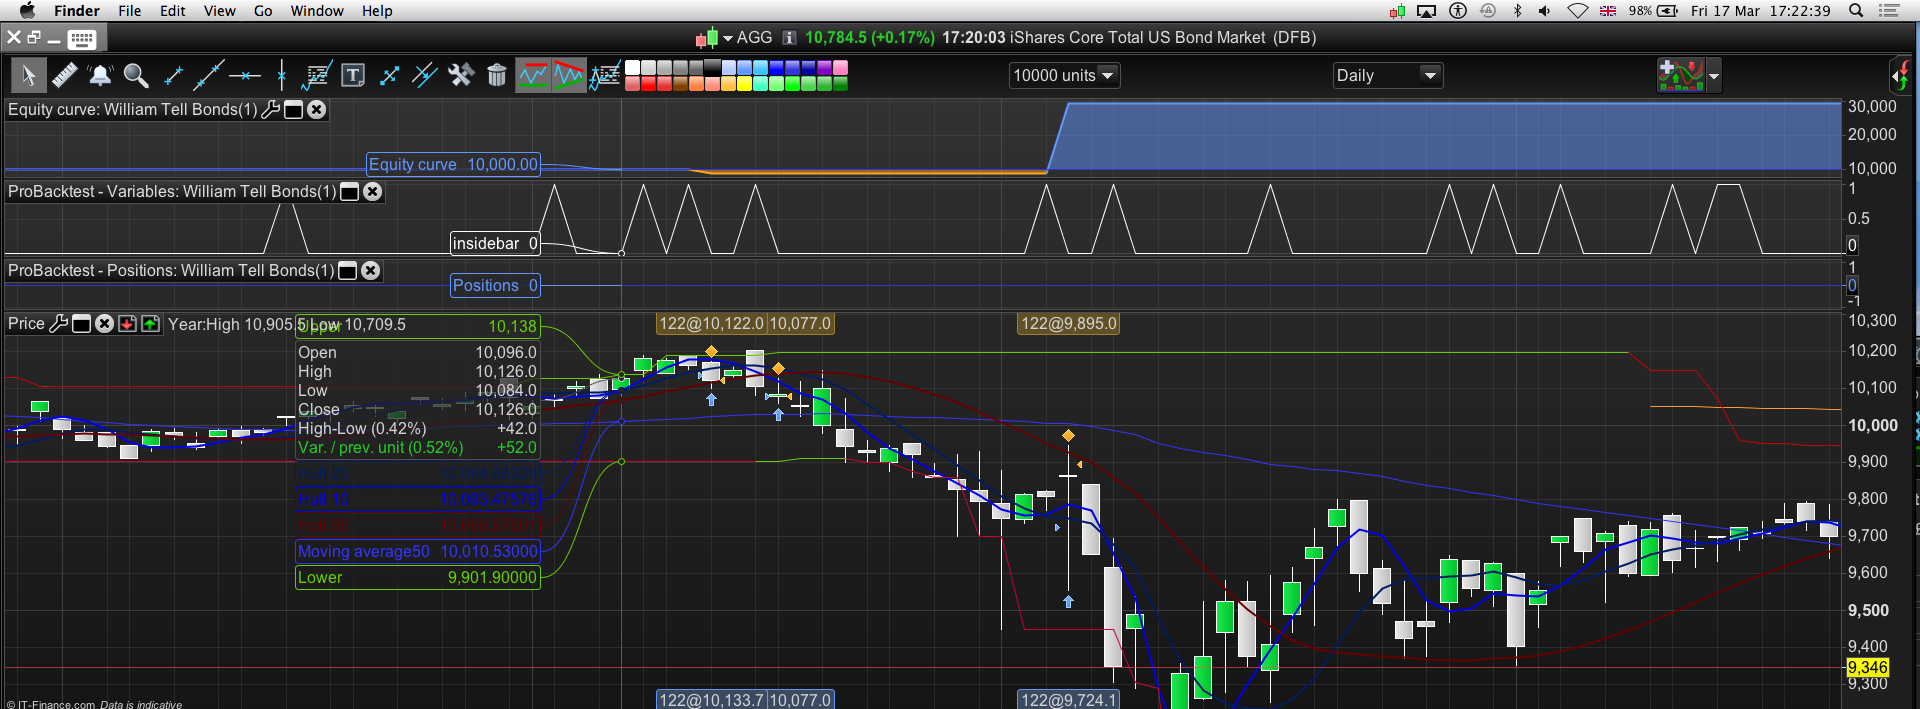
Also do you know why there is only Sept 2016 to Dec 2016 daily data available? (It made one trade with profit of £300 on £10k capital)
Lastly I wondered how you would change the Exit from the ‘first profitable opening’ to either a set amount of tics (gained) or a % profit target eg 1.5%?
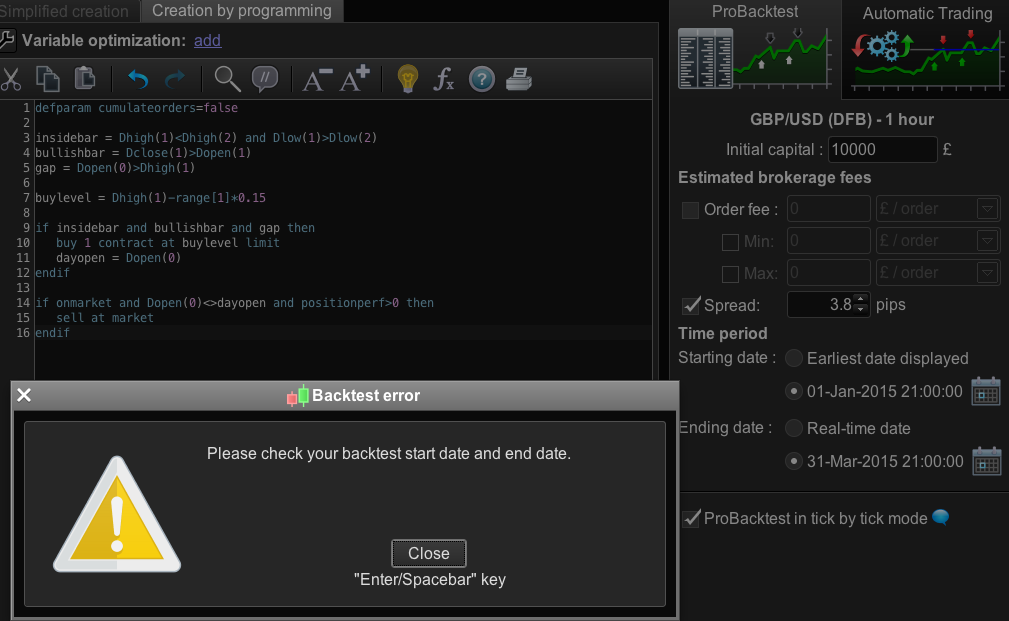
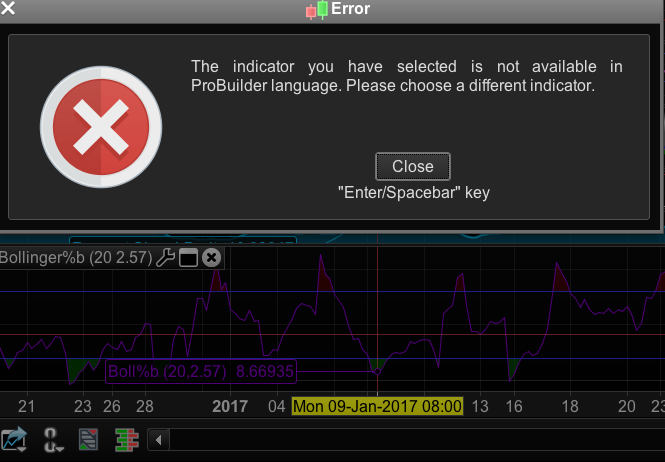
p.s. I am getting a lot of failed attempts when I change date ranges since using the new V10.3 Backtest date ranges window? Please see screenshot.
Is there going to be Pro Buildler code for the Bollinger B Indicator? Pls see screenshot.
Thanks a lot,
BardParticipant
Master
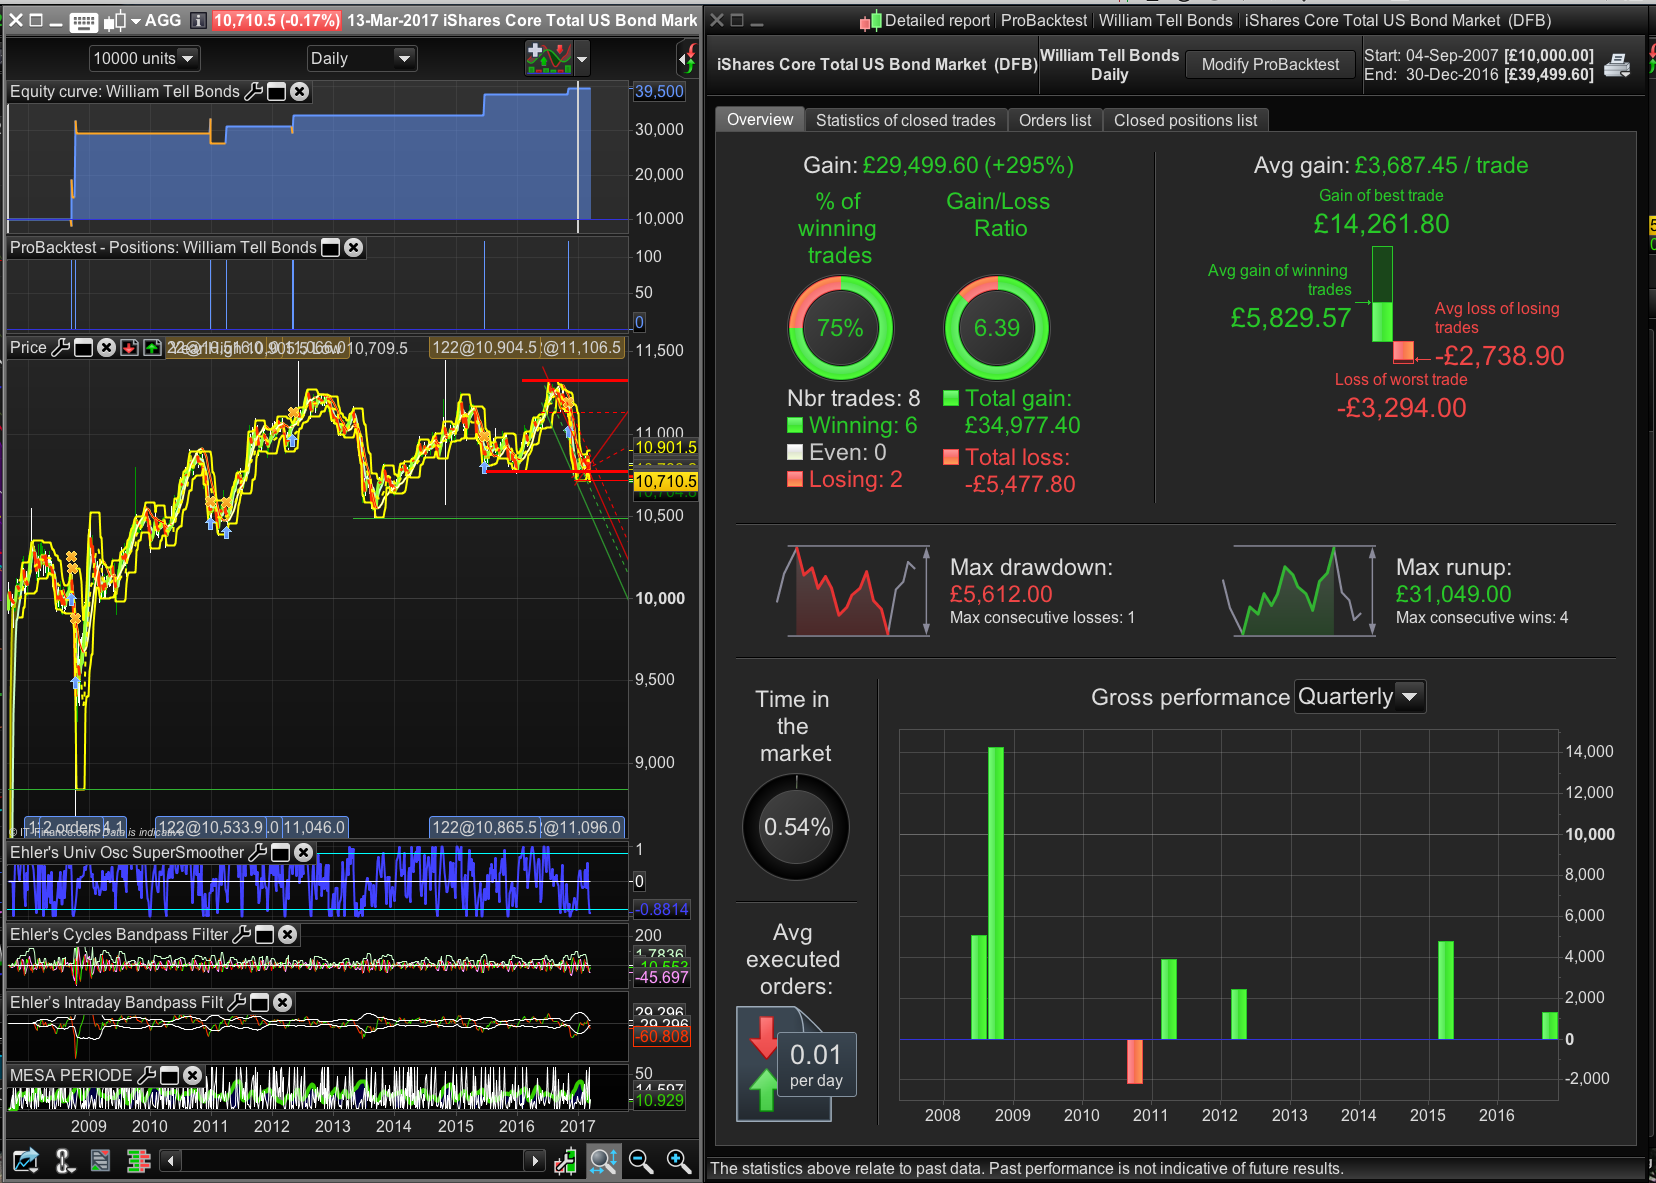
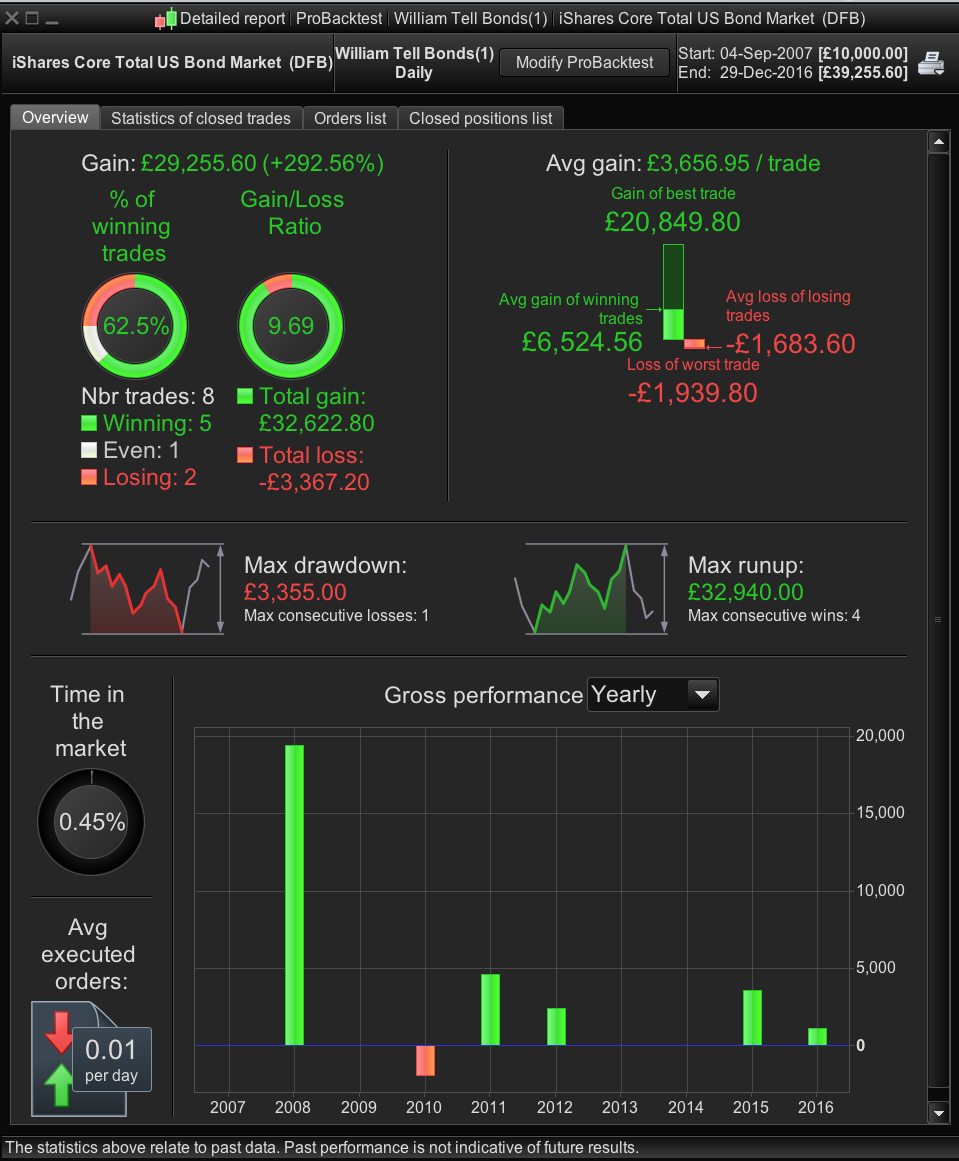
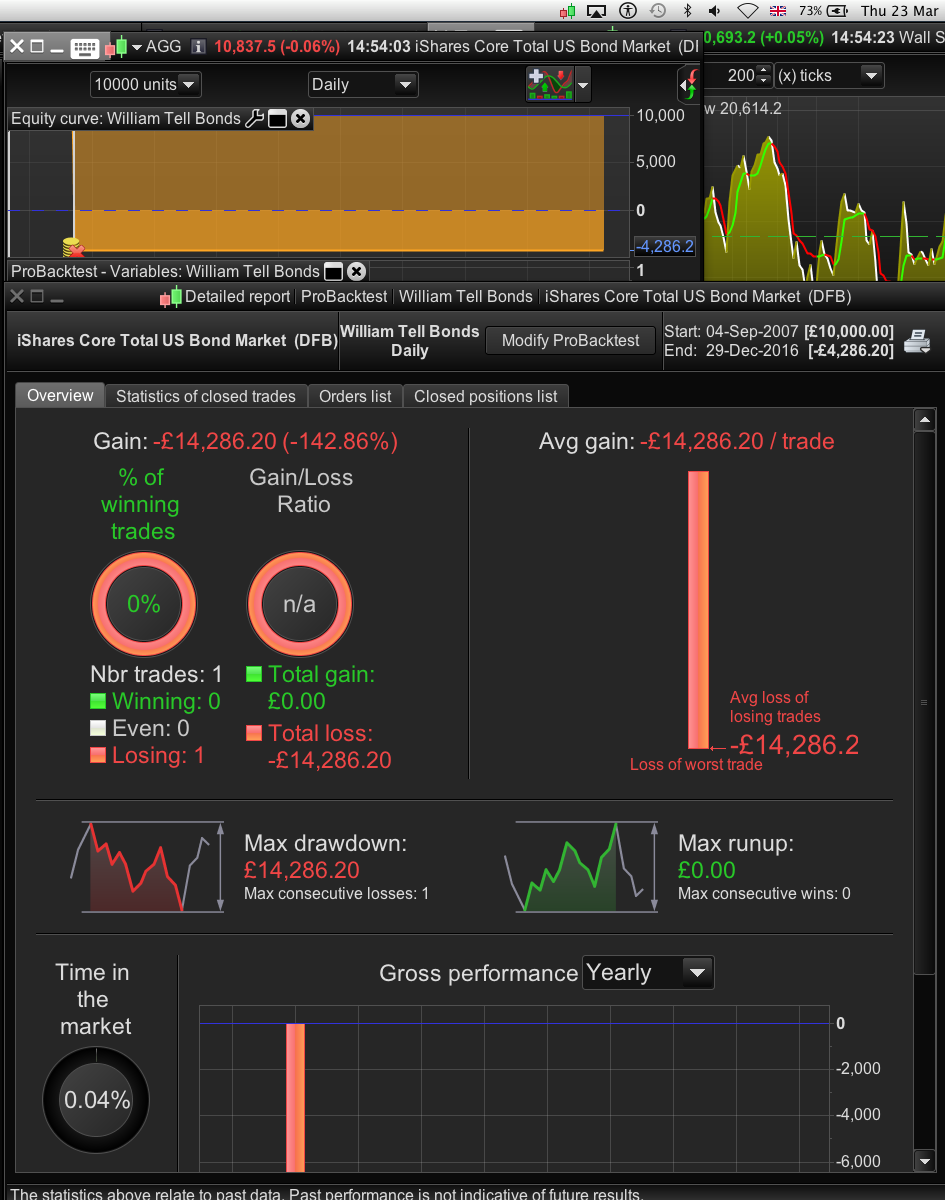
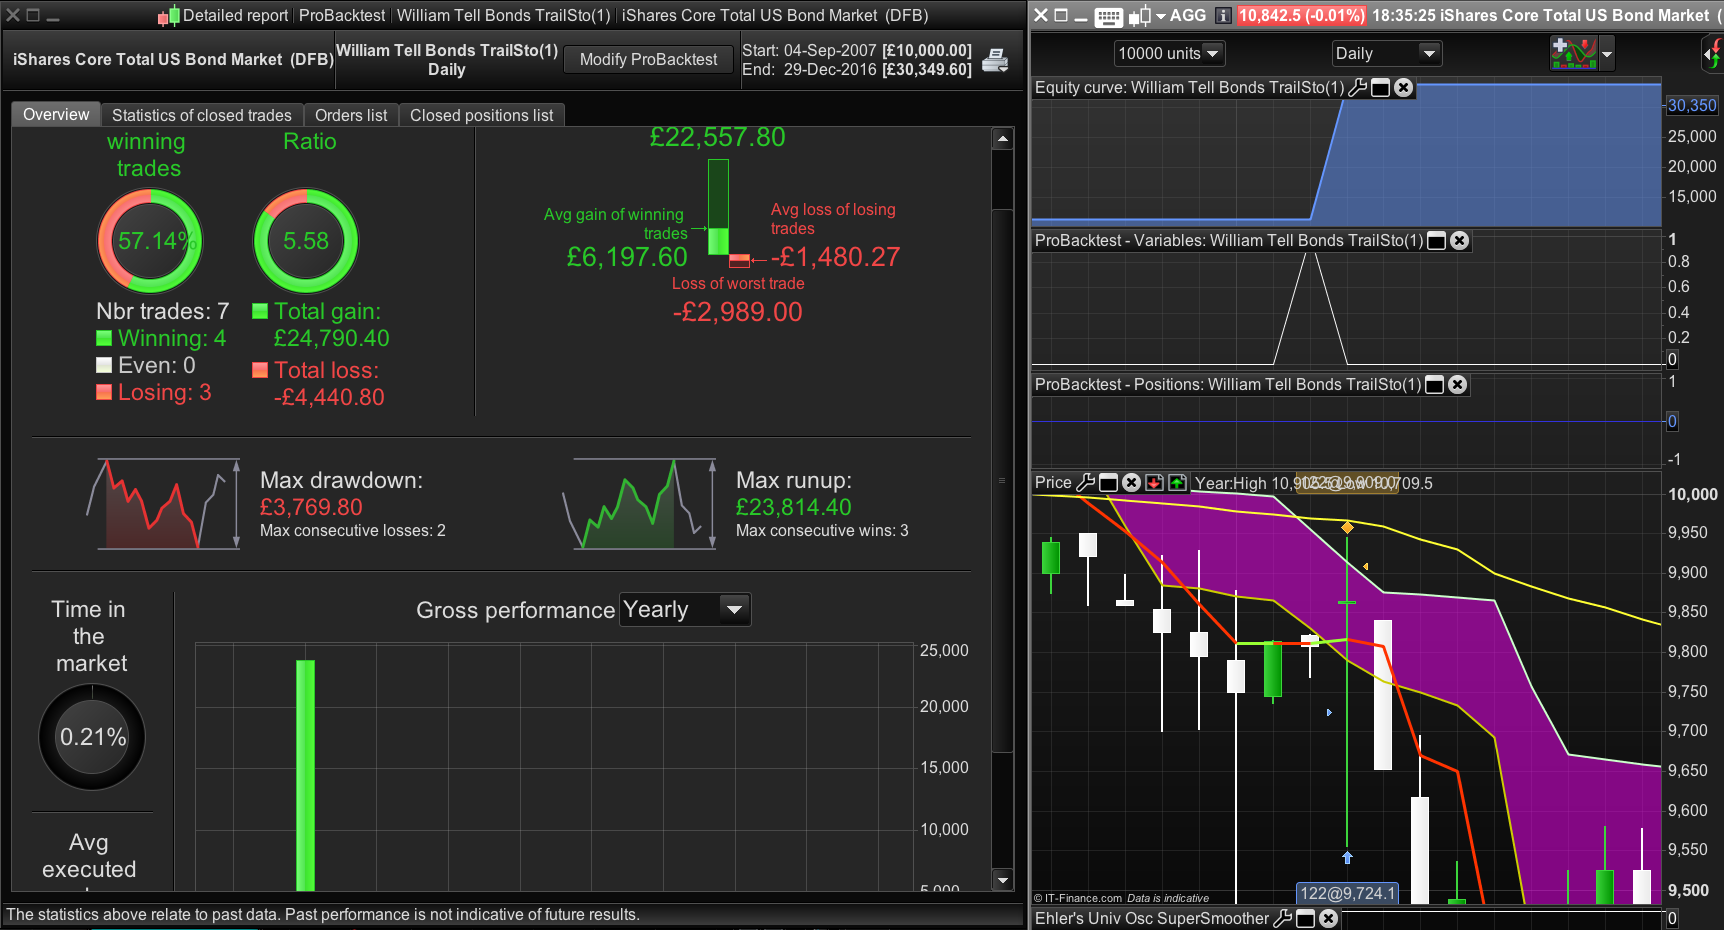
Profitable Results: pls see screenshot
Winning % = 75
Gain Loss 6.4
Drawdown 17%
This was achieved by changing the Buy from DHigh to DLow (so slight bit of curve fitting) and only 8 trades instead of the 30 needed to prove some form of significance/robustness.
Also when losses come along they can be very high from my testing other bonds (ishare 1-3 yr and ishare 20yr +) and also according to Earik Beann’s results – image above.
You would need to find other entry patterns that can be combined in this system or used along side to mitigate large Drawdwon periods (diversification).
Speaking of which: This is the most statistically significant chart pattern according to expert (and author) Thomas Bulkowski’s research and I’m wondering if it can be coded as I didn’t see it in that really good candlestick patterns post by Ciccio?
High and Tight Flag:
Thanks once again. I’m still working on the Ehler’s indicators and the Empirical mode. I think however that optimisation of indicator parameters could be a slippery slope, even with Walk Forward — once you go back and alter a parameter to improve the system the WF data, the data is in effect “burnt” (curve fitted) and effectively becomes an in sample data set. Beanne draws this conclusion (and other developers I’ve chatted to:
If your test period was 10 years (out of 40 yrs) of in sample data , then the system will break down on average after 4 to 5 years on out of sample data. Has that been your experience Nicolas?I’ve figured out Randy Stuckey’s Catscan II (his last version was IV), from a book I have (Joe Krutsinger). He tested Catscan I and II from 1983 to 1993 and then out of sample on pre 1983 prices and post 1994 prices. Since it’s release in 1994 it was ranked as the #1 T-Bond system in the world, ditto Crude Oil, Cotton and Coffee. He uses a Donchain Breakout combined with Volatility Break outs and that Choppiness Indicator you kindly converted. Should I post the rules (and results) to the forum to see if it can be coded?
If you have sorted out the bugs you talked about in your first reply, please post your full code for future reference.
About the other system, sure, please open a new thread if you’re able to! Brad… Oh Bard sorry 🙂
BardParticipant
Master
Okay will post Catscan II System.
Do you know why the William Tell Bonds system is trading when it’s not an inside day? (pls see my first reply #28453) and also
what does this symbol mean: <>? Dopen(0) <> dayopen… Normally it’s less than and greater than).
Is is possible to get more than 3 months of past data on the ishare treasury bonds (1 to 3 yr and the 20 yr+)? The only alternative is the Total Core Bond Mkt DFB which goes back to 2008 – as per screenshot.
Lastly I wondered how you would change the William Tell T-Bond system’s Exit from the ‘first profitable opening’ to either a set amount of tics (gained) or a % profit target eg 1.5%?
Thanks Nicholas, sorry I mean Nicolas!
BardParticipant
Master
p.s. Where do I post this William Tell Bonds system, assuming you correctly diagnose if it is trading correctly on the “inside days” Entry condition?
I just found the General Discussion Forum which should be suitable… although I can only edit this post but I wanted to delete it, but can’t?
<> mean “different from”. I use this formula to detect if the current day is different from the day the trade was open, to close the order if in profit only.
The insidebar code is the good one. I’m detecting a lot of them on a daily timeframe.
Please add
GRAPH insidebar
at the end of code to see their signals while backtesting.
Since this strategy don’t have any stoploss, once you are on market, you need to take a profit before a new trade could be launched. Maybe that’s why you don’t see as many ‘inside bar’ as you would?
If the strategy is ok, it could be post as a new library code for everyone’s benefit.
BardParticipant
Master
I think because inside days occur often, that the other part of the Entry conditions aren’t met therefore it doesn’t trade on all inside days.
The “Graph inside” indicator for Inside days also is early sometimes by two bars? (I believe it is designed to register on the bar straight after an inside day).
I still see this “Graph inside” indicator giving incorrect readings when no inside day has occurred eg 2nd Dec 2015 or the 7th and 8th of July 2015?
Also on the 18th June 2015 it exits on the same day as it enters but the rules are to Exit on first profitable NEXT day open. Therefore maybe the rule:
“if onmarket and Dopen(0)<>dayopen and positionperf>0 then
sell at market
doesn’t quite match the original designer Earik Beann’s intentions, no? (It was designed and achieved a 95% win rate accuracy).
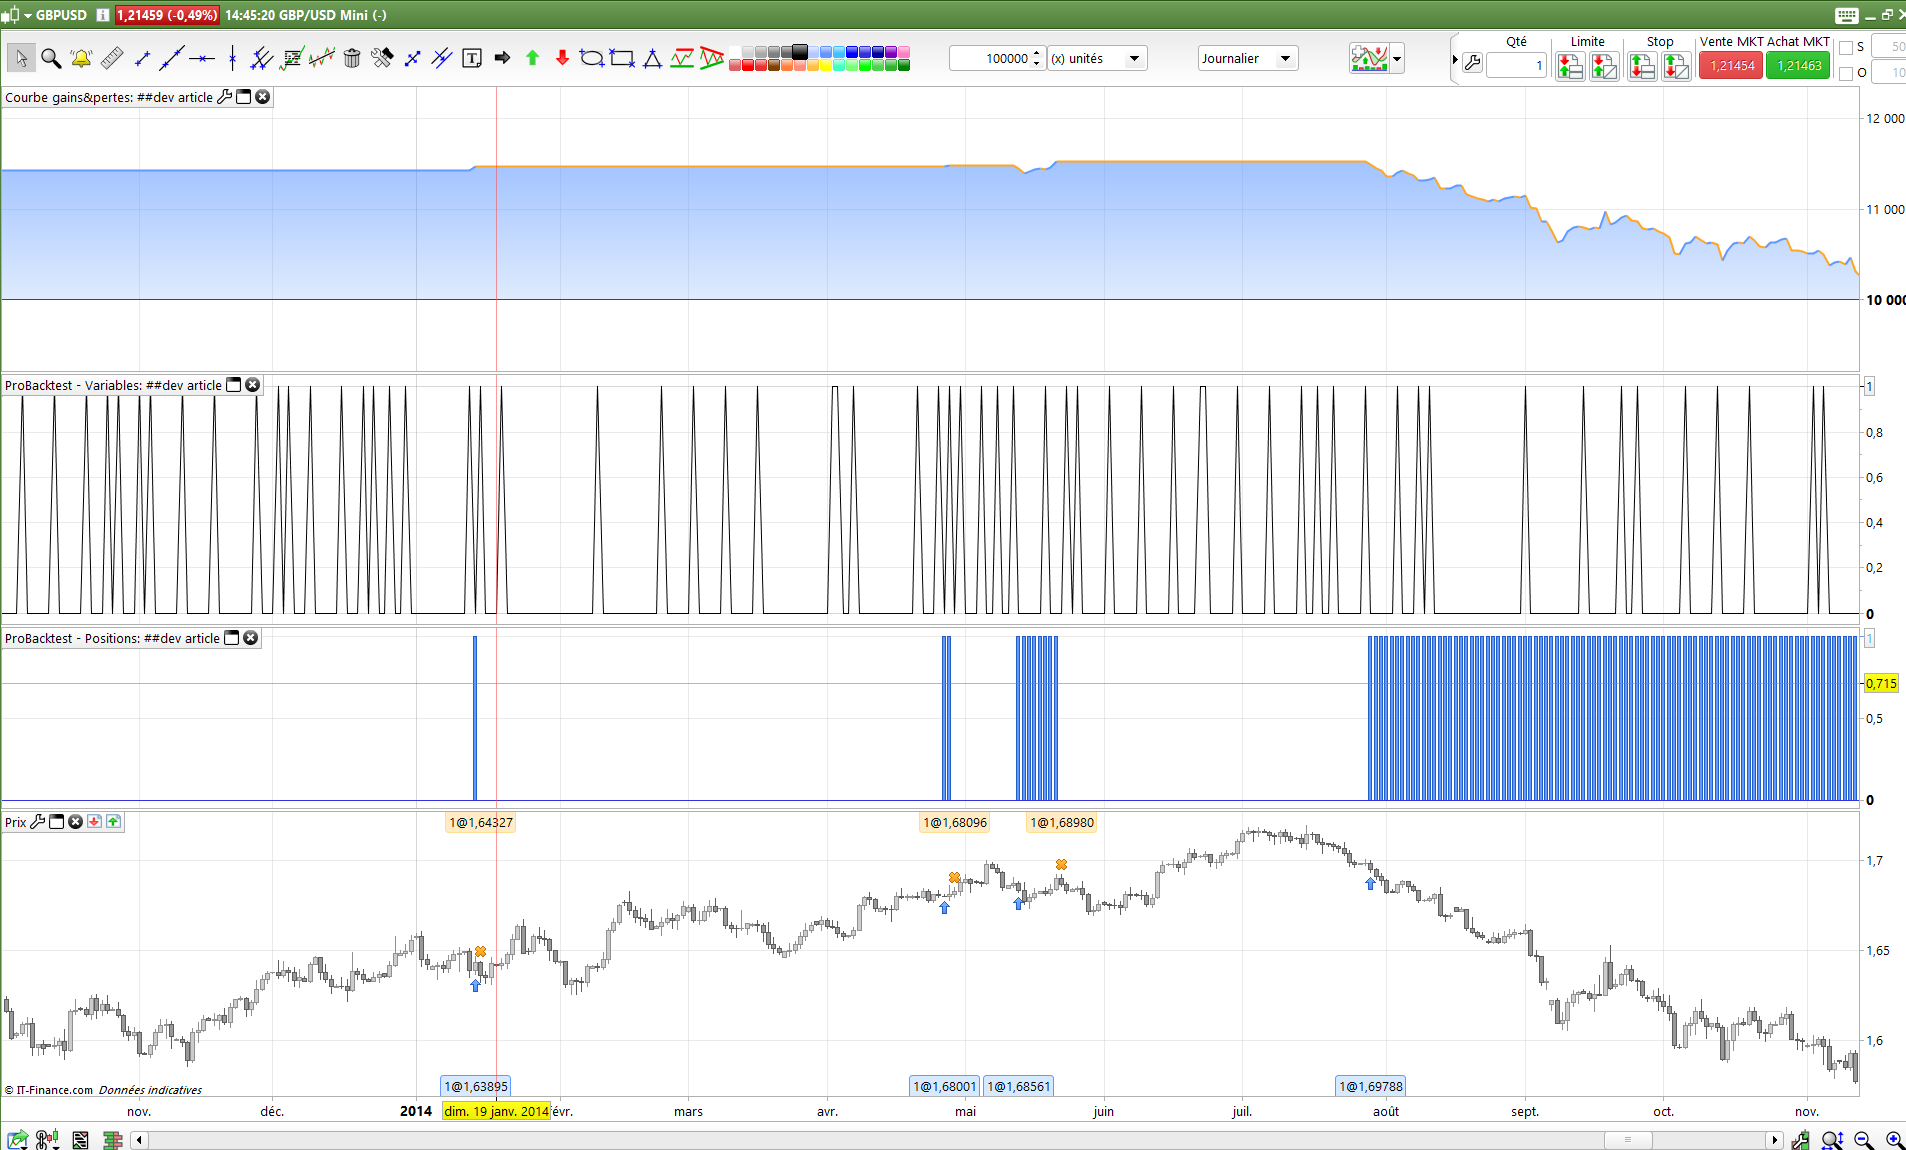
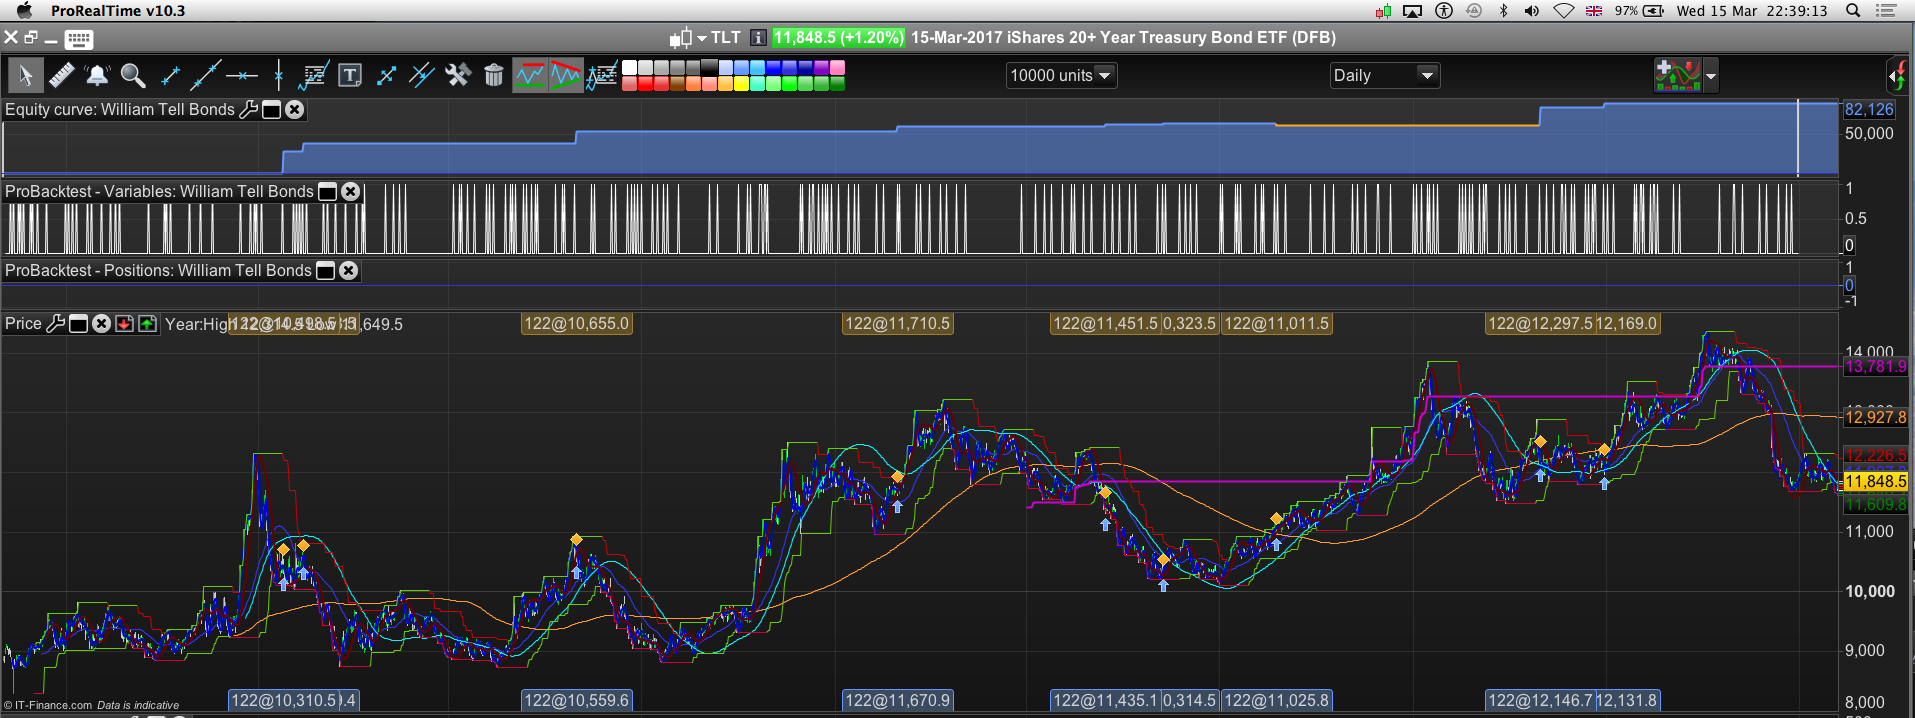
The images show when I switched to the ishare 20+yr (from the ishare Core Total US Bond) and added a 50 tic Trailing Stop because as it wasn’t profitable without a Stop and the trades are entered when the Entry rules don’t appear to have been met? But because PRT isn’t able do tick by tick all the way back to 2007 (other vendors/platforms can like my Trading Blox s/ware so I’m not sure PRT can’t?) you have to question whether the Trailing Stop would produce the same result with live candlesticks going forward on live data. Maybe not judging by these results and a 3% drawdown, what do you think?:
Defparam Cumulateorders=false

insidebar = Dhigh(1)<Dhigh(2) and Dlow(1)>Dlow(2)
bullishbar = Dclose(1)>Dopen(1)
gap = Dopen(0)>Dhigh(1)

buylevel = Dlow(1)-range[1]*0.15

if insidebar and bullishbar and gap then
buy 122 contract at buylevel limit
dayopen = Dopen(0)
endif

if onmarket and Dopen(0)<>dayopen and positionperf>0 then
sell at market
endif

GRAPH insidebar

SET STOP pTRAILING 50.0
Interesting article on tick by tick results and slippage from the ever informative Jez Liberty at Au. Try. Sy:
http://www.automated-trading-system.com/slippage-backtesting-realistic/
Well, I coded it too fast. Because it’s a pending limit order, we never known when the order will be triggered. I think we’d better use the tradeindex instead of the daily open to check the closure condition:
Defparam Cumulateorders=false

insidebar = Dhigh(1)<Dhigh(2) and Dlow(1)>Dlow(2)
bullishbar = Dclose(1)>Dopen(1)
gap = Dopen(0)>Dhigh(1)

buylevel = Dlow(1)-range[1]*0.15

if insidebar and bullishbar and gap then
buy 122 contract at buylevel limit
endif

if onmarket and barindex>tradeindex and positionperf>0 then
sell at market
endif

GRAPH insidebar

SET STOP pTRAILING 50.0
To be clear about the trade condition:
1/yesterday was an inside bar
2/yesterday was a bullish bar
3/ got a bullish gap today
These 3 conditions are checked at Close and the pending limit order is then put on market the next day (so 2 days after the inside bar)
Are we ok with this description?
BardParticipant
Master
Thanks very much for recoding it. The description looks good:
1/yesterday was an inside bar (lower high and higher low than yesterday)
2/yesterday was a bullish bar (yesterdays close is above yesterdays open)
3/ got a bullish gap today (if todays open gaps above yesterdays high)
The £ gain is about the same as Post: #28465 above, but it has a lower win % although higher gain/loss and lower drawdown (8%). Pls see screen
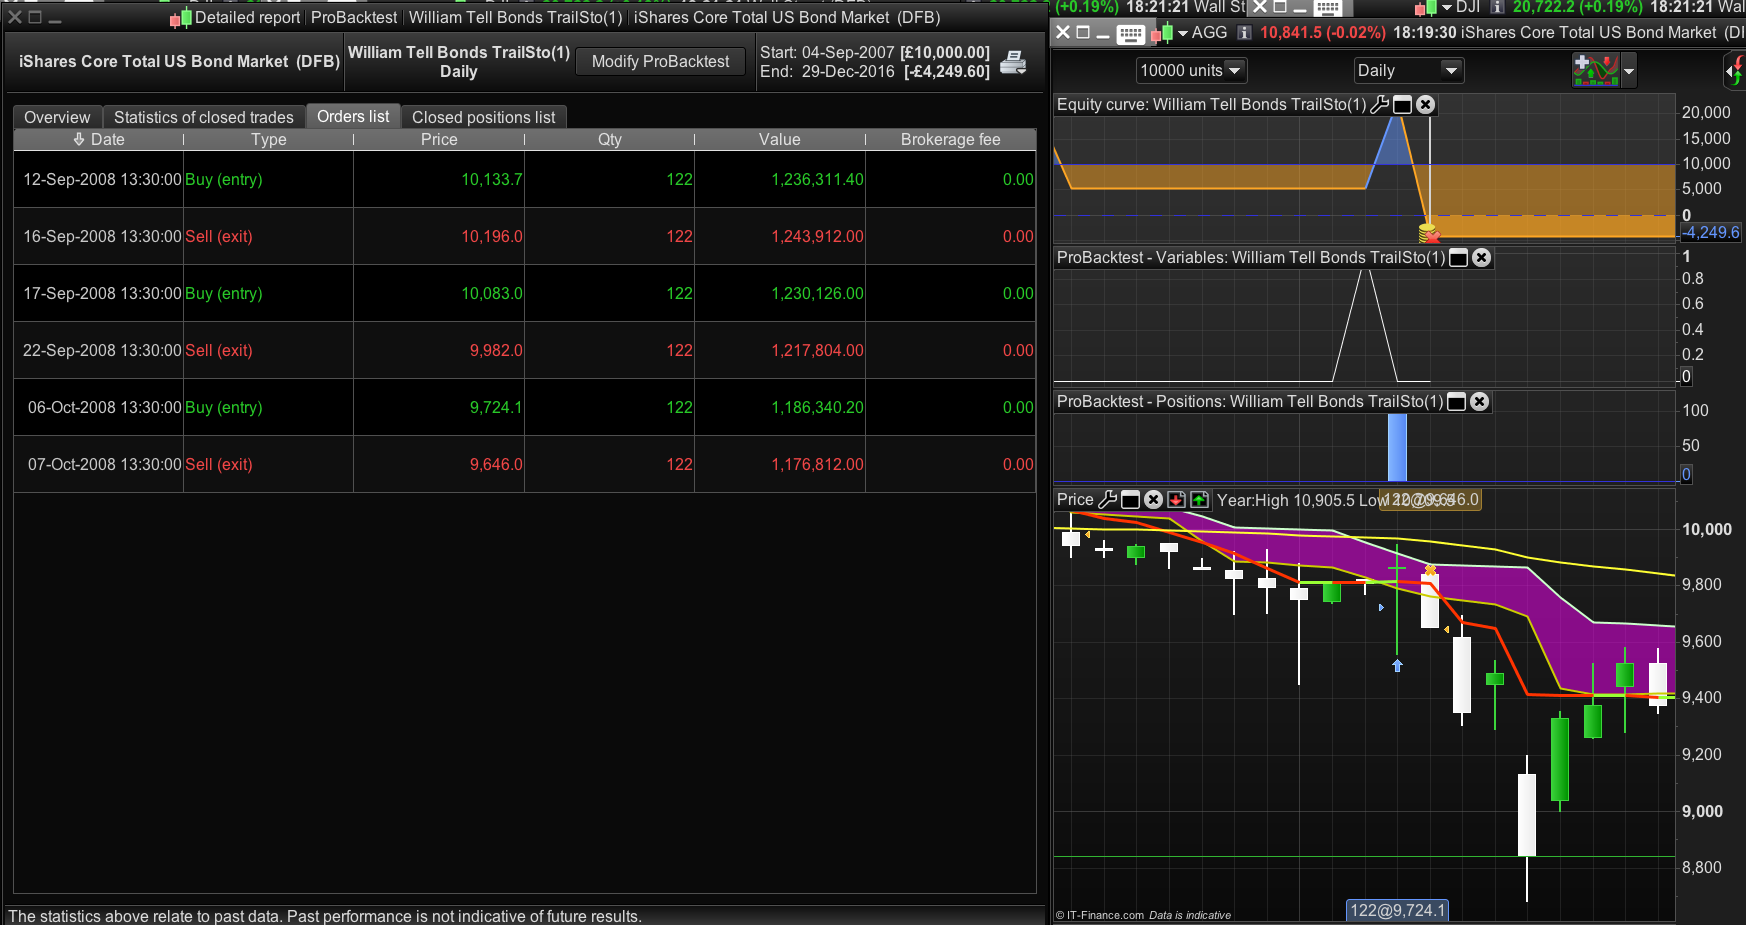
However, unless I am missing something, it still appears to trade when there is no inside days or if there is an inside day, it trades a few bars later but without all conditions fulfilled? – pls see screen:
TRADES:
A) On the very first trade I don’t see a (rule #3) bullish gap? (i.e. if todays open gaps above yesterdays high)?
B) On the second trade the inside bar is fulfilled (squeezed between the two white down candles) but where is condition #2) and a bullish bar (i.e. yesterdays close is above yesterdays open)?
C) Not even sure where the inside day was for that trade?
Do you trust the results using a 50 tic trailing stop in a backtest – the third (C) trade looks accurate but I’m still wondering if you use a NON trailing points Stop, if the system won’t just compare a next day open with a previous close and if the gap was less than 50 tics continue the trade even though the previous bar could have had a big swing range WITHIN the bar and should really have been stopped out?
Do you know if it’s possible for PRT / IG to be able to provide more tick by tick data here (my backtests always warn I have to turn the tick by tick off) and in other Forex mkts like the £/$? Can an external data service/vendor be used?
Cheers Nicolas,
Bard
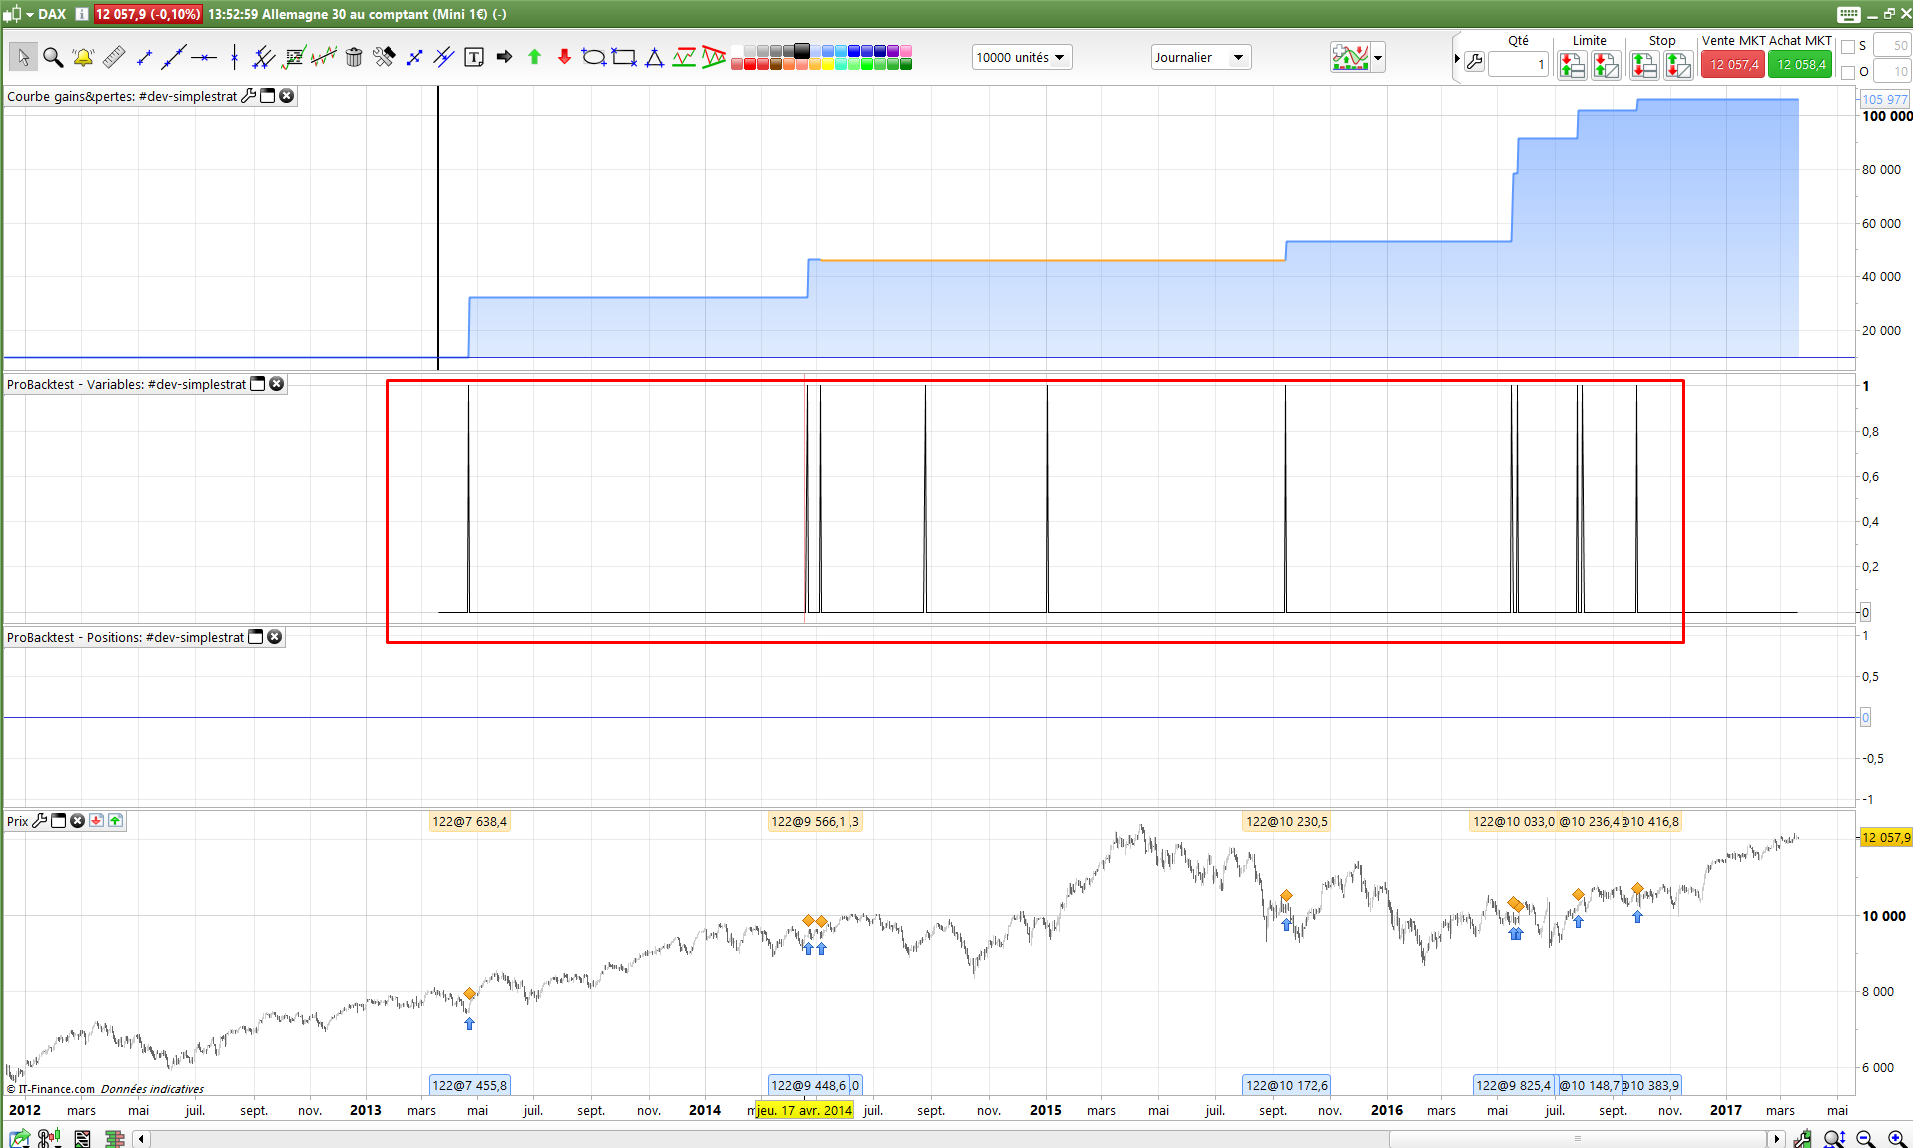
This modified version will graph when all conditions are met to launch a new trade, this way you’ll be able to verify how and when they are fulfilled. Much better to debug the strategy I believe!
Defparam Cumulateorders=false

insidebar = Dhigh(1)<Dhigh(2) and Dlow(1)>Dlow(2)
bullishbar = Dclose(1)>Dopen(1)
gap = Dopen(0)>Dhigh(1)

buylevel = Dlow(1)-range[1]*0.15

golong = insidebar and bullishbar and gap

if golong then
buy 122 contract at buylevel limit
endif

if onmarket and barindex>tradeindex and positionperf>0 then
sell at market
endif

GRAPH golong

SET STOP pTRAILING 50.0
About the trailing function, as you may know, it is still in debugging at PRT to be perfectly compliant with how IG are dealing with it in live trading.
BardParticipant
Master
Hi Nicolas,
Thanks for the new graphing code. I haven’t had much opportunity to use it as I have been trying to figure why I’m getting inconsistent results with the original code William Tell Bond code posted above (that doesn’t have the correct exit).
I have got different profit results using this same auto system backtest in the same session on the same instrument (iShare 20+yr Core Total US Bond Mkt EFT ) (This has happened before using other systems I have been looking into).
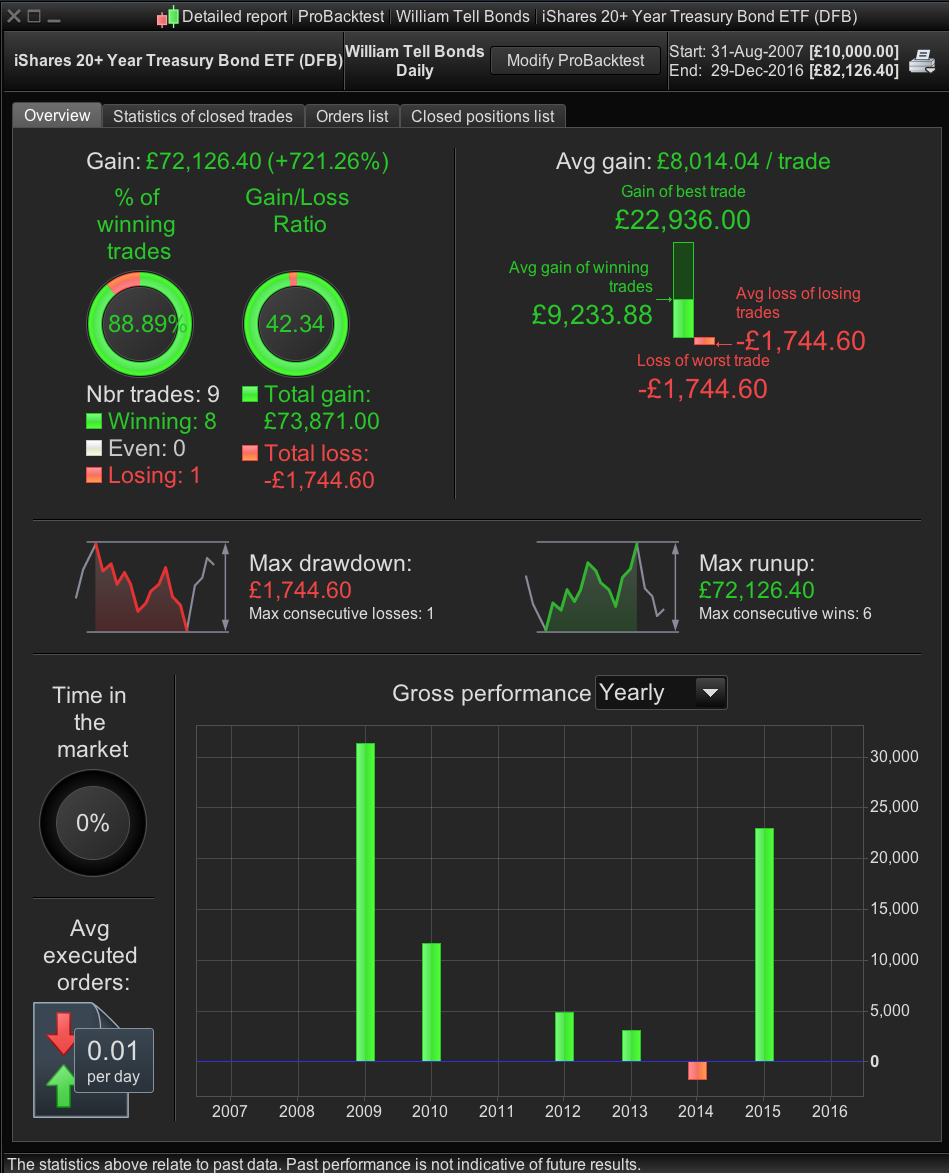
William Tell Bonds had previously produced the results in post #28465 above (6 winners out of 8 and £29k profit). It produced that profit this afternoon. I tried the system on the iShare 20+yr Treasury Bond EFT and went back to the Core Bond market and now it only takes 1 (losing) trade instead of 8 and makes a-£14,286 loss?
It’s the same original system! No code was changed after that initial altering of the high to low (line 7). I have been duplicating the systems and creating new names as I added each new bit of code you have posted above (for graphing the trades). I have tried rebooting the who PRT platform but the result is still stuck at -£14286 and the dates are identical (minus one day for the end date)?
The current Exit rule is to sell at market. Is there a way for it to Sell at the Open of the next day?
If you haven’t modified the backtest period or the spread, you should get the same results. I do not have any further explanations about this weird behaviour sorry .. This kind of thing deserve a support ticket if you are sure you are not implied in this error.
BardParticipant
Master
Okay I will raise a ticket. Just to clarify the current exit rule is to “Sell at Market” and that it is selling on the first profitable Opening? Only, the screenshot shows the trade did not exit at the profitable open but instead took a loss because it sold at the low of that same white candle? i.e. it should have been exiting where that orange x is with a profit.
Cheers for the help.
Defparam Cumulateorders=false

insidebar = Dhigh(1)<Dhigh(2) and Dlow(1)>Dlow(2)
bullishbar = Dclose(1)>Dopen(1)
gap = Dopen(0)>Dhigh(1)

buylevel = Dlow(1)-range[1]*0.15

golong = insidebar and bullishbar and gap

if golong then
buy 122 contract at buylevel limit
endif

if onmarket and barindex>tradeindex and positionperf>0 then
sell at market
endif

GRAPH golong
Also I don’t know understand why this 6th Oct 20018 trade is being placed when the bullish day condition is not met (it’s a white candle) and the system incorrectly trades the next candle? Please see screenshot #2
If the Bonds are quoted in US dollars then how do you keep the number of shares fixed to the £/$ Exchange rate? A few days ago when making the system the rate was £1 – $1.22. Now today it should have really bought 125 shares?