Hello everybody,
I post here a strategy that I am using with real money.
It uses trend direction (slope) of the 20 periods moving average and the price momentum.
Orders are then triggered once the RSI 20 periods enter in overbought and oversold areas.
Tested with 100k bars: if someone could test it with 200k bars and let me then know the result, this would be many appreciated!!
Best regards.
// Definizione dei parametri del codice

DEFPARAM CumulateOrders = False // Posizioni cumulate disattivate
DEFPARAM FLATBEFORE = 090000
DEFPARAM FLATafter = 175500
indicator1 = RSI[20](close)
c1 = (indicator1 CROSSES OVER 70)
c8=close>average[20]
c65=Momentum[12]>momentum[12][1]
c66=momentum[12][1]>momentum[12][2]
IF c8 and c1 and c65 and c66 THEN
BUY 2 CONTRACT AT MARKET
ENDIF

indicator2 = RSI[20](close)
c2 = (indicator2 CROSSES UNDER 60)
c13= average[20]<average[20][1]
IF  c2  or c13 THEN
SELL AT MARKET
ENDIF

indicator3 = RSI[20](close)
c3 = (indicator3 CROSSES UNDER 30)
c34=close<average[20]
c65=Momentum[12]<momentum[12][1]
c66=momentum[12][1]<momentum[12][2]
IF c3 and c34 and c65 and c66 THEN
SELLSHORT 2 CONTRACT AT MARKET
ENDIF

indicator5 = RSI[20](close)
c5 = (indicator5 CROSSES OVER 40)
c13= average[20]>average[20][1]
IF c5  or c13 THEN
EXITSHORT AT MARKET
ENDIF

SET STOP pLOSS 40
SET TARGET pPROFIT 40
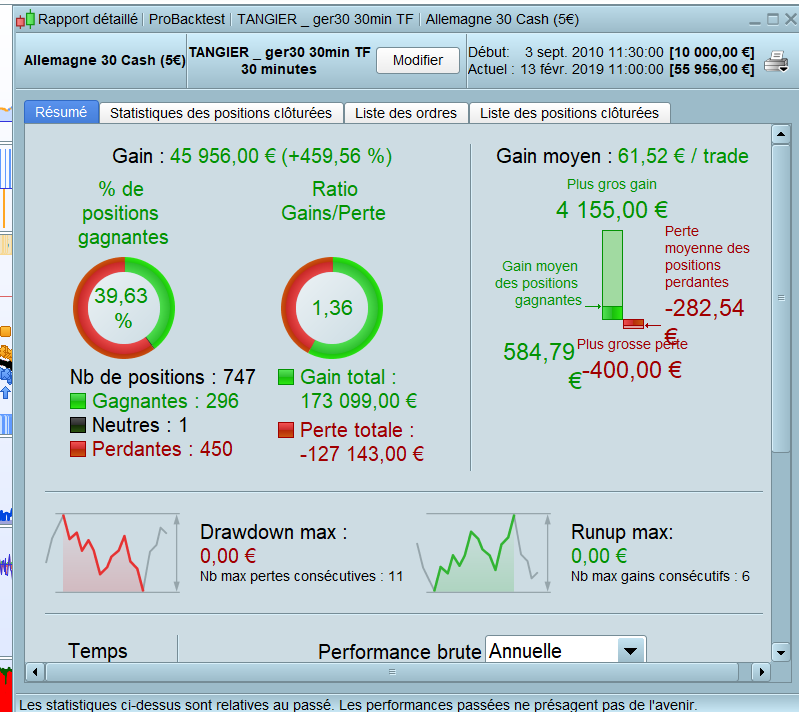
Is the strategy the same than the one you post 2 weeks ago? It is already featured in the library: https://www.prorealcode.com/prorealtime-trading-strategies/tangier-germany30-time-frame-30-minutes/
Hey good! Now we have a discussion Topic for your strategy in the Library
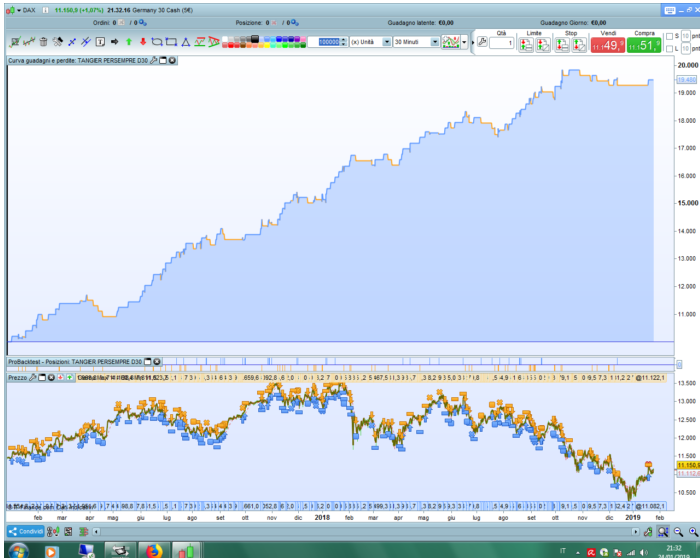
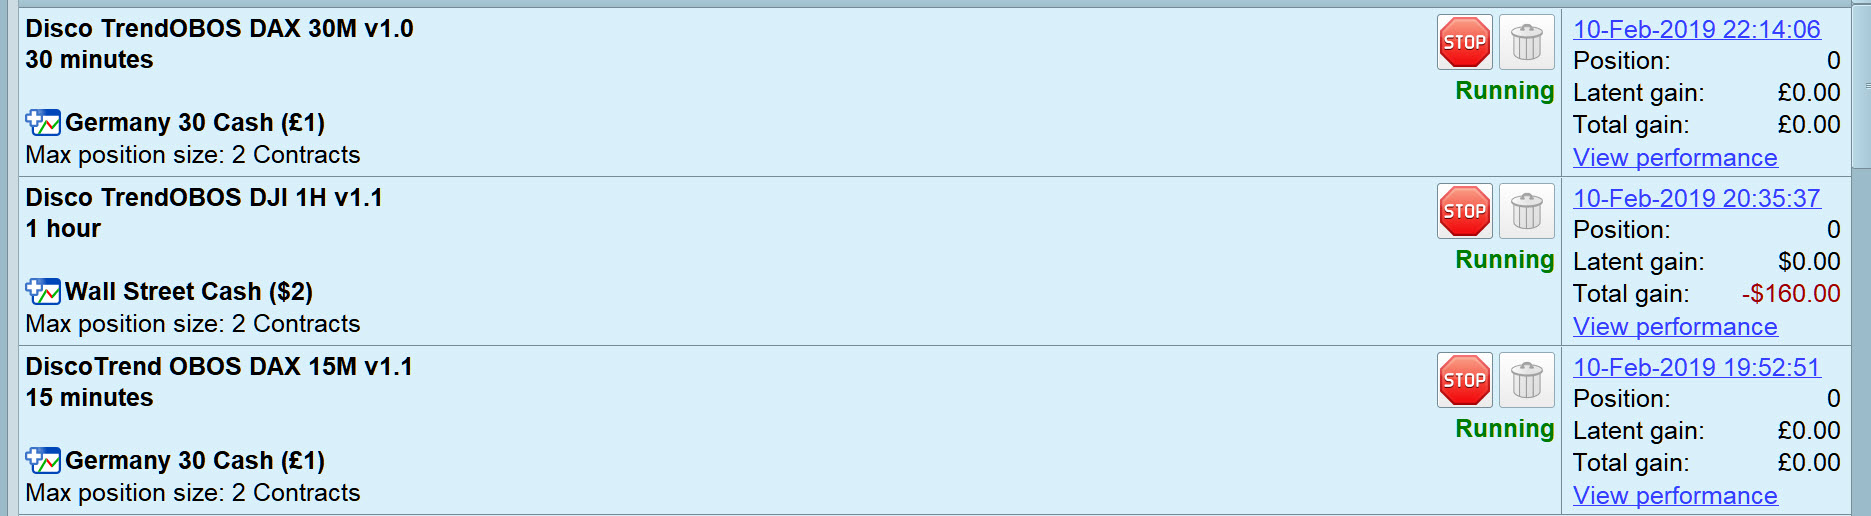
I’ve got 3 versions of your strategy running on Demo Forward Test since 10 Feb 19 … see attached for TF and market.
You have to satisfy my curiosity … why is your strategy described as Tangier (am I missing some trading lingo?? 🙂 )?
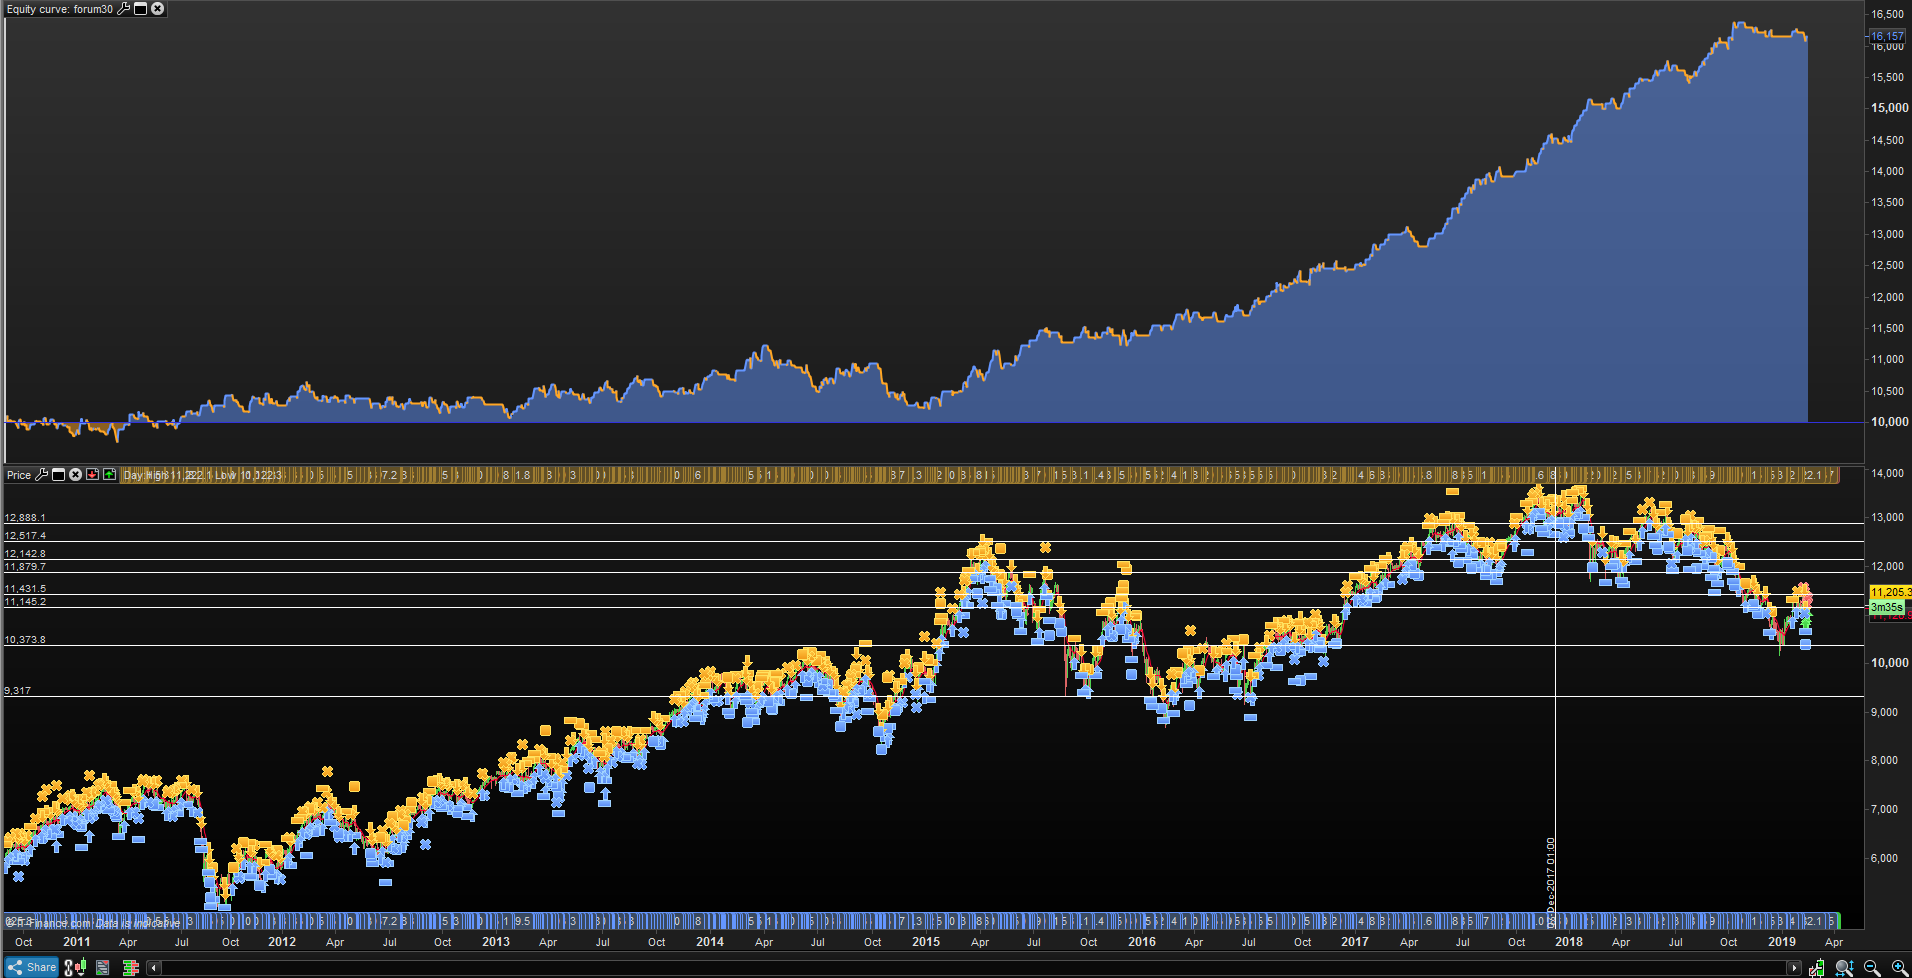
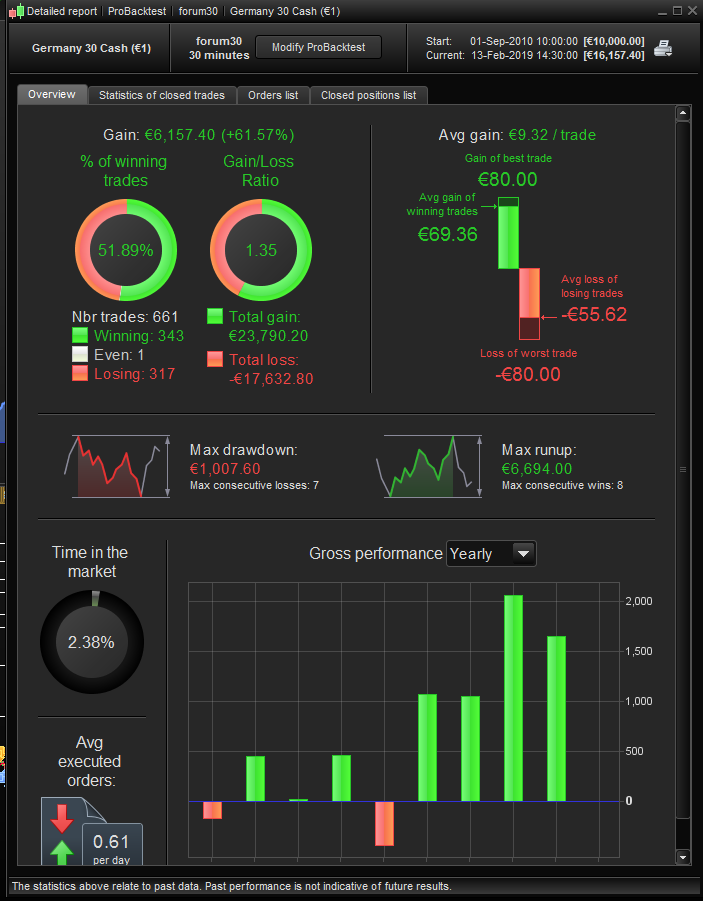
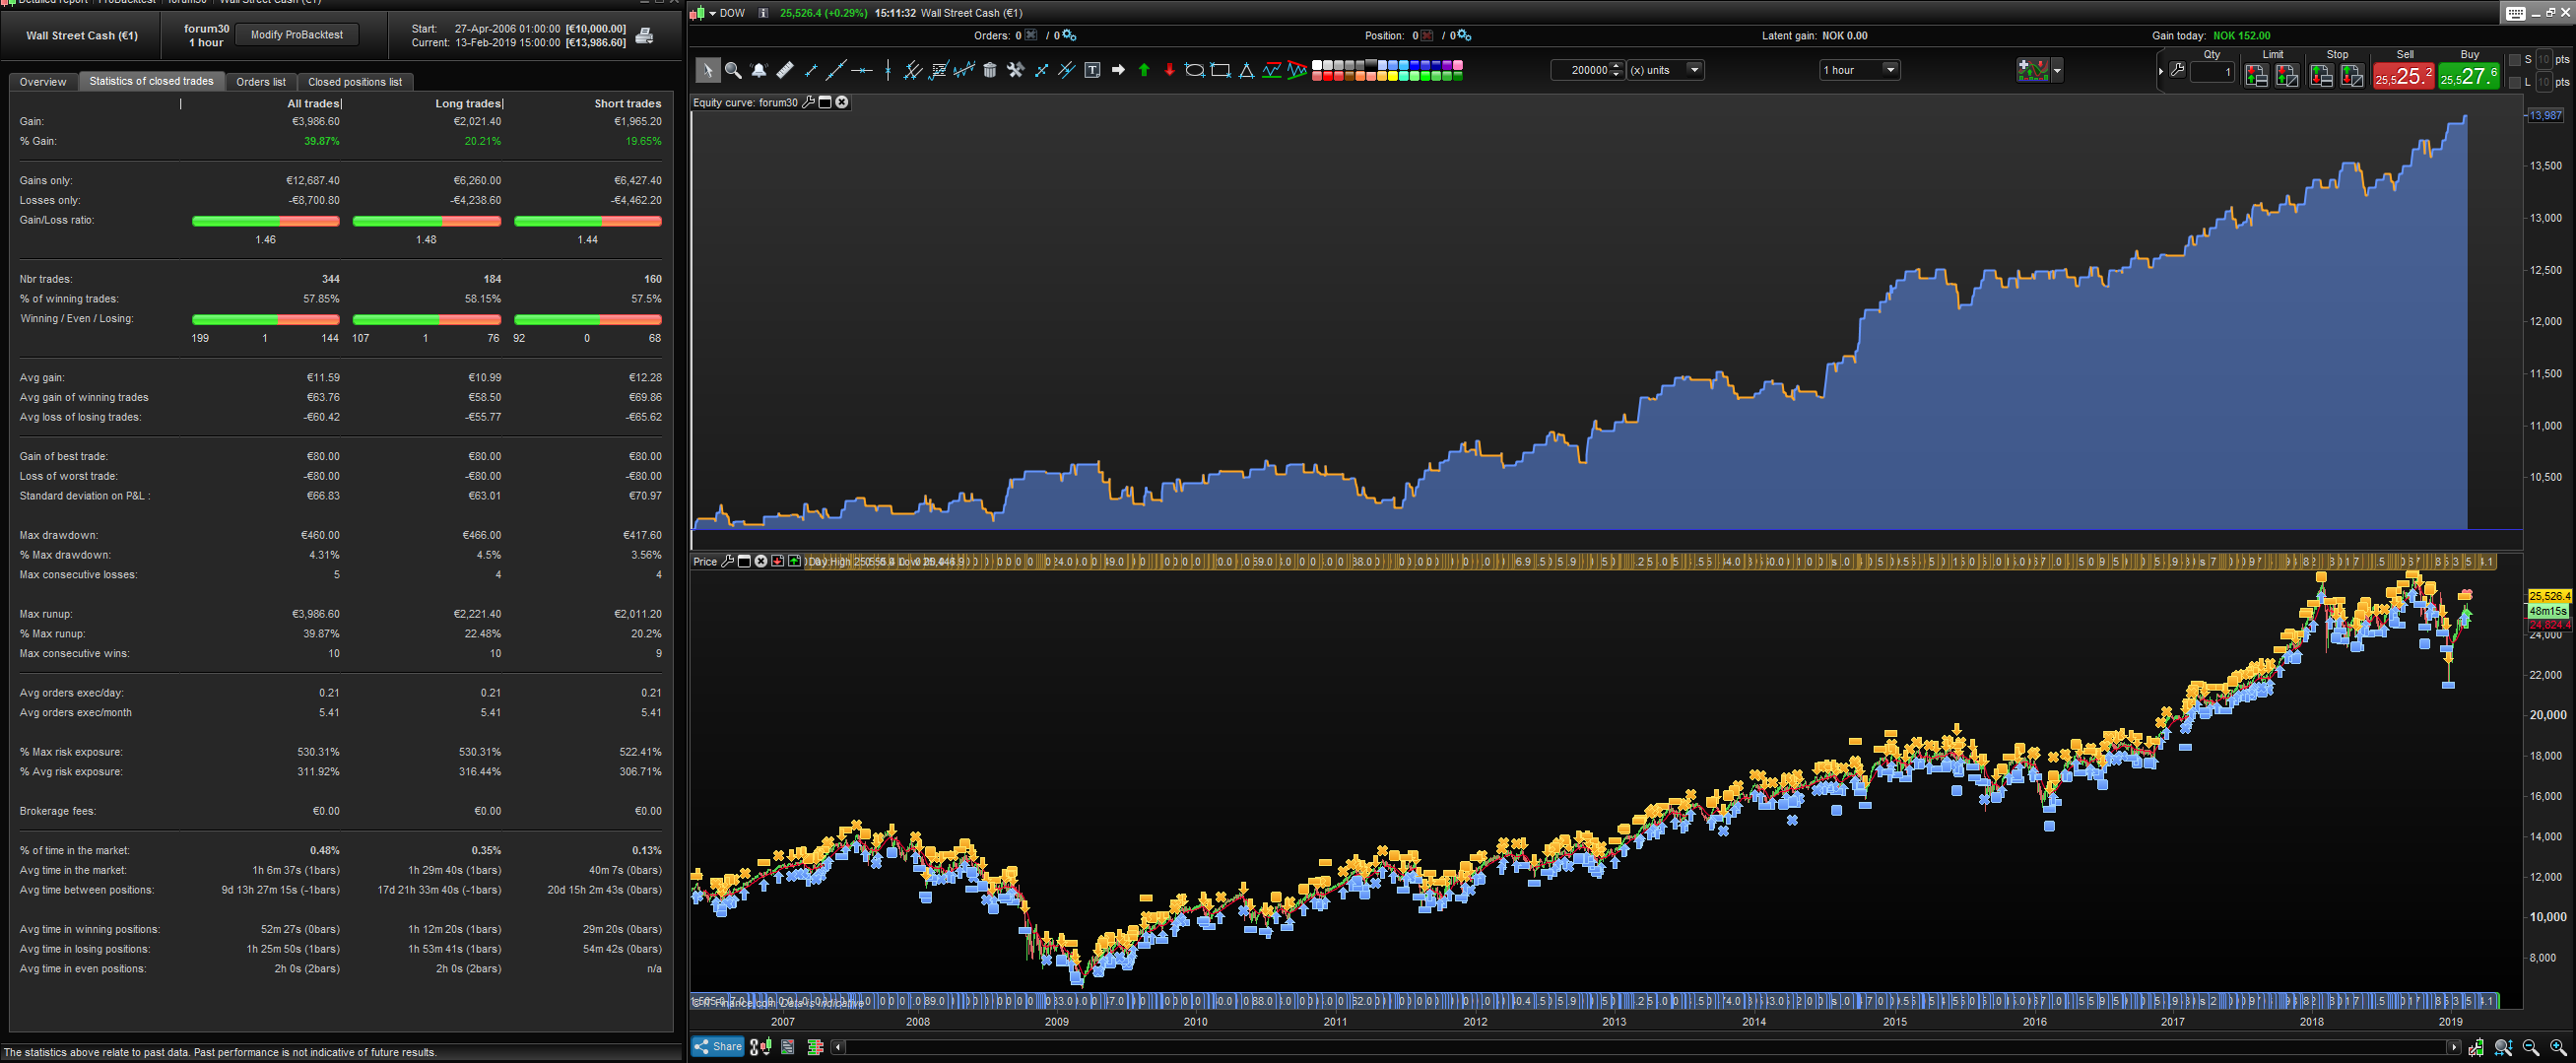
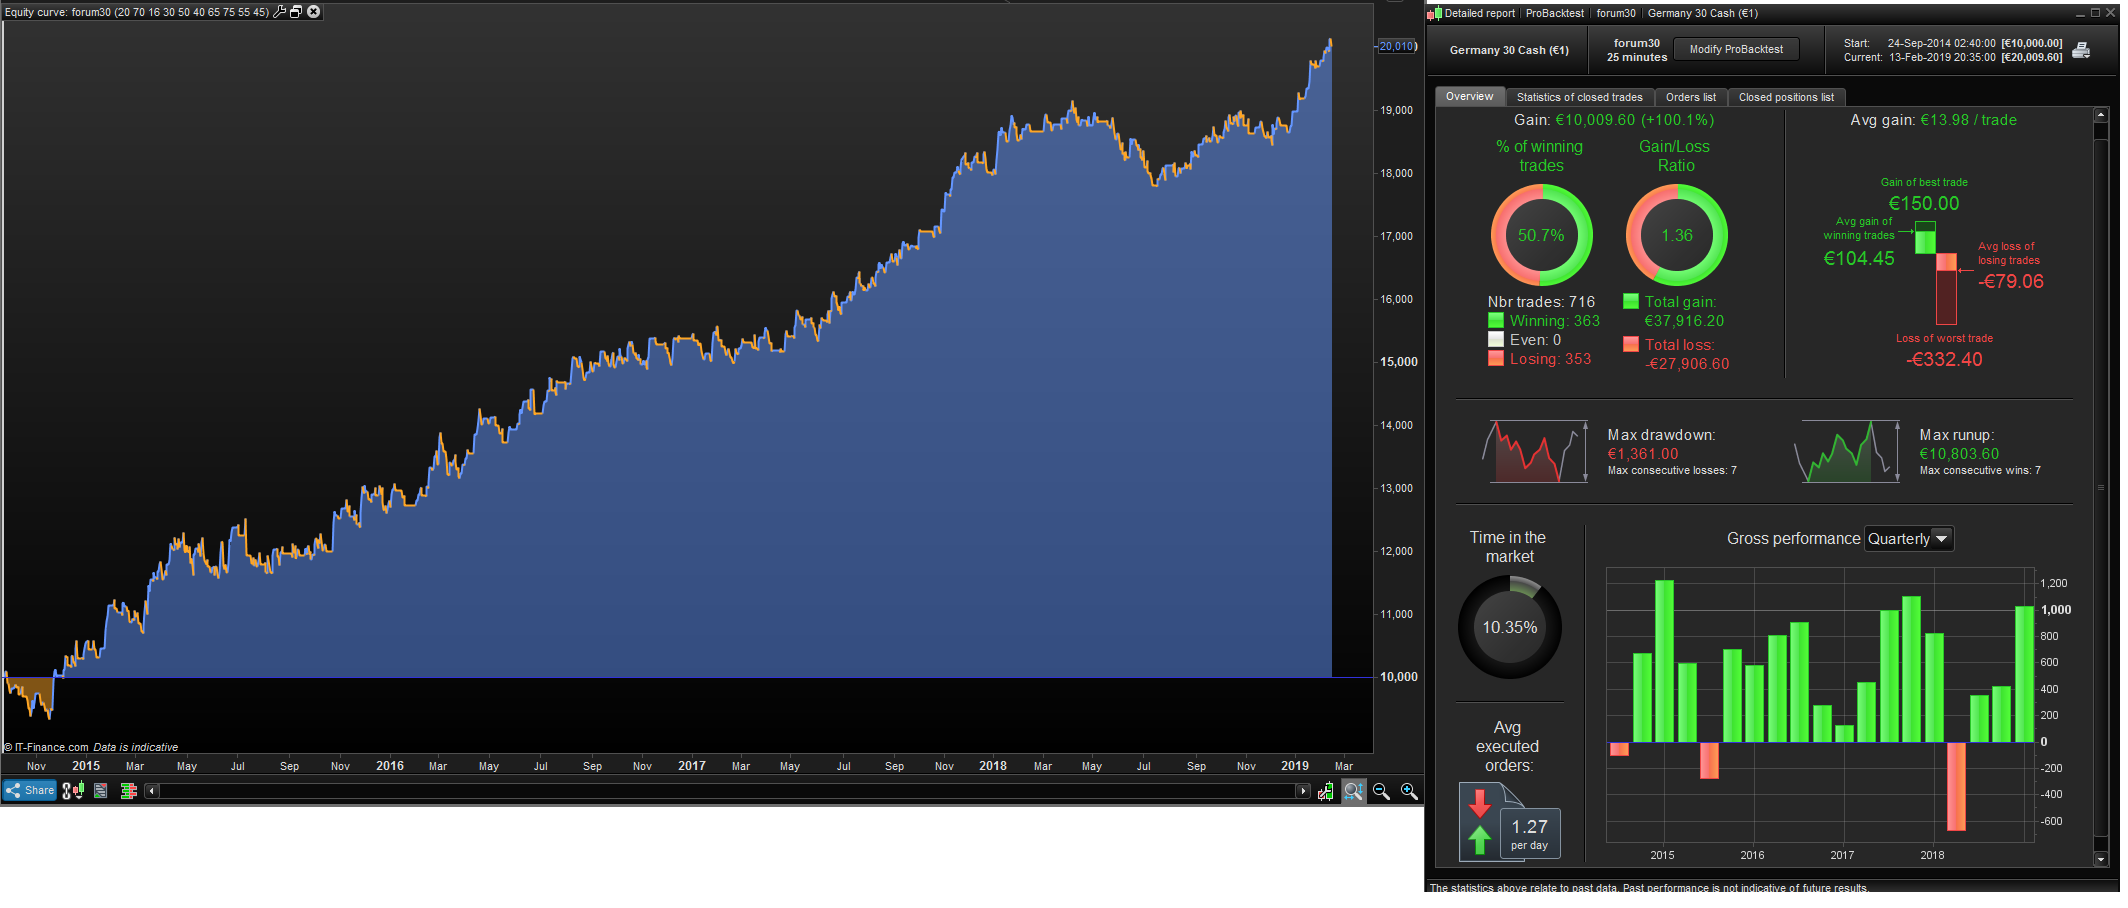
Here is pic of 200K test.
Sadly it looks curved, but it dosnt turn into pure shit either … dosnt look good in other markets tho.. couple of red flags..
Looks interesting in 1h Wall st (no variables changed)
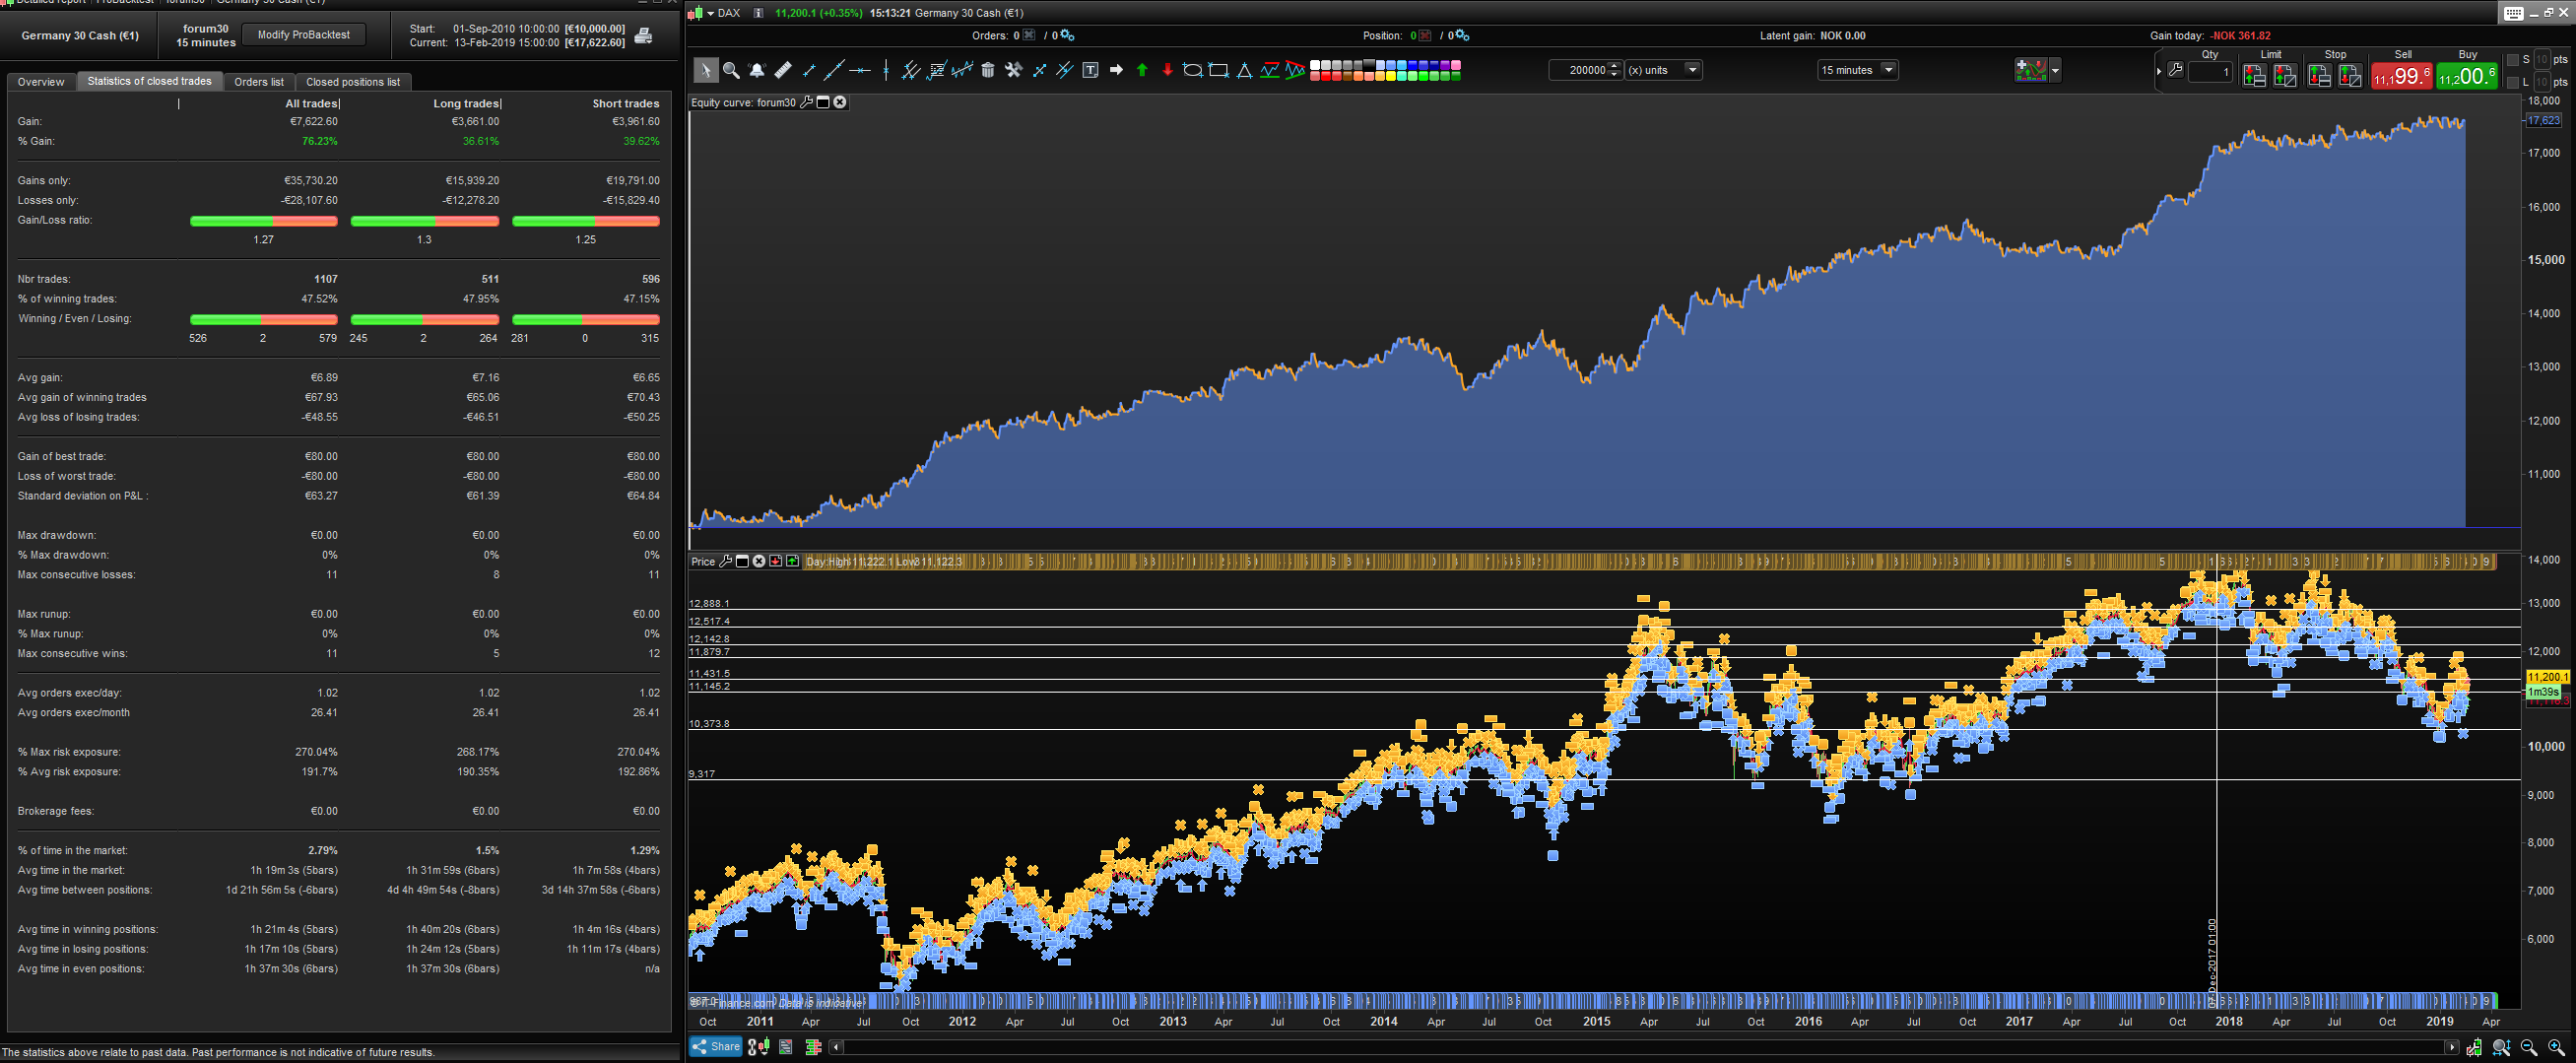
Also 15m dax..
hello, I made some changes
Hi, for what its worth i did something to this as well. I optimized everything “very quick and dirty” meaning i didnt want to spend too much time on this but i wanted to see what i could make of it.
I found that the algo gets better results by removing the time restriction + the c8 buy condition / c34 short condition after that i did the following:
- I split stop loss and target for when a trade is “longonmarket” and “shortonmarket”, optimized the stoploss and targets on data from 2012 – 2015,. The stoploss / targets was optimized before the other variables..
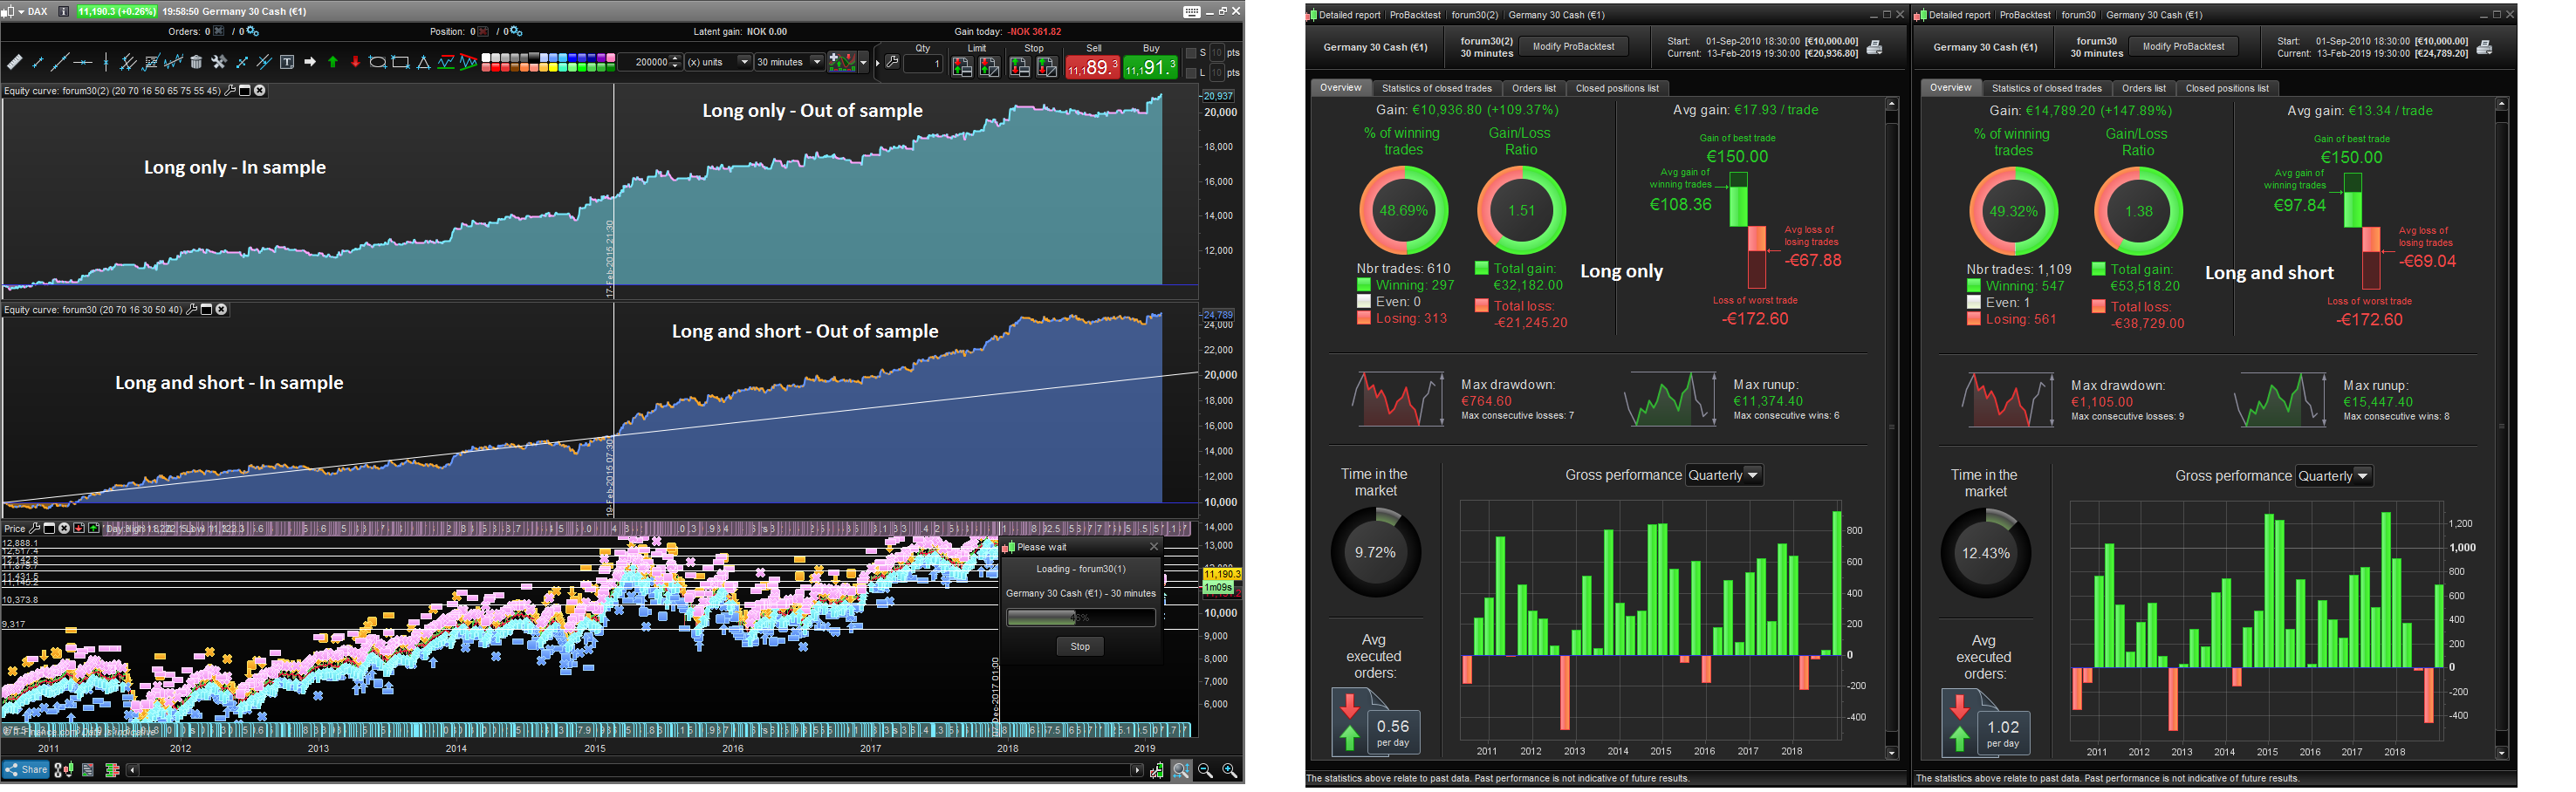
- I optimized on the data that @discomusic did not have. Meaning the “out of sample” period is indeed @discomusic’s “in sample” period (not sure if he has optimized on 100% of his available data or not) so this is obviously a red flag. In other words I have optimized the first 50% of the data, and he has optimized the last 50% of the data.. How much is this curvefit.. no idea.. I honestly like the Out of sample “long only” results and im gonna put it in demo to see how it goes..
- I think that you could optimize this alot “better” than what i did. I used big intervals and i havnt optimized target & stop loss, after the new variables have been optimized.
- I would say “long only” looks better than going long and short, based on my optimizing.
- In the picture included: For the “long only” i just removed the shorting-code. Its the same “long variables” as the “Long and short” variables
DEFPARAM CumulateOrders = False // Posizioni cumulate disattivate

//n1 = 20 (opt 16-24 w/ 2 intervals)
//n2 = 70 (not optimized)
//n3 = 12 (opt 8-16 w/ 2 intervals)
//n4 = 30 (not optimized)
//n5 = 50 (opt 50-70 w/ 10 intervals)
//n6 = 40 (opt 30-50 w/ 10 intervals)
//e1 = 65 (opt 35-75 w/ 10 intervals)
//e2 = 75 (opt 35-75 w/ 10 intervals)
//e3 = 55 (opt 35-75 w/ 10 intervals)
//e4 = 45 (opt 35-75 w/ 10 intervals)


indicator1 = RSI[n1](close) // 20
c1 = (indicator1 > n2) // 70
c65=Momentum[n3]>momentum[n3][1] // 12
c66=momentum[n3][1]>momentum[n3][2]


IF c1 and c65 and c66 THEN
BUY 2 CONTRACT AT MARKET
ENDIF

indicator2 = RSI[n1](close)
c2 = (indicator2 CROSSES UNDER n5) // 60
c13= average[n1]<average[n1][1]

IF c2 or c13 THEN
SELL AT MARKET
ENDIF

indicator3 = RSI[n1](close)
c3 = (indicator3 CROSSES UNDER n4) // 30
c65=Momentum[n3]<momentum[n3][1]
c66=momentum[n3][1]<momentum[n3][2]

IF c3 and c65 and c66 THEN
SELLSHORT 2 CONTRACT AT MARKET
ENDIF

indicator5 = RSI[n1](close)
c5 = (indicator5 CROSSES OVER n6)  // 40
c13= average[n1]>average[n1][1]
IF c5 or c13 THEN
EXITSHORT AT MARKET
ENDIF

if longonmarket then
SET STOP pLOSS e1 // 65
SET TARGET pPROFIT e2 // 75
endif

if shortonmarket then
set stop ploss e3 // 55
set target pprofit e4 // 45
endif
Pic is 25 minutes dax
Variables are mine that was optimized on data from 2011-2015 (february) for 30 min dax. Interesting results.
Oh i forgot to say, i also made another change to the original code: I Changed
indicator1 = RSI[n1](close) // 20
c1 = (indicator1 > n2) // 70
From crosses over to just >, i was testing out stuff regarding the time-restrictions
Below improves results
Close > Average[60,6](close) // on Long entry
Pic is 25 minutes dax
So are you making the point that on 25m TF (using the 30m TF optimised variables) that results are still good so that is a good sign??
Yes, changing the candles so its not 12:00, 12:30, 13:00, 13:30, but rather 12:00, 12:25, 12:50, 13.15 (at least in my head) should scramble up the data alot.
If this strategy is doing anything it is trying to capture momentum, and by the looks of it, 25-35 minute candles seem to get the most of it using this strategy.
That being said im going to put this in a drawer for 6 months or more. Because i didnt make it, and it might be super curvefit bullshit. If i optimized on the first 50% of the data using very similar and already optimized variables coming from the second half of the 50%, that might just make this a basicly 100% of the data curvefit algo..
if it keeps delivering results month after month tho, i might run it.
- It dosnt seem to just break down and drain ur account, should be able to spot it turning bad before anything massive happens..
- max drawdown seems OK, if u run Long only u can get an even better max drawdown.
- The profit looks pretty evenly spread which also is a good sign..
- The strategy itself is pretty simple as well, not a whole lot to it. Couple of entry conditions and exit conditions, nothing crazy.
- When market is going down, the algo is going flat, as soon as market touches “bottom”, the algo starts making profits again. Looking very good as it should. With these types of conditions you cant really expect it to make alot of money as the market is plummeting -20%, yes you will have a few small “rallys” here and there while price is going down, and if you zoom in during those times, those small rallys are actually whats keeping the algo more or less at 0 when markets are dropping, very nice. Might be super curvefitted, might actually be something. Time will tell i guess.
Im talking about Long only version.
Would also like to add that if you remove the exit codes, or if you remove the target and stop loss, the algo still looks pretty decent. I would say this speaks to a decent entry.
Hello,
Thank you Jebus for the new version. It looks really good on 200K! Some questions:
1.You have no time limits (flatbefore, flatafter) in the code attached. My result gets better when using trading hours on your code. Do you use that or is there a reason for excluding it?
2. When taking this to the Wallstreet H1 it doesnt show a result anymore. Have you optimized for that market as well? The old version showed good result whithout optimization which was really promising (100% OOS for Wallstreet).
I will take both of them to demo as well as Wallstreet H1.
Discomusic had some other tests done, it would be interesting to see them as well.
I sorry, but I cannot contribute to this one 🙂
When taking this to the Wallstreet H1 it doesnt show a result anymore.
What are your trading hours?
I ask because if they are for example 09:30 etc then on a 1H TF the half hour will never be hit and so this is likely why you get no results??
Hello,
Thank you Jebus for the new version. It looks really good on 200K! Some questions:
1.You have no time limits (flatbefore, flatafter) in the code attached. My result gets better when using trading hours on your code. Do you use that or is there a reason for excluding it?
2. When taking this to the Wallstreet H1 it doesnt show a result anymore. Have you optimized for that market as well? The old version showed good result whithout optimization which was really promising (100% OOS for Wallstreet).
——————————————————
1. I removed the time just because i wanted to see what would happen. I havnt really “worked” this code alot, just tried to add and remove a couple of things. If you got better results adding a timefilter then that might be good to do in real life as well.
2. Im not sure why u cant see results for 1h wall st anymore? Nothing in the code should make that happen. Im getting results and the results look way worse than before. Would this mean that “my optimization” has curvefit it alot more than the original code? Maybe. Is that a bad thing? Well who knows, is the answer.. Guess we just gotta throw this into demo (for me at least 6 months i think..) I have not optimized this for anything else than 30m dax.
I dont trust this code from the get-go. Cus i didnt make it. Biggest red flag i would say is that it is optimized on 50% of the data, then re-optimized using very similar variables on the other 50% of the data. I think this should be a huge red flag and justify why you should throw it into demo for a long time..