I was messing around with my ‘Day Month and Year Robustness Tester’ on various long only indices markets and I noticed something that kept happening on a lot of markets – it seemed that the months of July, August, September and January always gave bad results. It seemed to be particularly true on American and European markets. These are times when a lot of people are on holiday and January is a time when the markets are often falling back after a Santa rally. Sell in May and go away is an often cited phrase but go away in July and January isn’t! So I decided to check further. I wrote a very simple weekly strategy that only bought if it wasn’t a ‘holiday’ month and sold the next week if it was in profit or if the next week it was a holiday month.
I tested with a spread of 4. Some markets are a little more than this when closed and some are a little less but it is a weekly strategy so spread is not as important anyway. I used 1.6 for the SP500. I tested from 01 Jan 1995 as this is around when algo trading started to take off and market behaviour changed.
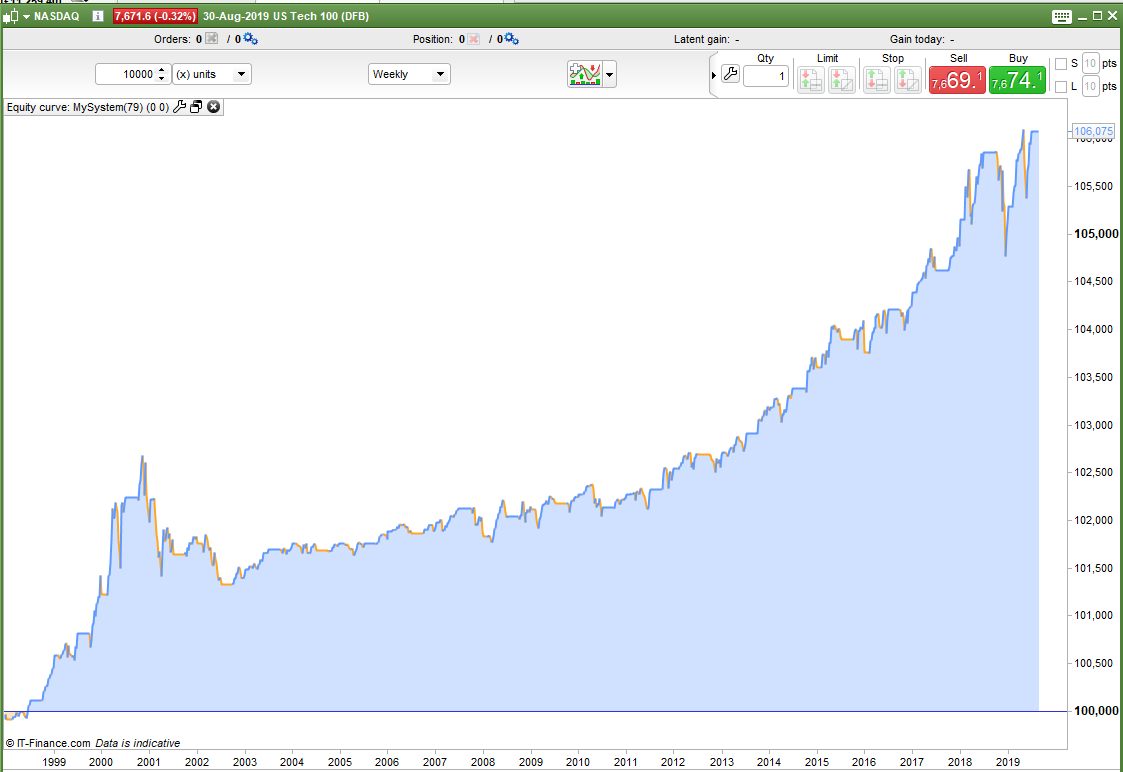
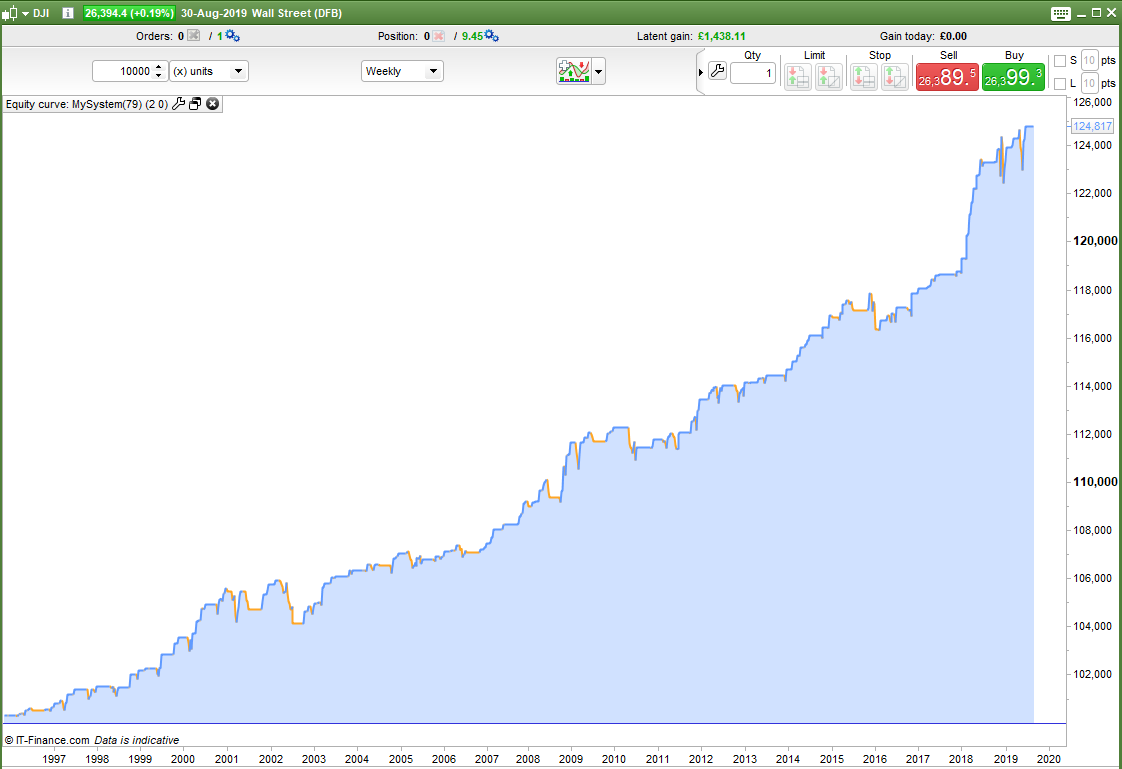
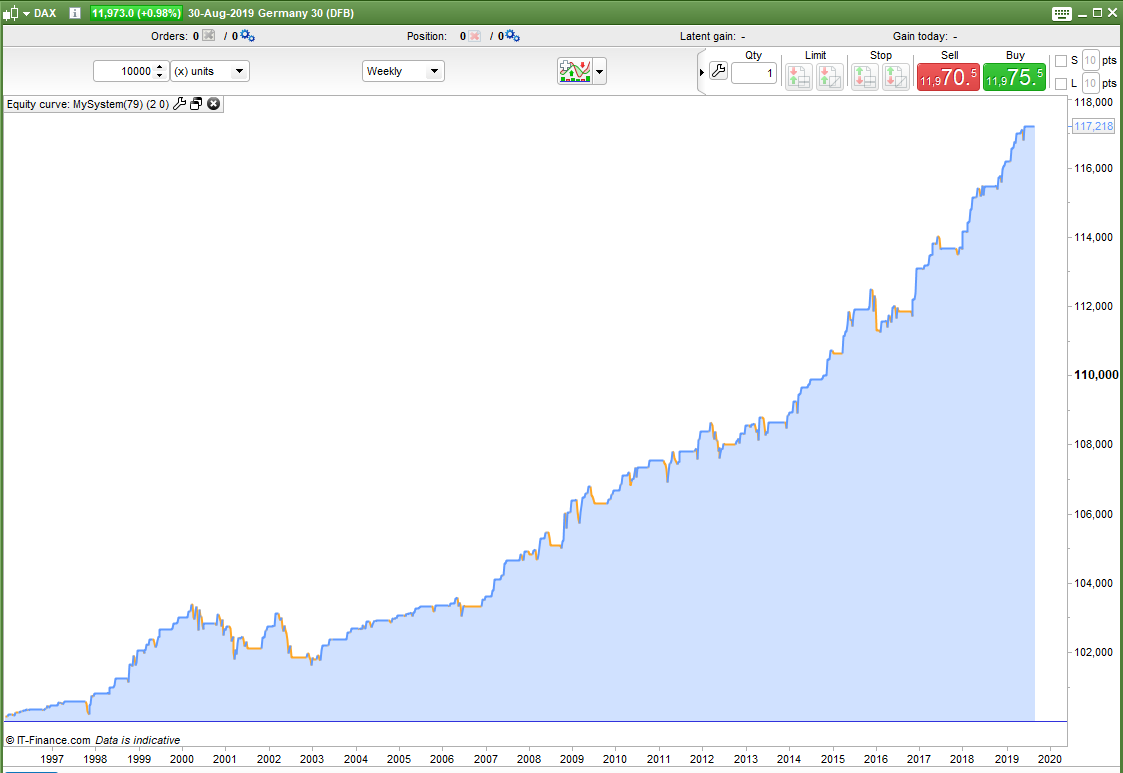
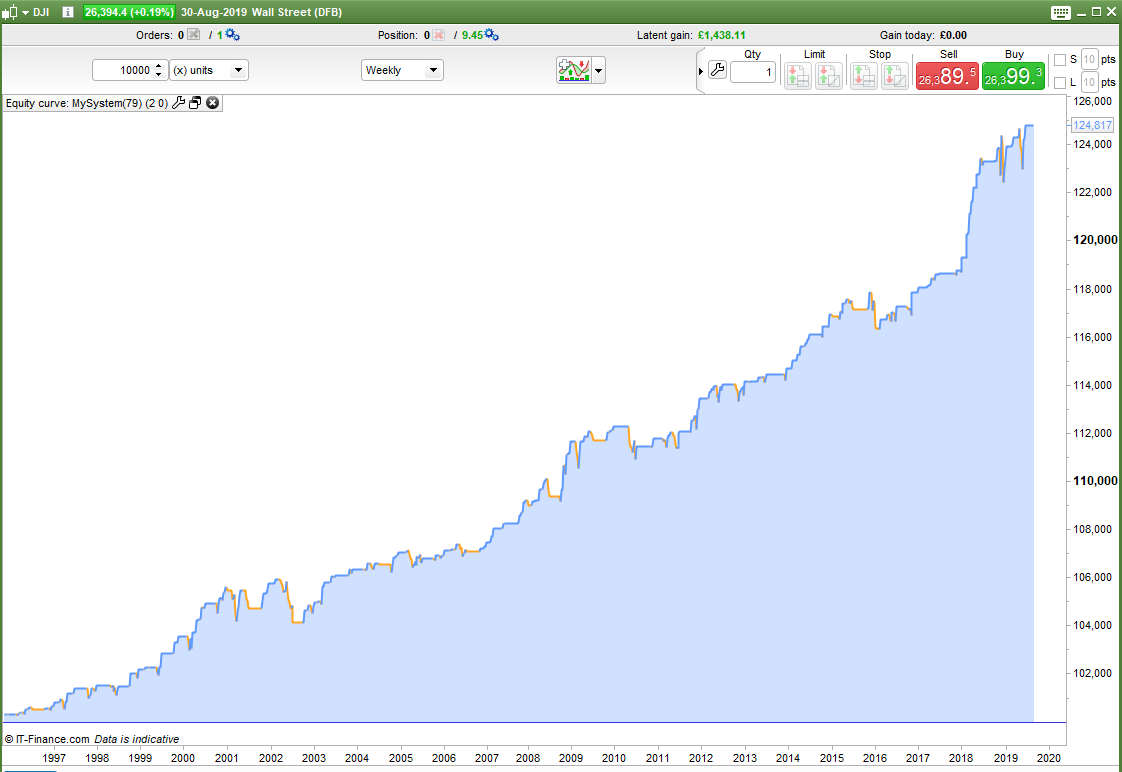
Images are of DJI, DAX,Wall Street, FTSE100, SP500, EU50, France40, FTSE250 and NASDAQ
Yes they are all closely correlated markets but still the results make interesting viewing. It seems that taking a couple of long holidays each year could actually be profitable!
Next I will test only buying on dips.
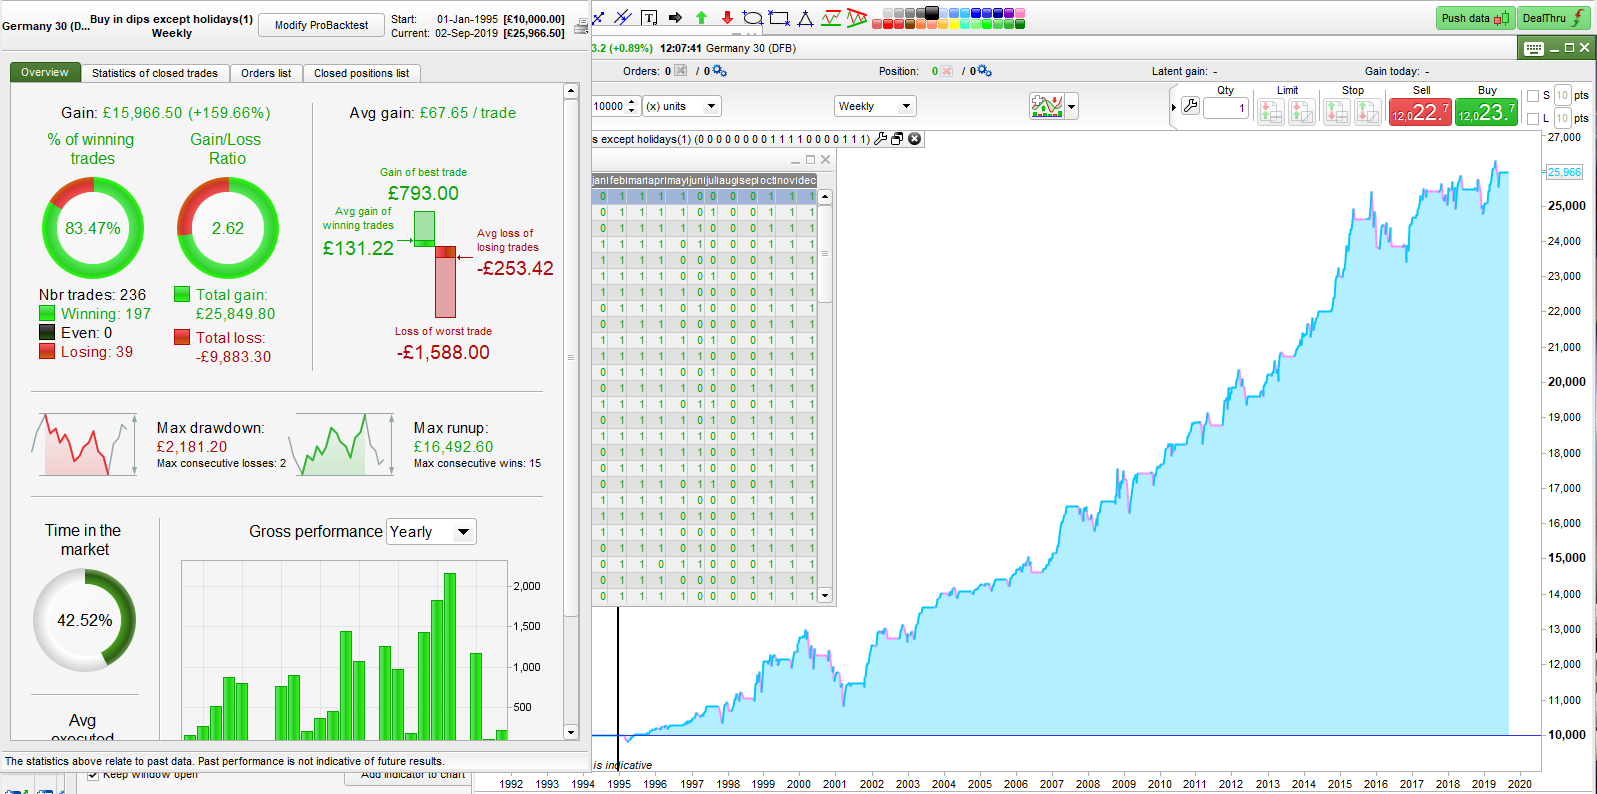
So the next test was only buying on dips so I set the strategy to only buy if typical price was lower than typical price the week before. Same exit conditions of sell if in profit or if it is a holiday month.
See the images for the results.
A quick check seemed to show that average gain per trade was much higher.
If I didn’t already live on a boat then I think I might be taking more holidays in the future!
I decided that there were many ways to check for a market dip and I wanted to test them all! So I coded the following and added it to my strategy. Now it would test for every possible combination out of the 64 possible of the following tests for a dip by having six optimised variables that are set to either 0 or 1 default 1 for off or on:
close < open
typicalprice < typicalprice[1]
totalprice < totalprice[1]
medianprice < medianprice[1]
weightedclose < weightedclose[1]
close < close[1]
Now I just have to wade through all the results. I’m not sure I’ll see any massive improvements but you have to test everything!
monthok = (openmonth >= 2 and openmonth <= 6) or (openmonth >=10 and openmonth <=12)

c1 = 1
c2 = 1
c3 = 1
c4 = 1
c5 = 1
c6 = 1

if clop then
c1 = close < open
endif

if typ then
c2 = typicalprice < typicalprice[1]
endif

if tot then
c3 = totalprice < totalprice[1]
endif

if med then
c4 = medianprice < medianprice[1]
endif

if wei then
c5 = weightedclose < weightedclose[1]
endif

if clcl then
c6 = close < close[1]
endif

if onmarket and close > positionprice or onmarket and not monthok then
sell at market
endif

tradeon = c1 and c2 and c3 and c4 and c5 and c6 and monthok
I’ve been continuing my analysis of whether buying on dips and taking holidays is a working strategy idea.
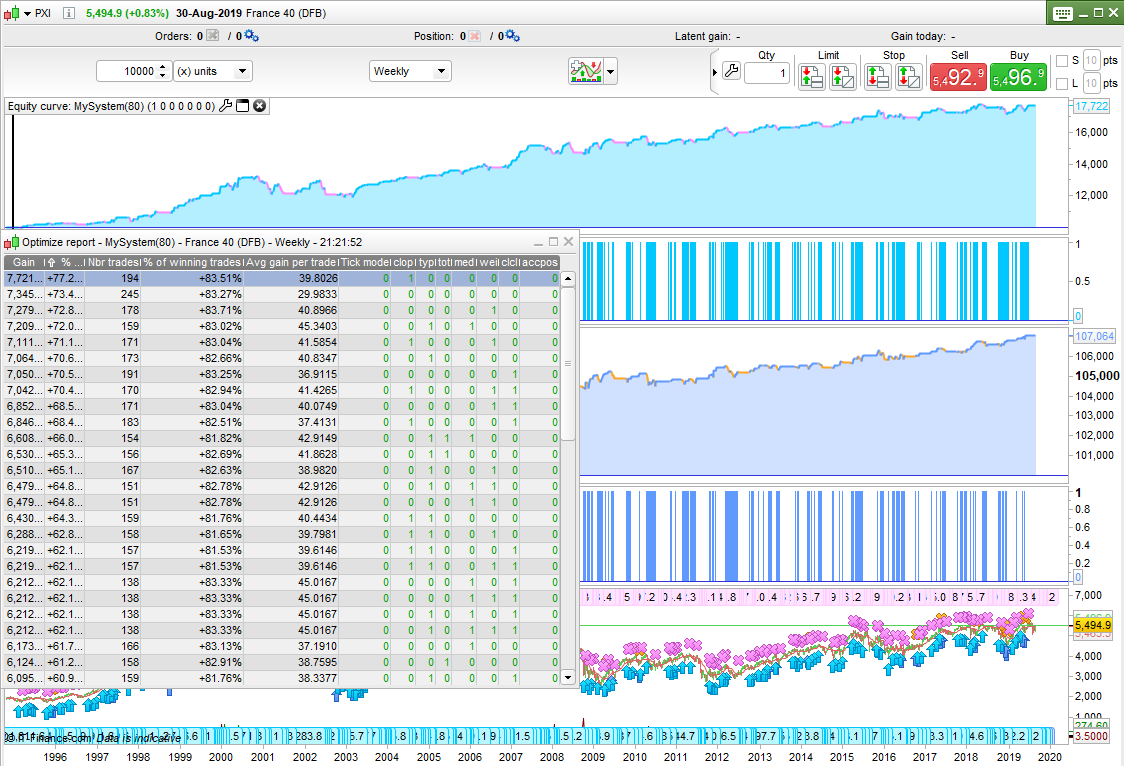
First of all I wanted to establish which was the best way of establishing that we were in a dip. The strategy add on in the last post tested six ideas but I wanted more so I added to it and ended up testing 8192 different combinations. The outcome of the test was that I had data overload! A lot of stuff worked but telling which was the best was going to be very hard work if I wanted to consider draw down, gain and average gain per trade. One thing that did become clear was that my six original ways to decide it was a dip were the best six.
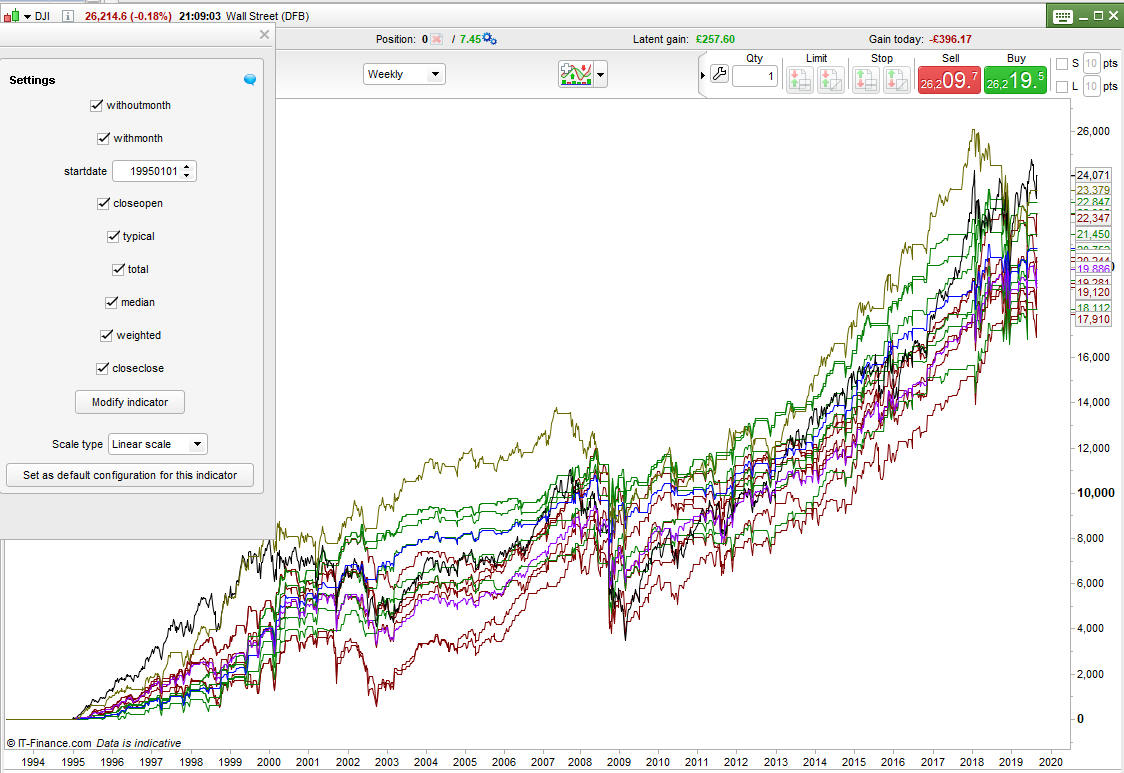
So next I coded an indicator that could draw equity curves for buying on every bar, buying on every bar that was a dip based on each of the six conditions and then also with and without the ‘holiday’ filter. I made the indicator so that I could turn on and off different lines. An average of all the shown buy on the dip lines was also calculated and shown. With this I was able to clearly see which lines performed best and which combination of lines had the best average equity curve.
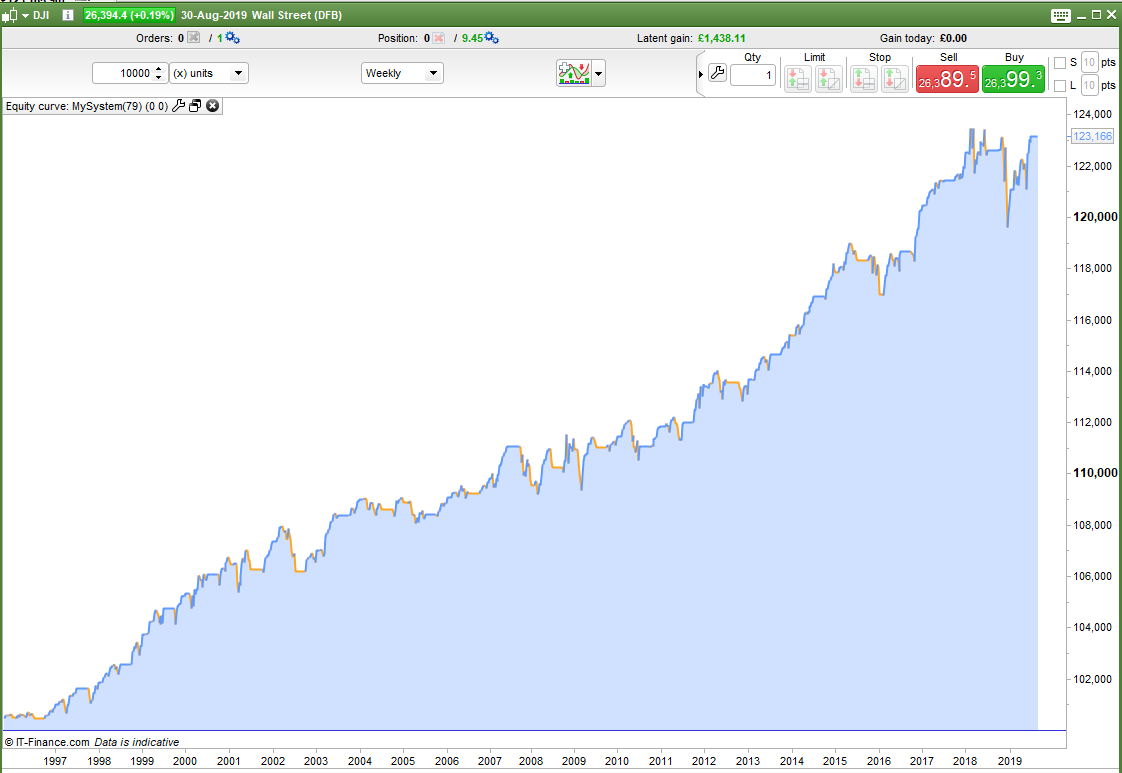
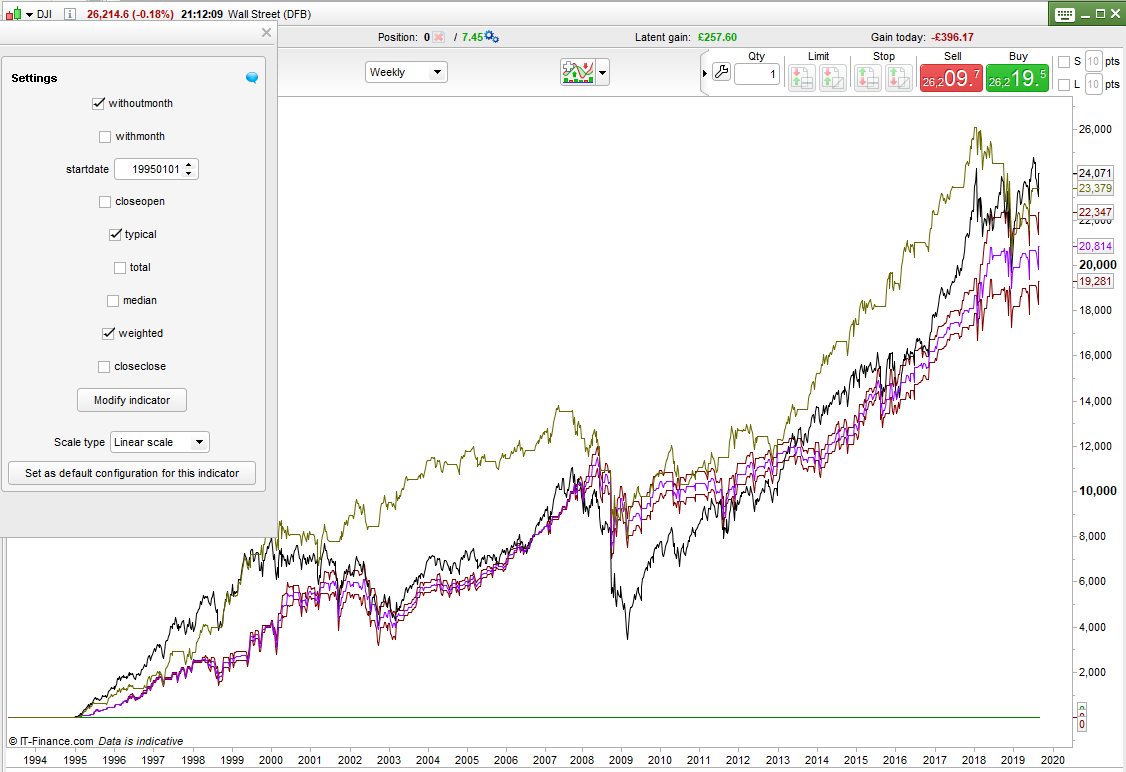
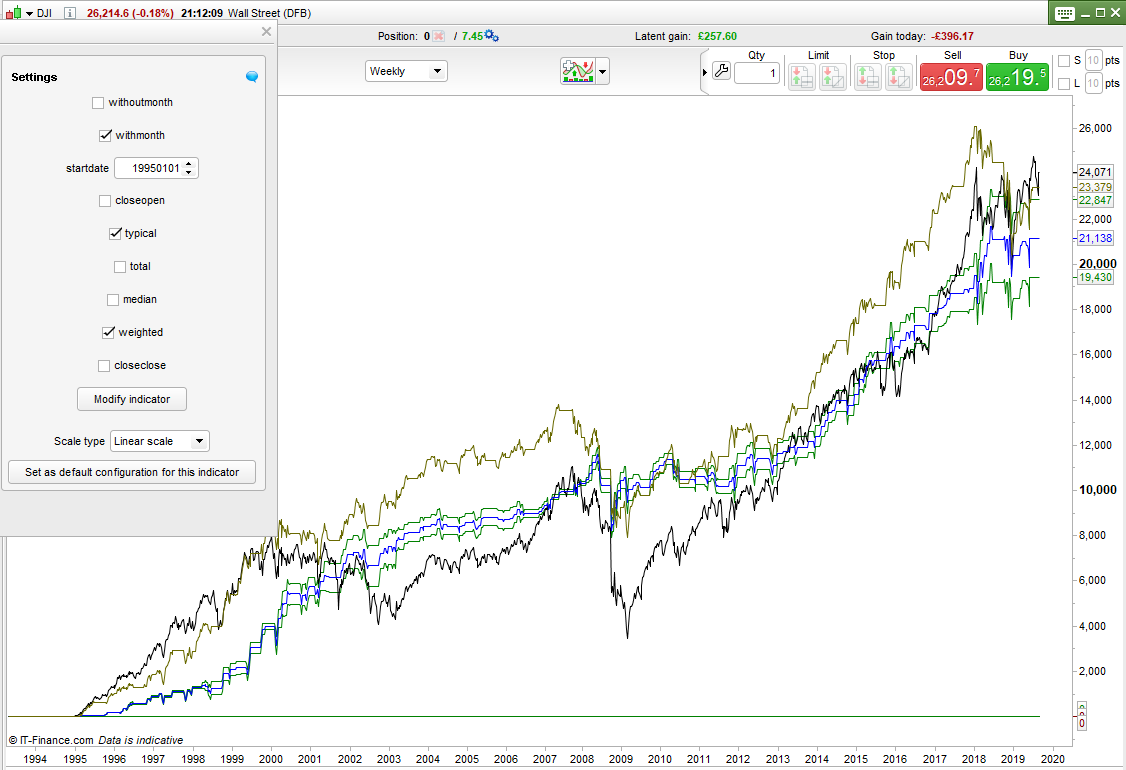
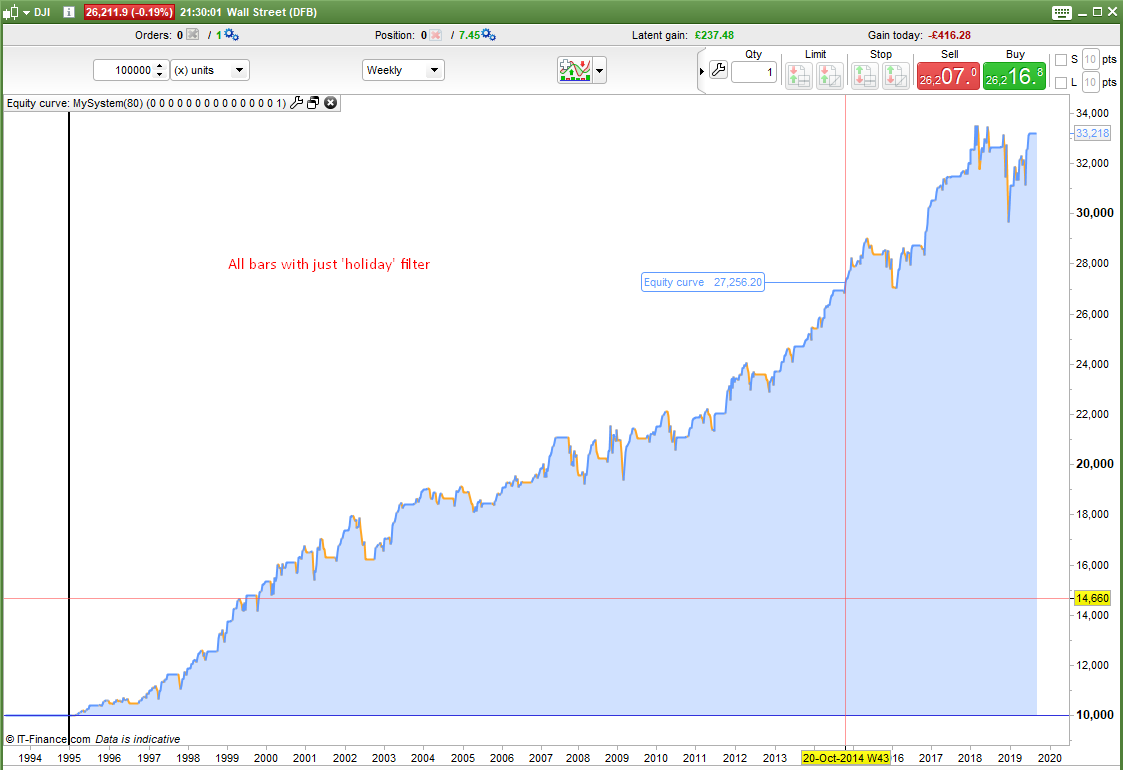
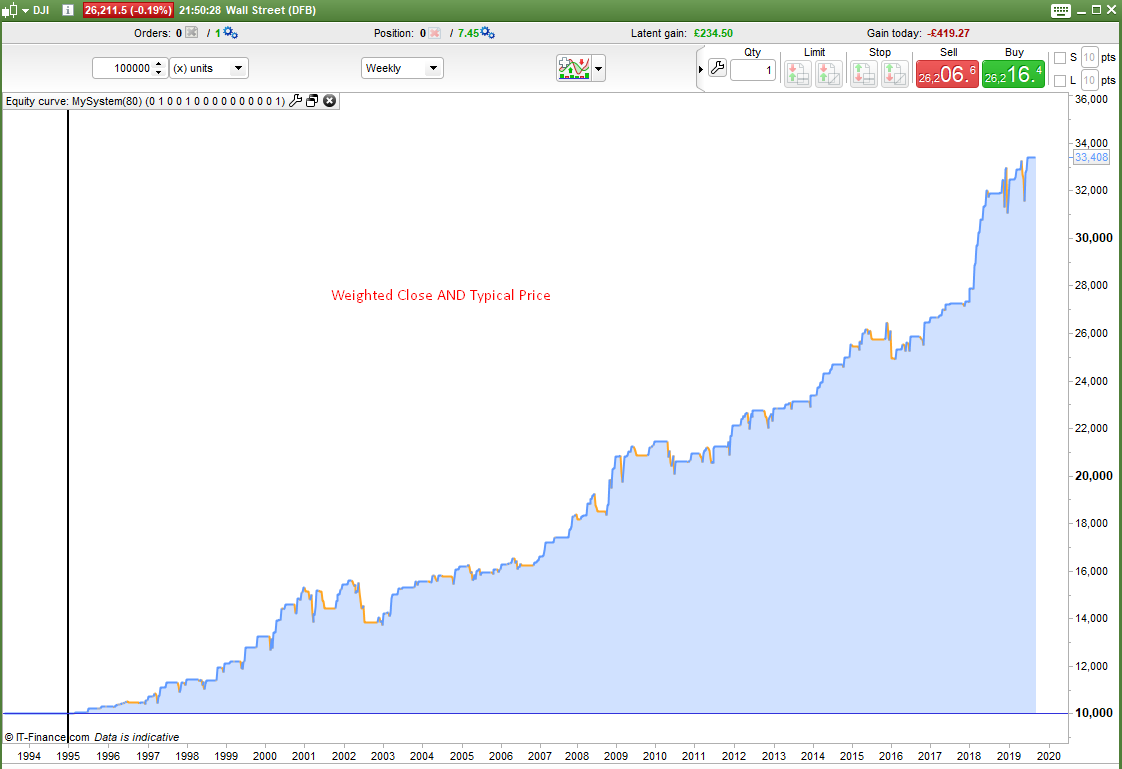
The results shown in the images are for the DJI weekly. The first image is all the lines. The black line is just buying every bar and the brown line buying every bar but with the holiday filter. the red lines are the buying on each of the dip conditions and the green are the same but with the holiday filter. The second two images show without holiday filter and with holiday filter after I had weeded out the poorer performing lines. Purple and blue lines are the averages.
It seems that on the DJI at least the buying on a dip if typical price has dropped or if weighted close has dropped has the best equity curves and especially with the holiday filter on.
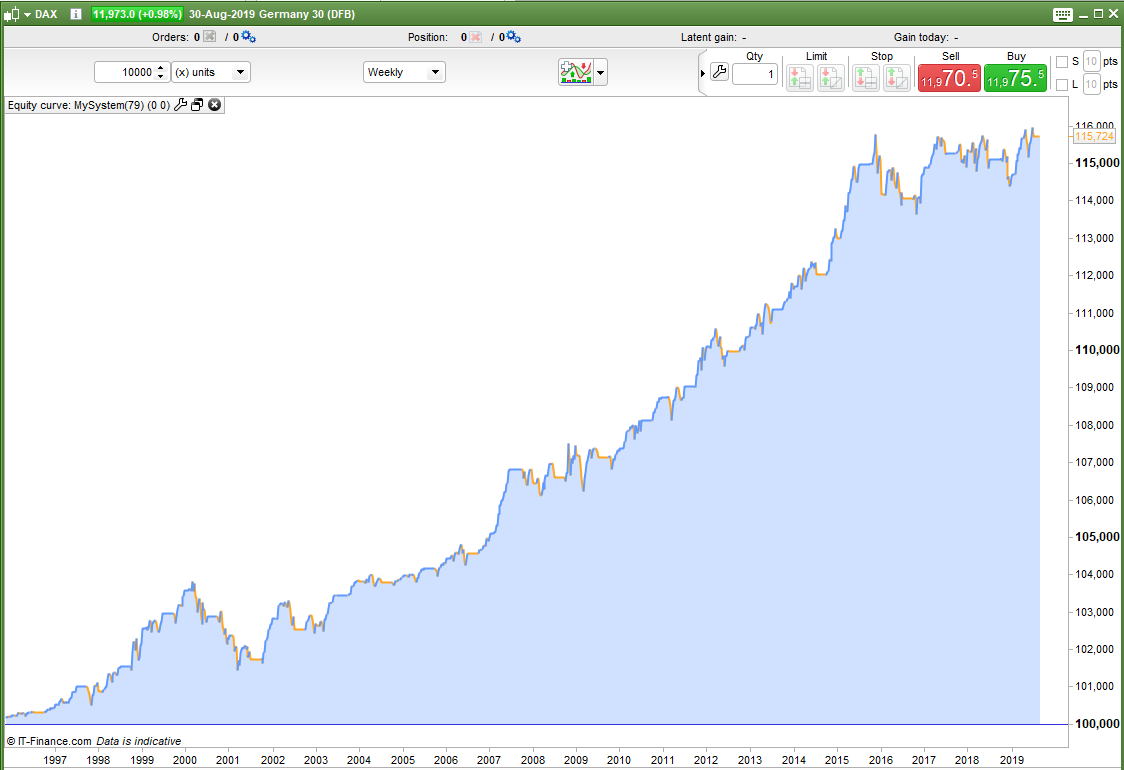
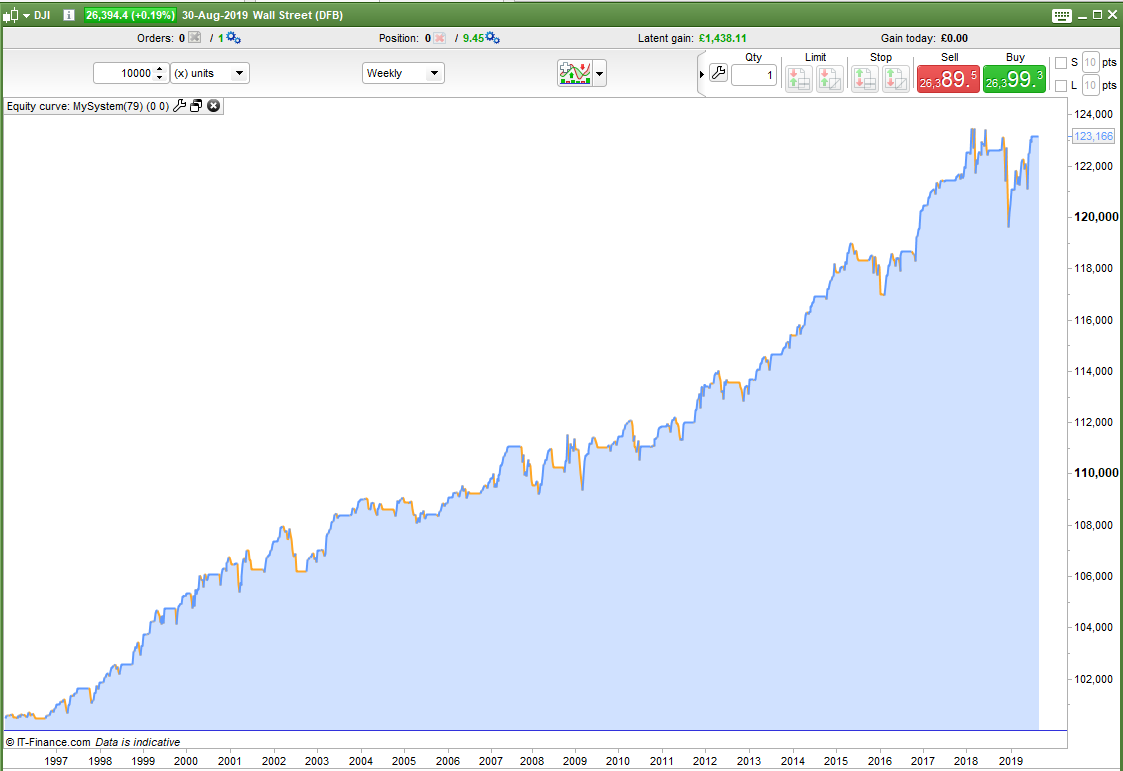
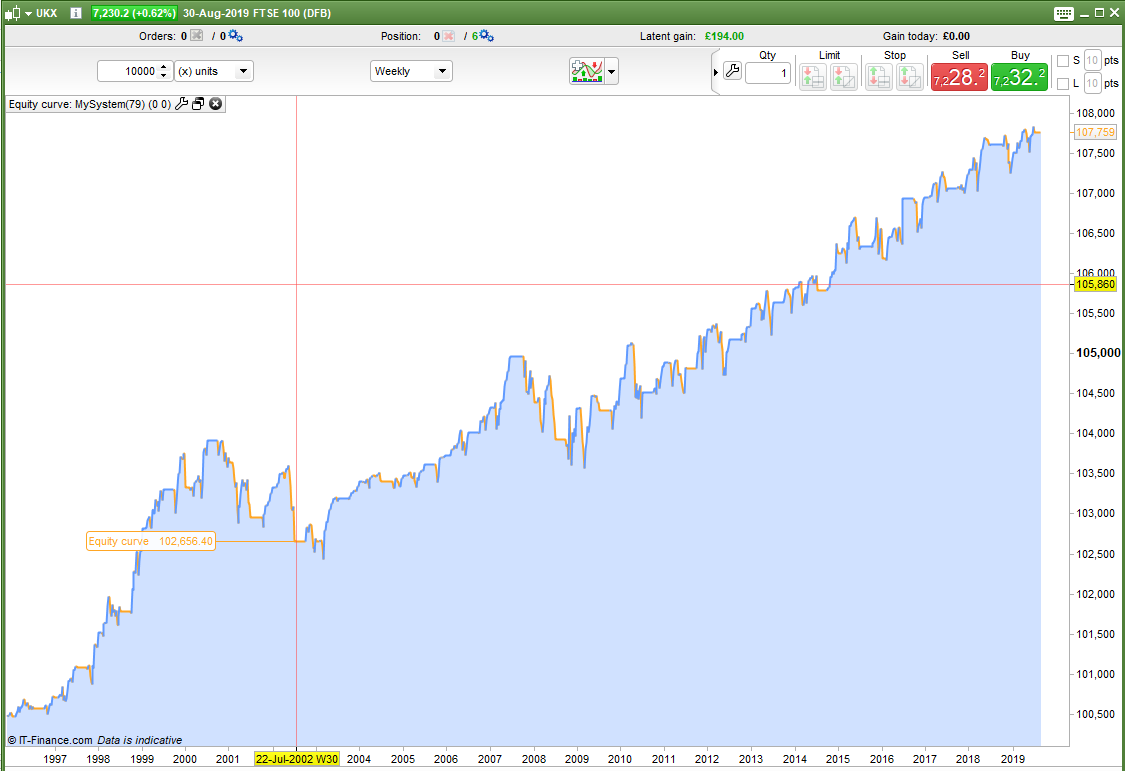
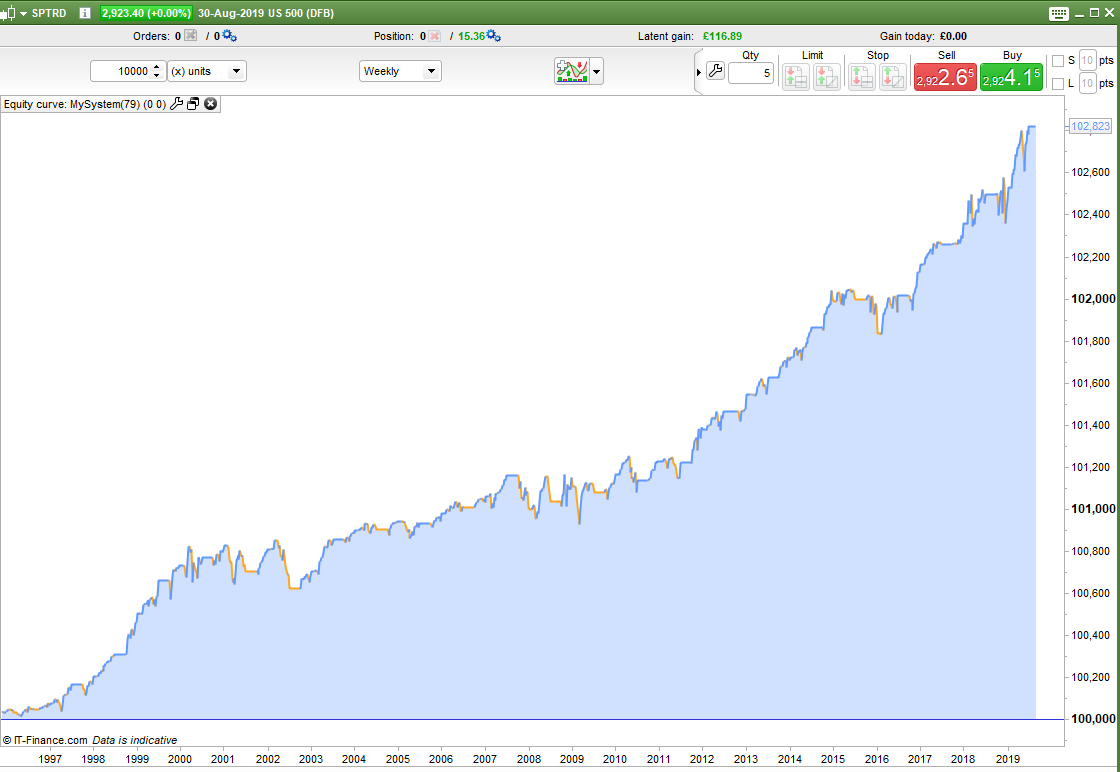
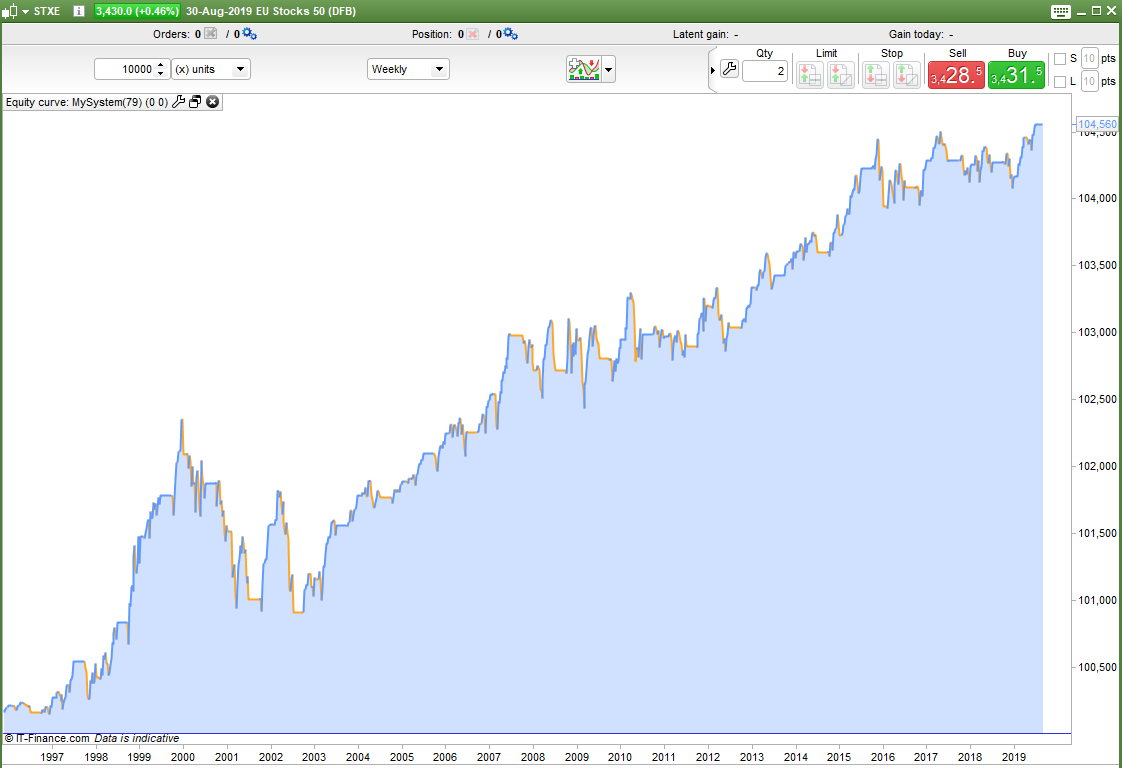
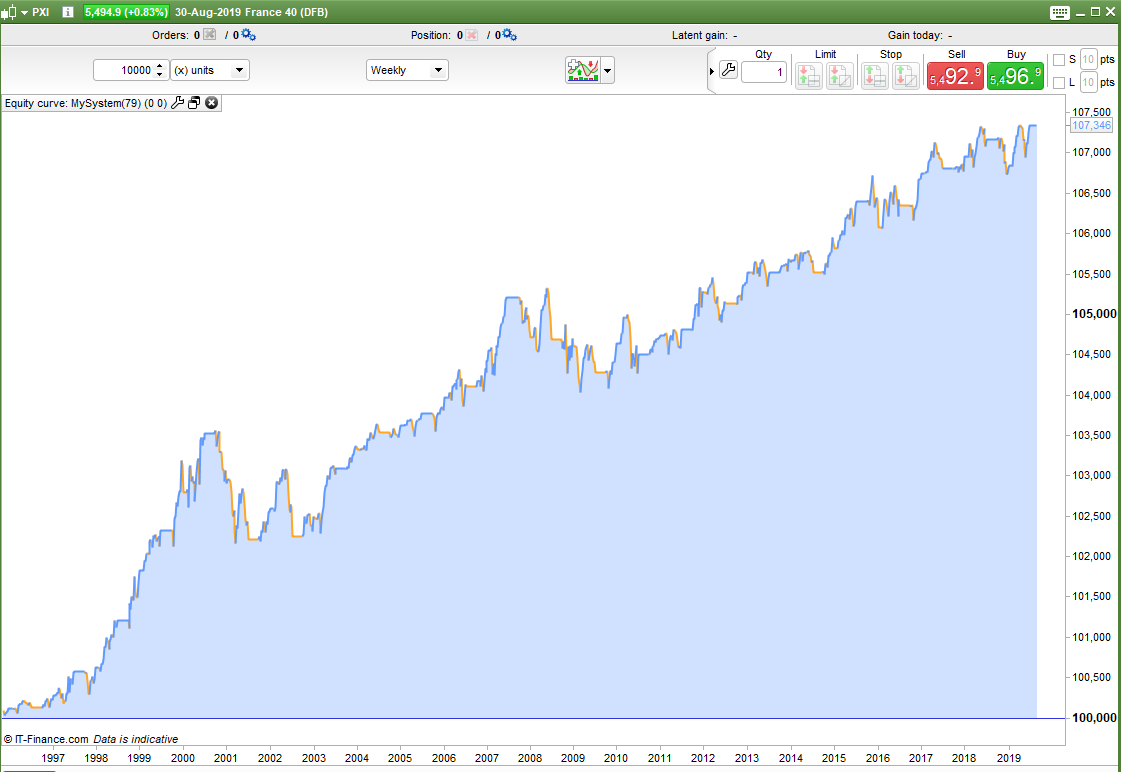
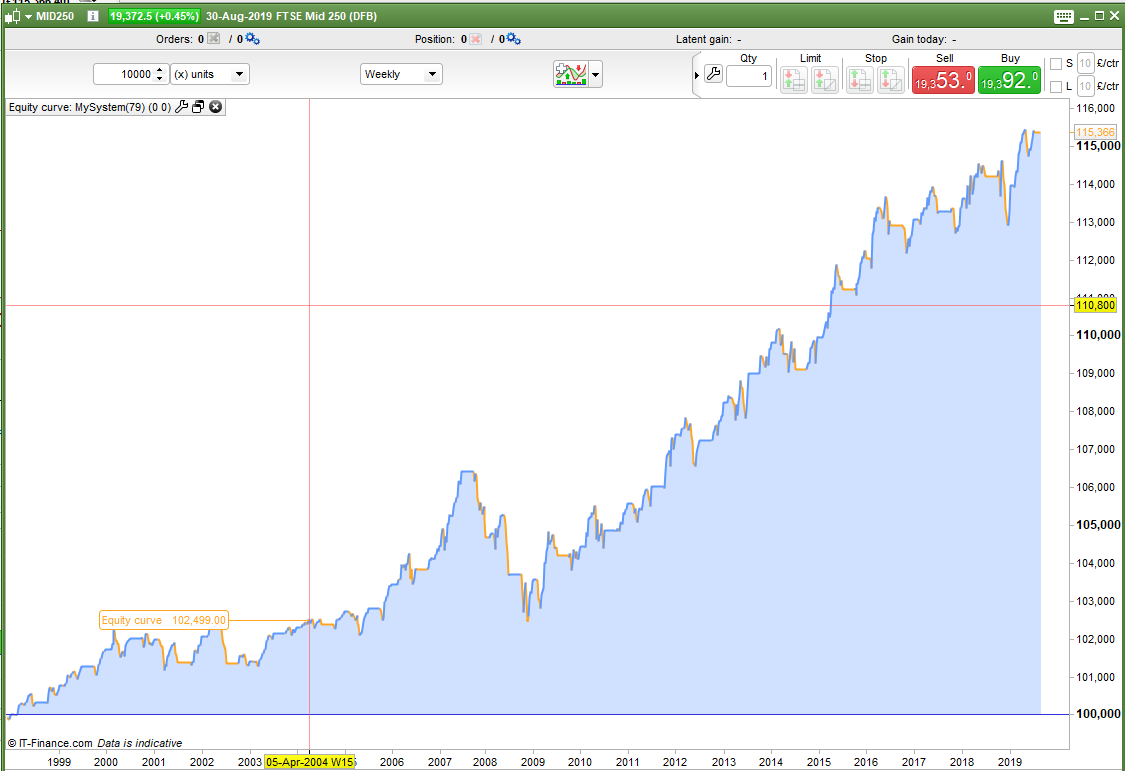
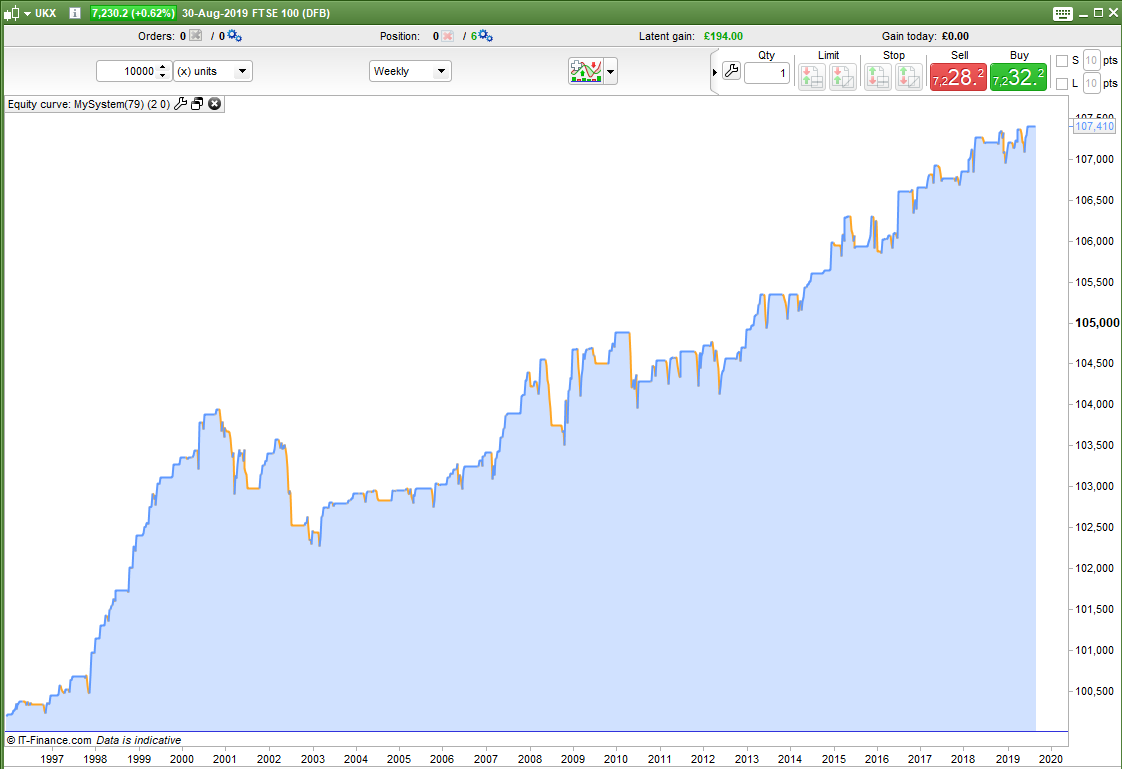
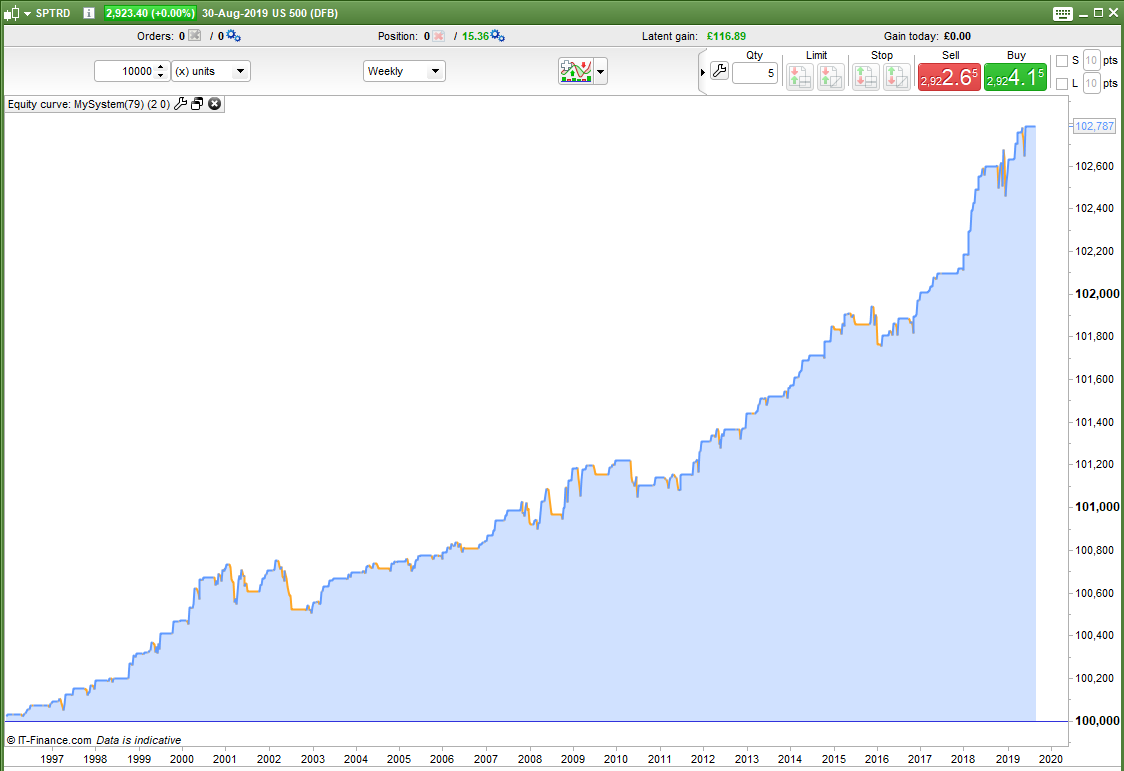
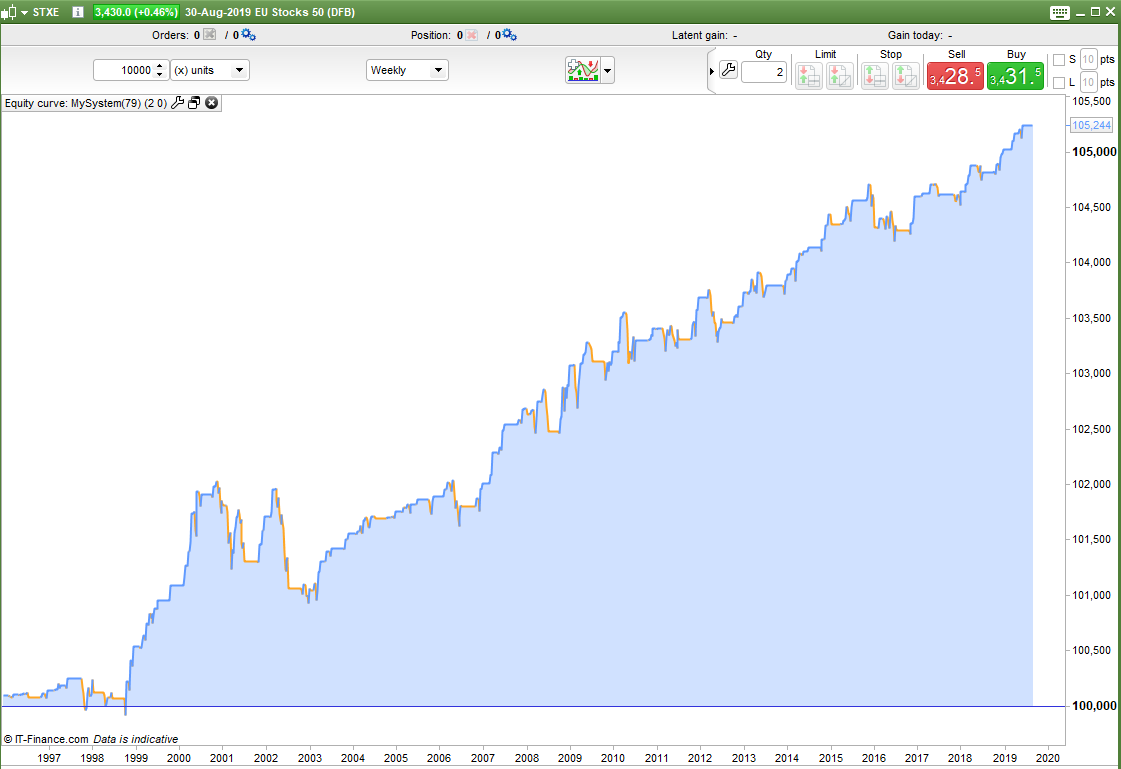
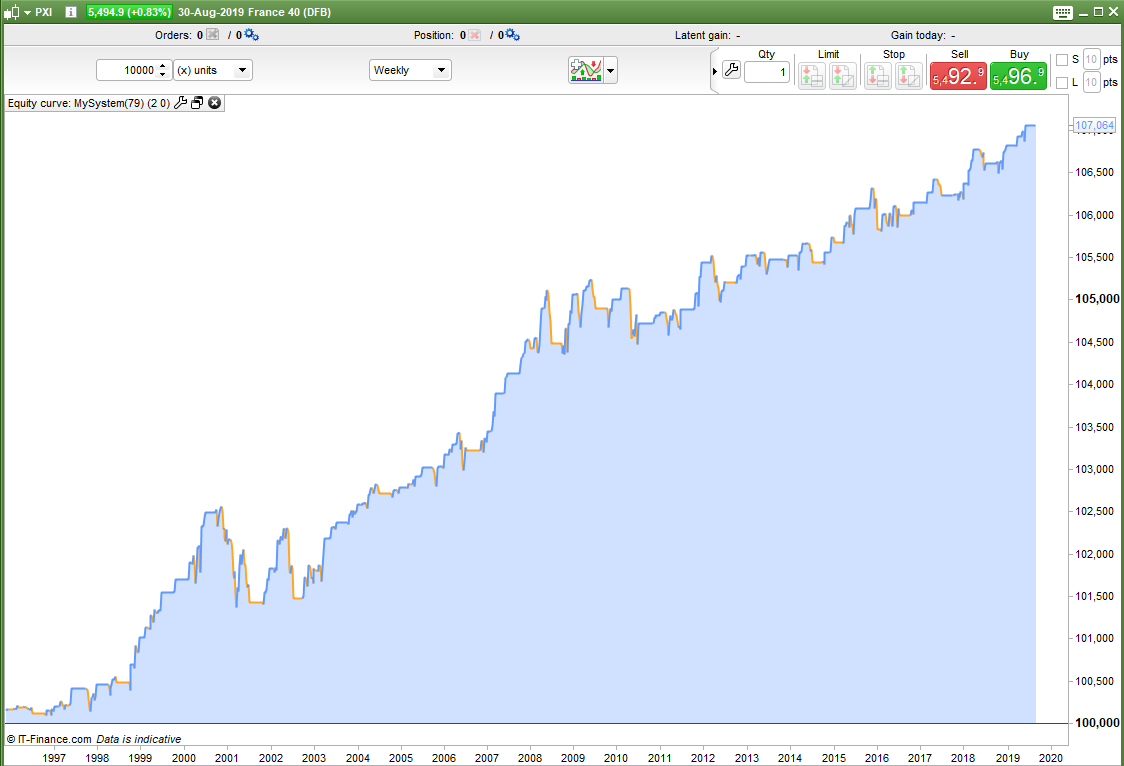
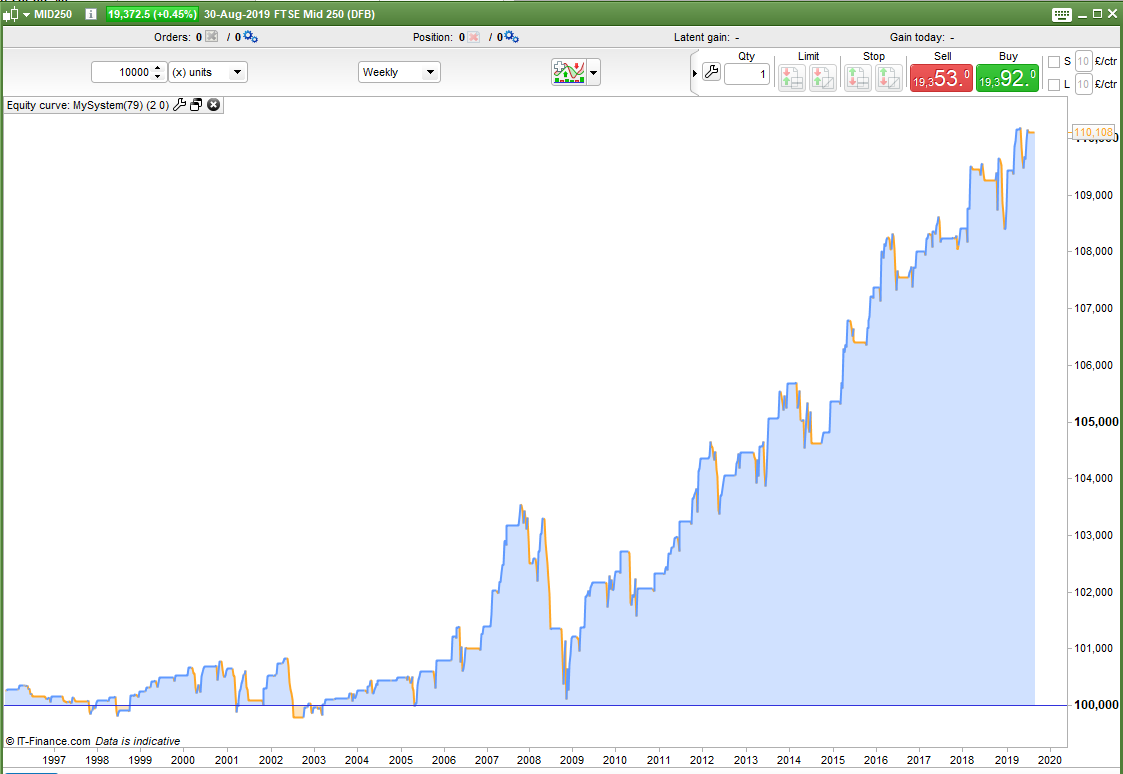
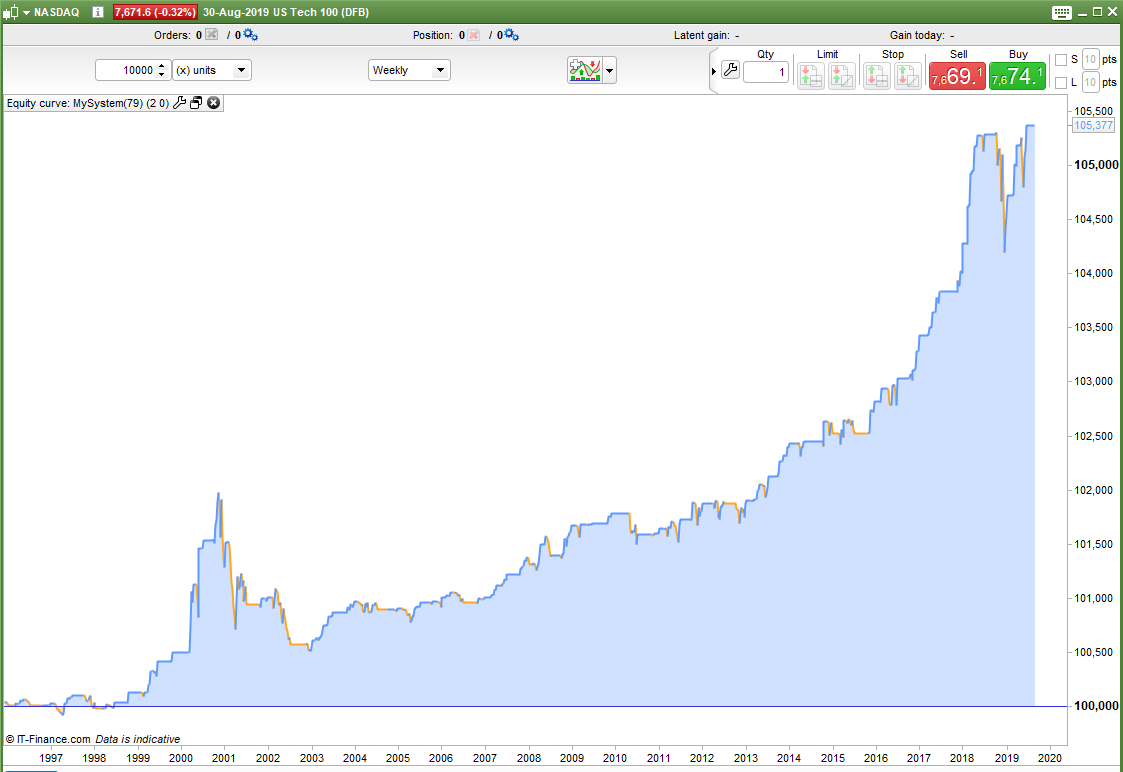
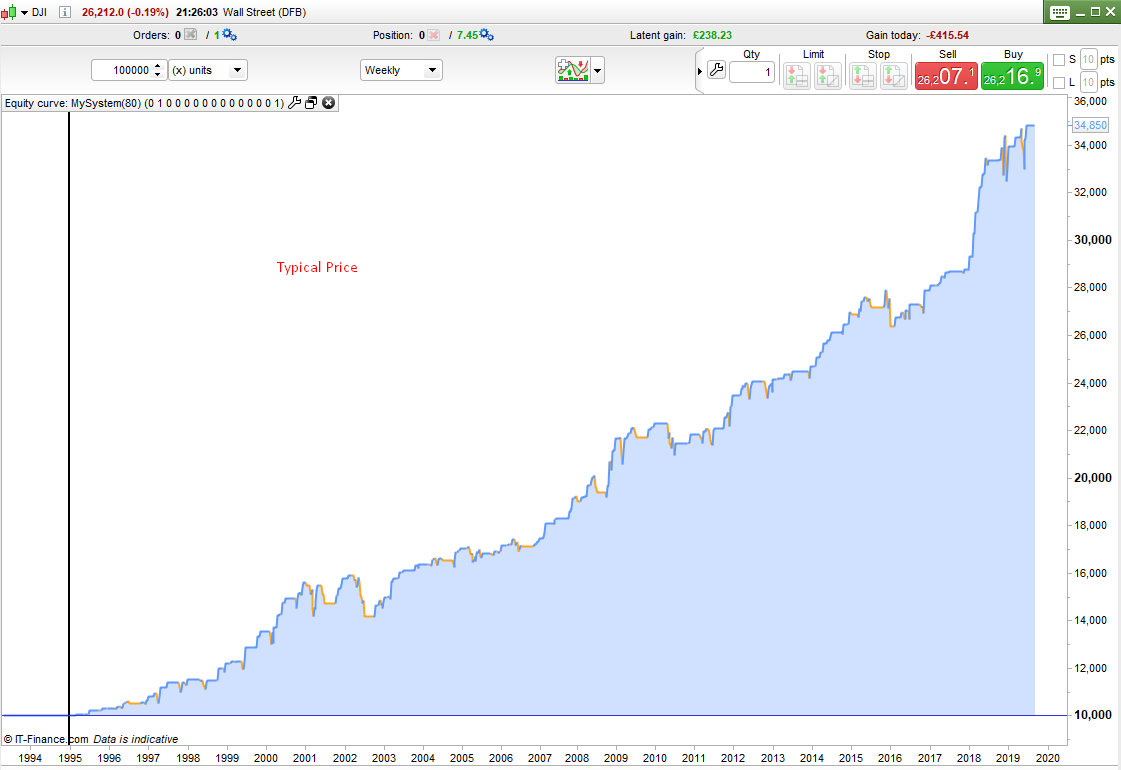
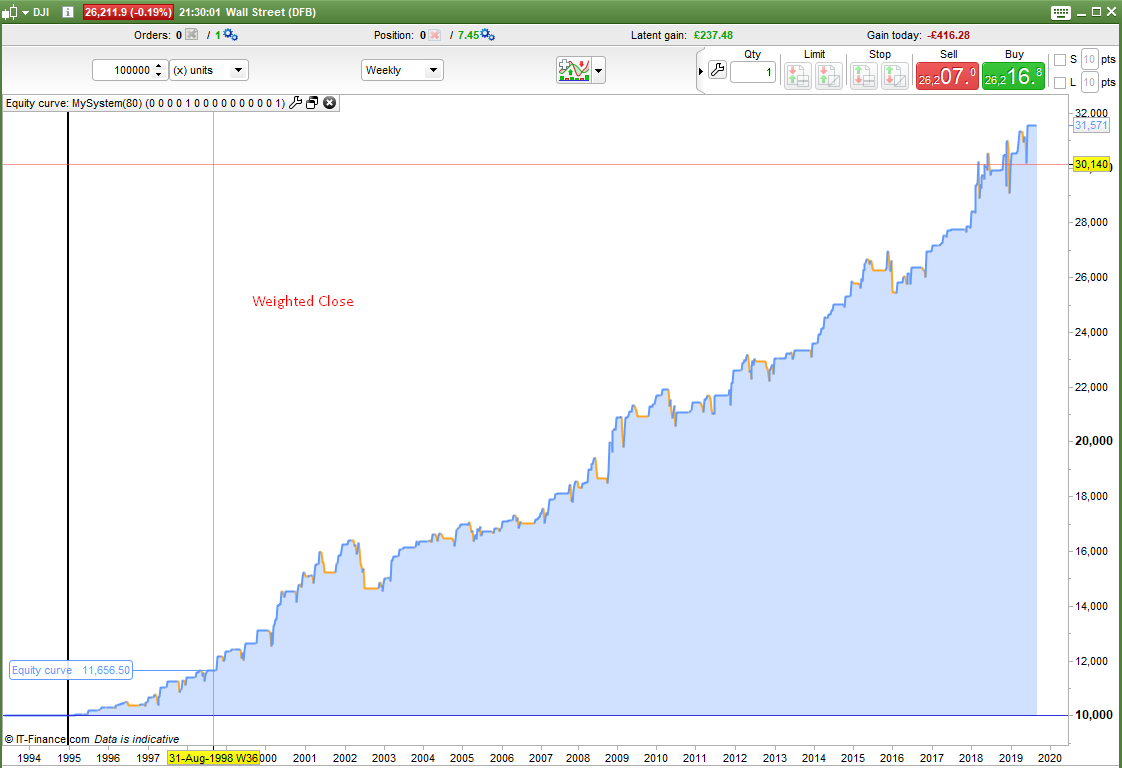
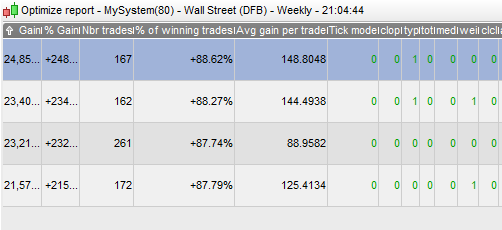
So I took this info and put it back into my original strategy. The four equity curve images show the results. All four are very nice equity curves with very low draw down. The equity curve of the chart showing buying on all bars has not performed very well recently but the the ones buying on dips have. Also the buying on dips except in holidays have far higher average gain per trade at almost 149 compared to just under 89 for buying every bar except in holidays.
I did some further tests on other markets and the same strategy idea seemed to work well across a broad range of markets. I also did some quick tests on daily charts and got some positive results. I will continue to try to persuade myself that taking holidays from trading when a lot of people are actually taking holidays is not just data mining!
Link to this Topic added to here
Snippet Link Library
I had a bit more time to do some more testing on the ‘take a holiday’ strategy. I won’t bore you with all the details but I ended up writing various indicators to analyse monthly behaviour and monthly volatility to see if there was some commonality between markets. In the end I coded a strategy that could optimise itself by trading in every combination of months possible to see which combinations came up for each market. If they were all the same or similar then I might be on to something. Unfortunately they weren’t. In the image you can see that the most profitable for the DJI was to avoid trading in January, June, July, August and September and other indices had different best months to avoid. As this ‘pick the best months’ strategy is pure data mining I decided that even though the equity curves were pretty good just taking holidays was not the greatest strategy idea.
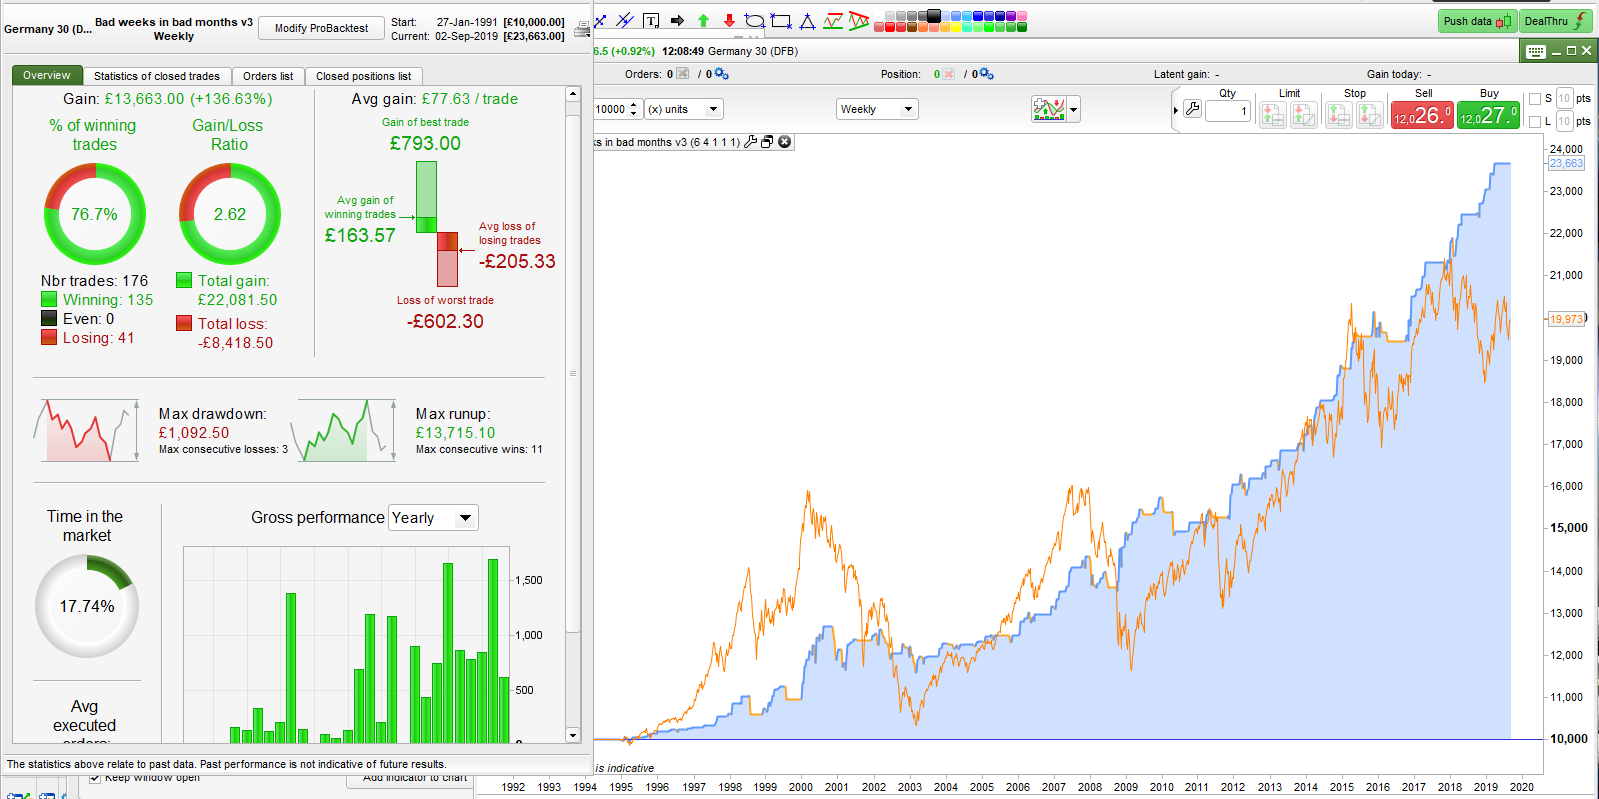
Not one to give up easily I decided to test the idea of trading only in months that have historically had more up weeks than the average for all months. This idea didn’t work but in the process I accidentally got a comparison the wrong way round by using a < instead of a > and I found that buying in bad weeks in historically bad months was actually a good idea! It is a kind of Warren Buffett method by turning seasonality on its head. It makes sense really that if a month has historically been a bad month to hold a long position then others will be getting out so if you buy the dips you get good value. Also in a market downturn the number of months performing below average will increase meaning more opportunities to buy the dips at very low prices. The second image is this new theory on the DJI. It hasn’t worked so well in the recent volatility so still some work to do. The exits are still very crude so that might be an area where big improvement could be made.
So don’t take any holidays to get rich just yet…..
EDIT: I posted the wrong images so I have updated them to the correct ones now!
@vonasi – The results you show warrant a: “WTF!”. Thanks for putting the spotlight on common seasonality in equity indices! The results certainly warrant some further research as to how one could filter trades to potentially improve results.
@GraHal – thanks for the spreadsheet! Excellent reading list!
Hi Vonasi
I read with great interest your posts regarding seasonality. One question though, if I compare these to a buy and hold, for the DJA for example. The improvement is not significant only 2-3 %.
Or am I missing something ?
Or am I missing something ?
As well as trying to beat buy and hold one of our other aims should be to reduce draw down. With buy and hold you would need to sit uncomfortably through some rather long down periods watching your profits disappear before waiting for them to slowly return again. Beating buy and hold is one challenge but if I can create a robust strategy that will match it or get close to it or even just make a nice annual return but without any massive draw down then I have created a strategy that returns good value for money. A strategy is not only about the final number but about how you got there too.
Fair point. Also looking at some other indices, the improvement in performance is far more than the 2-3 % of the DJA.
I was particularly surprised to see the improvement on the FTSE, for B&H (~40 %), Sell in May (~ 50 %), Holidays (~60 %) and Holidays combined with buy on the Dip (~85 %).
Yes the improvement on returns can seem very impressive but then they should be if you happen to choose all the best months and ignore all the worst months – it is called data mining and the only difference between seasonality and data mining is whether you can persuade yourself that the improvement is for an actual reason caused by the time of the year. For me it is not consistent enough year on year or market to market for me to believe there is anything to be gained from using monthly seasonality in the future.
Quick question – What is the difference between Month and Openmonth ? The results slightly differ between one and the other.
MONTH is the month at the close of a candle and OPENMONTH is the month at the open of a candle.