Hi Everyone, well I think this should open an order and close it, I’m looking at how to implement MTFs in proorder…
The program has a different idea and its numbing my ability to look at it..
What’s the error here with the MTF referencing?
Simple code to check the 2 second timeframe (for now) to close a 15 minute candle bought if price goes higher than the open of the prior candle in 15 mins.. Its probably staring me in the face, maybe need to wait a few days and return –
Whatever i do I get no trades… I think it should show something based on the criteria which is shown on the chart at 15 mins… Its running off the 2 second chart… Whats the issue? Anyone?
Timeframe (15 minutes, updateonclose)
indicator1 = ExponentialAverage[8](close)[1]
indicator2 = ExponentialAverage[20](close)[1]
c1 = (indicator1 > indicator2)//bullish MAs
c5 = open [1]< close[1]// bullish candle
Mybreakhigh=(close)[1]
Mybreaklow=(Low)[1]
Mytakeprofit= (Close)[0] //And absolute sell on close of candle
//referencing 2 second candles for execution
timeframe (2 seconds,updateonclose)//to check price every 2 seconds and execute
tobuyindicator=close[1] > Mybreakhigh
If tobuyindicator AND c1 AND c5 then
buy 15 PERPOINT AT MARKET
Endif
//stopout or close
If Mytakeprofit or Mybreaklow then
SELL AT MARKET
ENDIF
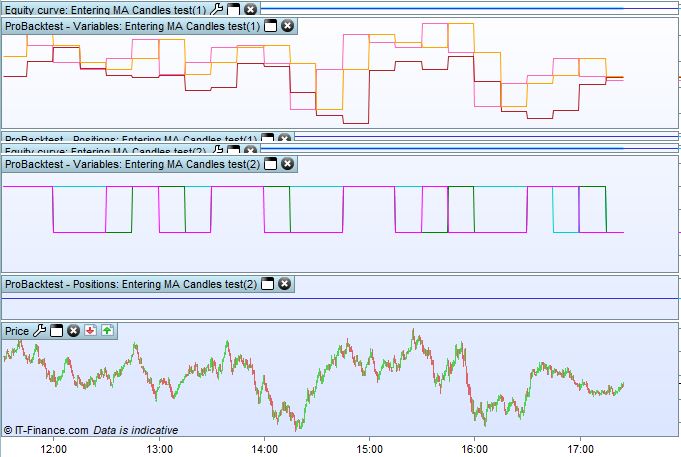
Add these lines at the end of your code so that you can monitor them candle by candle in the variable window that opens above the price when the backtest ends:
Graph Mybreakhigh
Graph Mybreaklow
Graph Mytakeprofit
Graph tobuyindicator
Graph c1
Graph c5
Cheers Rob, I’ll give that a go..
Interesting excercise Rob, cheers. I’ll analyse that and try to work out what its doing against what I think it should be doing.. 🙂 Had to split the graphing into two codes and colour to read properly…
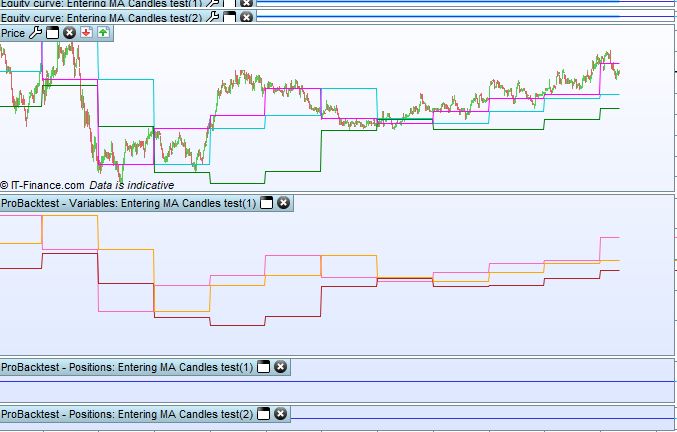
Actually the first three can also be written as:
GraphOnPrice Mybreakhigh  coloured(r1,g1,b1,255) AS "mbHI"
GraphOnPrice Mybreaklow   coloured(r2,g2,b2,255) AS "mbLO"
GraphOnPrice Mytakeprofit coloured(r3,g3,b3,255) AS "mTP"
to be plotted ON the price chart, rather than in a separate window ABOVE the chart.
Useful overlay
Cheers I’ll look at it to analyse
I must just say again that Graph and GraphonPrice I’m fnding invaluable… you should use it in your video course in relation to an analysis section:
I’ve got what I thought was a trail, but from what I can see when graphing it and graphing over price is that it’s not actually a trailing stop, but a stop reduction after a certain bar count if the loop matches the prior highest high or prior lowest low, but I’m not 100% sure yet but all I’m seeing is a varying loop sequence and then it breaks I think once the values match and it reduces the Stopploss to the value I’ve set which is the loop break price pluse a clearance value, not as a trail but it seems to be in reference to the opening price as it resets the stoploss value instead of using it as a trail, So the logic I think is “once the loop is seing a match to the HH or LL then reset the stoploss value to th eloop break value and my clearance… I’ve got some more finer analysing to do.
An interesting concept for programming reducing stoplosses if thats what its doing ?!?!? LOL , but I’ve also been able to use the graph and graphonprice to develop an actual trailing value, which I now need to set as a trailing stop of course… – Getting there… I may find that this initial fluff could prove to be better, but we’ll see… 😀 –
Really useful stuff, I’ve yet to go back to my scalping strategy, … 🙂
A TRUE trailing stop is a bit different, it could be programmed, but most people like it this way.
I once modified Nicolas’code to program that way:
//************************************************************************
//					trailing stop function
//
mainSL        = 100 * pipsize    //100  initial SL
trailingstart = 20  * pipsize    //20   trailing will start @trailinstart points profit
trailingstep  = 5   * pipsize    //5    trailing step to move the "stoploss"
//
//reset the stoploss value
IF NOT ONMARKET THEN
   newSL     = 0
   InitialSL = 0
ENDIF
//manage long positions
IF LONGONMARKET THEN
   IF InitialSL = 0 THEN
      InitialSL = tradeprice(1) - mainSL
   ENDIF
   //first move (breakeven)
   Difference = close - tradeprice(1)
   IF newSL = 0 AND Difference >= trailingstart THEN
      //newSL = tradeprice(1) + trailingstep
	  Steps   = max(1,round((Difference / trailingstep) - 0.5))
	  newSL   = InitialSL + (trailingstep * Steps)
   ENDIF
   //next moves
   Difference = close-newSL
   IF newSL > 0 AND Difference >= trailingstep THEN
      Steps   = max(1,round((Difference / trailingstep) - 0.5))
      newSL   = newSL + (trailingstep * Steps)
   ENDIF
ENDIF
//manage short positions
IF SHORTONMARKET THEN
   IF InitialSL = 0 THEN
      InitialSL = tradeprice(1) + mainSL
   ENDIF
   //first move (breakeven)
   Difference = tradeprice(1) - close
   IF newSL = 0 AND Difference >= trailingstart THEN
      //newSL = tradeprice(1) - trailingstep
	  Steps   = max(1,round((Difference / trailingstep) - 0.5))
	  newSL   = InitialSL - (trailingstep * Steps)
   ENDIF
   //next moves
   Difference = newSL - close
   IF newSL > 0 AND Difference >= trailingstep THEN
      Steps   = max(1,round((Difference / trailingstep) - 0.5))
      newSL   = newSL - (trailingstep * Steps)
   ENDIF
ENDIF
//stop order to exit the positions
IF newSL > 0 THEN
   SELL      AT newSL STOP
   EXITSHORT AT newSL STOP
ENDIF
//************************************************************************
but I remember backtesting it but never used it.
You can use it and test if it’s doing right. You just need to append it to your existng code and set the 3 initial values.
Cheers Robert
I’ll look at the logic of that trailing stop code, very usful. I’ve graphed a trailing stop that does what I expect it to do with a slightly smaller code, just need to apply it to a trailing stop value, I’ve yet to test out.
I’ll certainly look at that code, it’s using trailing values at first glance (not good risk management in my view as a trader) whereas I’m using technical highs and lows to trail… but some of the coding rationale/logic used in the code above is useful
thanks again…
I’ve had a few anomalies since coding, but in 2 weeks of commencement (I’m that new to coding my strategies) and doing the video course (the quiz doesnt work for some reason) managed to get 3 programs that seem to work well backtesting + The DAX KAMA program I tried and will trawl that code, but its giving me some anomalies when running it with different values for pip values when live, I’m now testing different combinations on a demo to see if its something simple, but it will be a while till I trawl the code as I’m helping my son with dissertation this week. When putting in £4 it runs, when putitng in £1 it doesnt. hmmm… I have it running on my live system at £4 and its working well, though trades outside of the time restrictions, I’m wondering whether its something related to that and perhaps the other codes are working properly as the time of the trades have been 0400hrs and yesterday eveneing, working well though, maybe I changed something wihtout realising.. (thats not a question by the way just a reflection on some current anomalies)
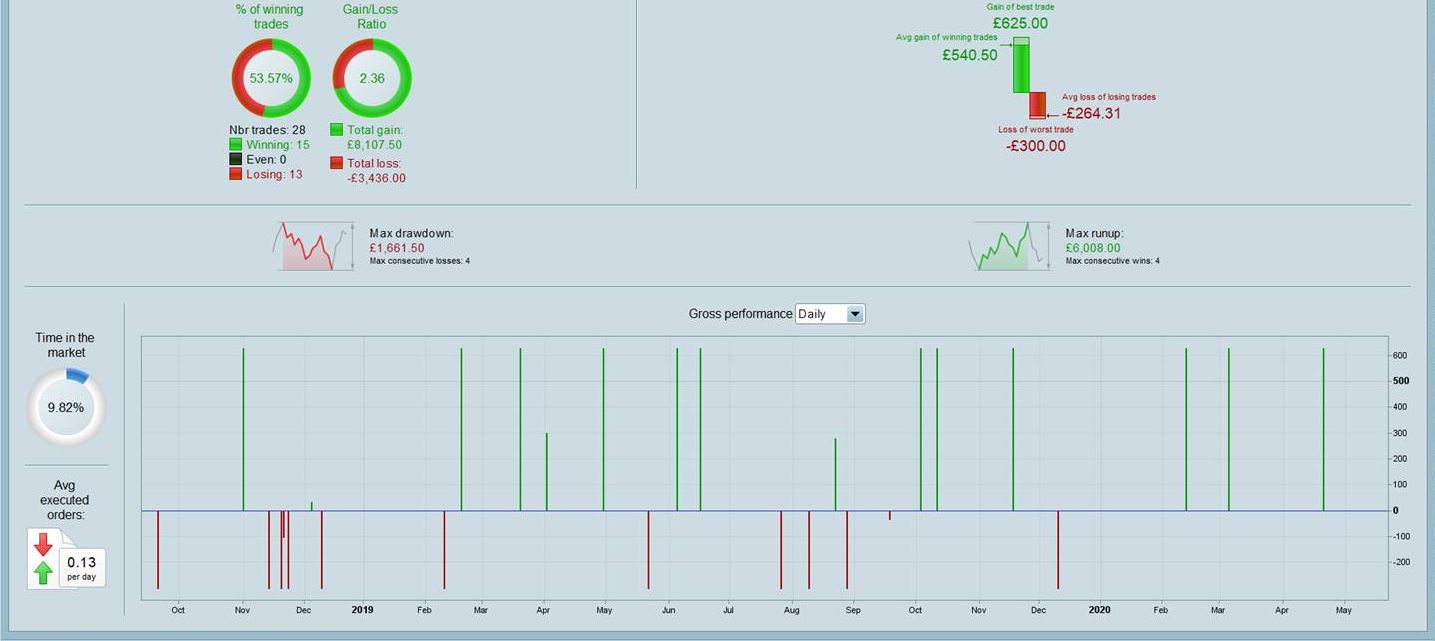
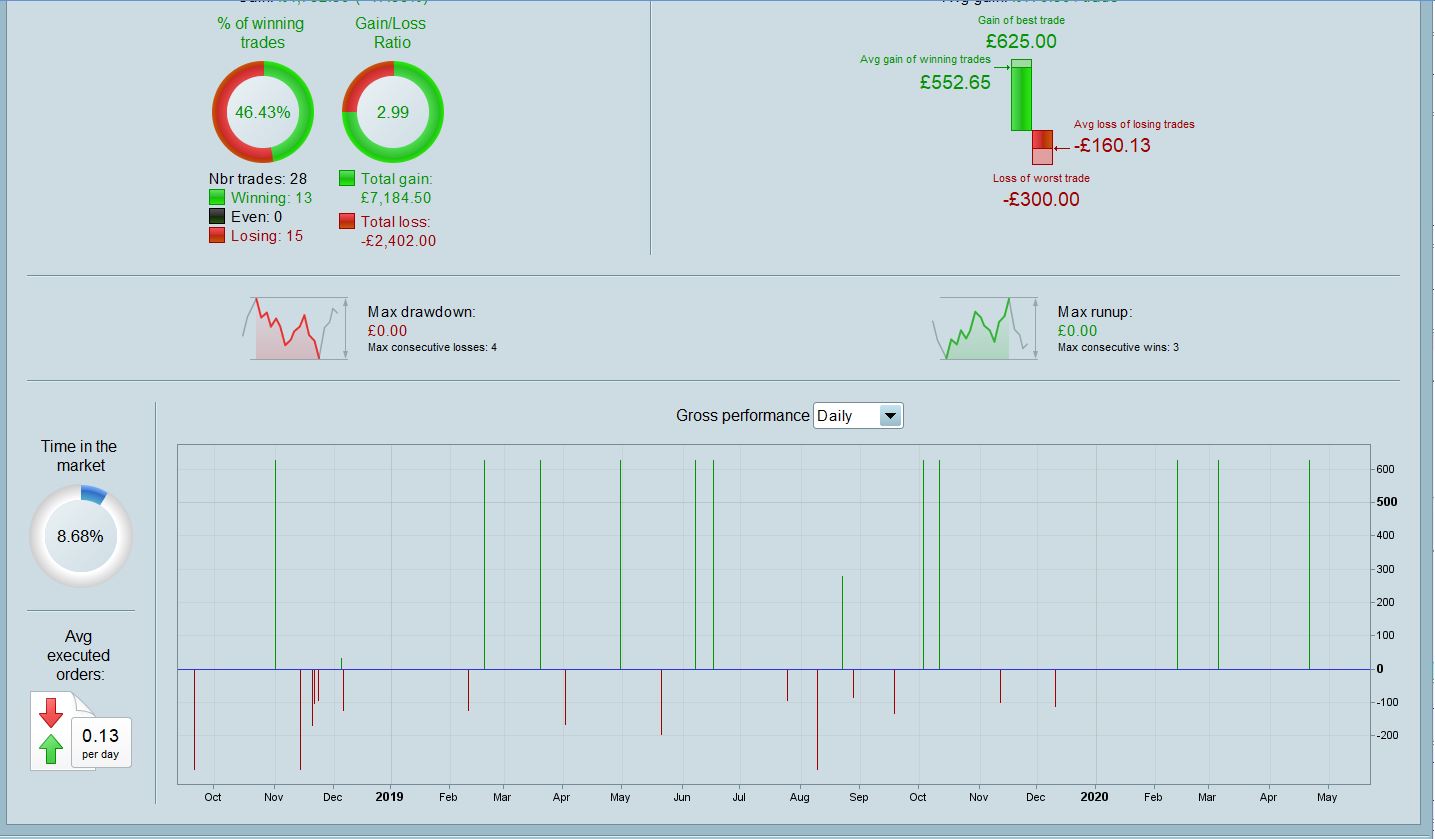
My change stoploss once a HH or LL is encountered seems to work on the pair its used on for the timeframes used, (its an mtf coding) as in pics attached but I’m yet to trawl it and double check that is what its actually doing, cos its not a trail, but a changed stoploss I think. Need to look at specific trade scenarios where its altered things and visualise what is going on..
Thanks again fo rthe support, copied that code to reference later – much appreciated again..
Do not pay attention to comments in my code, I left the original lines written by Nicolas, but I changed the code. There’s no BreakEven in my code (using Graph and GraphOnPrice you can easily spot this).