Hello
I am looking for an evaluation of the “quality” of algorithm.
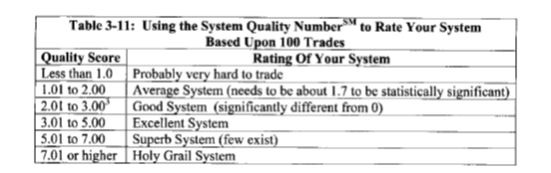
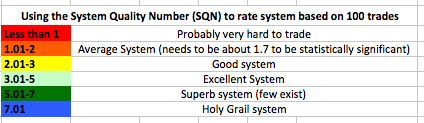
I have found System Quality Number metrics developped by Tharp.
Does someone used it for evaluation of his own algorithms or available strategy on the library?
Regards
Yannick
@Tharp please share some more information about the Tharp metrics. i.e. How it is used and calculated
@yannick the link doesn’t work. Can you maybe provide us with a few bullet points of the basics?
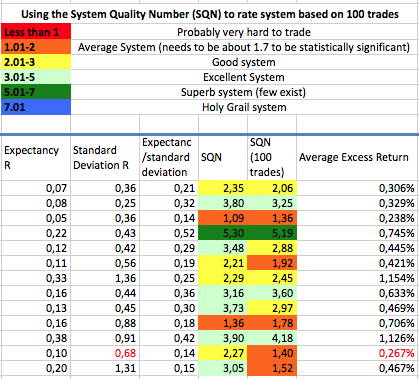
Hi Yannick! I use it on my systems and one easy way to calculate it is to drag the backtest history into excel and then follow his example from the book. It’s very helpful in order to separate good systems from less good systems even if the equity curve looks good to start with. The square root of 100 that he brings up in the book is much better than to use than all trades since a large number of trades gives a better result. But also watch out for systems with very few trades which can get a number which is not realistic. I have attached a picture for you to get an idea of how how it can be done in excel.
@victormork Thanks, have you already ranked some available strategies ?
@juanj
SQN= Squareroot(N) * Average (of the N Profit&Loss) / Std dev (of the N Profit&Loss).
The large the N, the more trading opportunities you have.
The large the average P&L, the better you are obviously.
The smaller the Std dev (P&L), the more regular are your results and the smaller are the drawdowns.
Note here that if you optimize for the largest SQN, you maximize in fact the product N*average P&L and you minimize the Std dev (P&L) and the drawdowns at the same time.
This is exactly what all good traders should be looking for their system
Yes I have. I do it for all strategies I consider to test.
Hi Victor
Is it possible to ask you to share what are the highest SQN algorithm in the library?
Thanks
I can’t possible answer that because I have not tested them all but if you wish for some direction I can say that the short side of rsi2 systems on forex 1h tf tend to score high. However I find these results a bit misleading due to the fact that mean reversal systems close out on pullback no matter if they are right or wrong. So the drawdown during open trades feels much worse than what the backrest shows. I would rather recommend some kind of breakout system with a hitrate above 55-60% and a gain/loss around 2 or higher if your are looking for a high sqn. But be aware that the same problem as I described for the rsi (small profit and large stop distance) can occur here too.
would be also interested if someone can get this book in a downlable free format;) Anyway, on this forum they talk about one concept from the book, the percent volatility model to determine the correct positions size.
https://futures.io/psychology-money-management/24374-vant-tharp-s-percent-volatility-position-sizing-fx-equation-please-anyone.html
Basically, this is:
positionsize=(equity*risk)/(daily ATR* contract value).
the code here below works fine on index:
TF=24//timeframe – 1H = 24
DailyRange=max(abs(Dhigh(1)-Dlow(1)),max(abs(Dhigh(1)-Dclose(2)),abs(Dlow(1)-Dclose(2))))
DailyATR=wilderaverage[20*TF](DailyRange)
PositionSize = round((equity*risk)/(DailyATR*pointvalue))
for fx: adapt the last line as following: PositionSize = round((equity*risk*pipsize)/(DailyATR*pointvalue))
I find this very usefull, also to compare correctly the robustness of one algo on multiple indexes without adapting manually the positionsize
Thanks! I didn’t know how to calculate that, even though I read van tarps theory’s about it.
Tharp has a lot of screenshots in his book from “Know you system software”. Obviously a program he uses to evaluate systems. This screenshots look AWESOME. I really would like to have this software but it says “Software not for sale”. 🙁
Isn’t here somebody with a black belt in excel who can reproduce something similar? My knowledge of Excel is extremely basic – insufficient to accomplish something like that.
Can someone explain again how you calculate sqn value? 1.73*g/divided by?
The best way is to use SQN over 100 trades which makes it more difficult to score a good value.
Summarise your expectancy of R and divide them by the standard deviation of R. For this step you can use all trades in your backtest.
Multiply the result with the square root of 100 and you are done.
I changed Van Tharp’s original equation a little bit since I feel the 100 trades cap is arbitrarily. I substitute instead the root of the average trades/year of the strategy. IMO this gives better and more comparable results.