Last night I was pondering over how to drill down re System Performance, I just about stopped myself ranting (again) about the lack of Analysis tools.
The last 2 weeks have seen sizable losses overall in my 100 Systems running in Demo. I wanted to know which Systems were profitable over the last 2 weeks!? No easy way available on the PRT Platform … unless I am missing a trick??
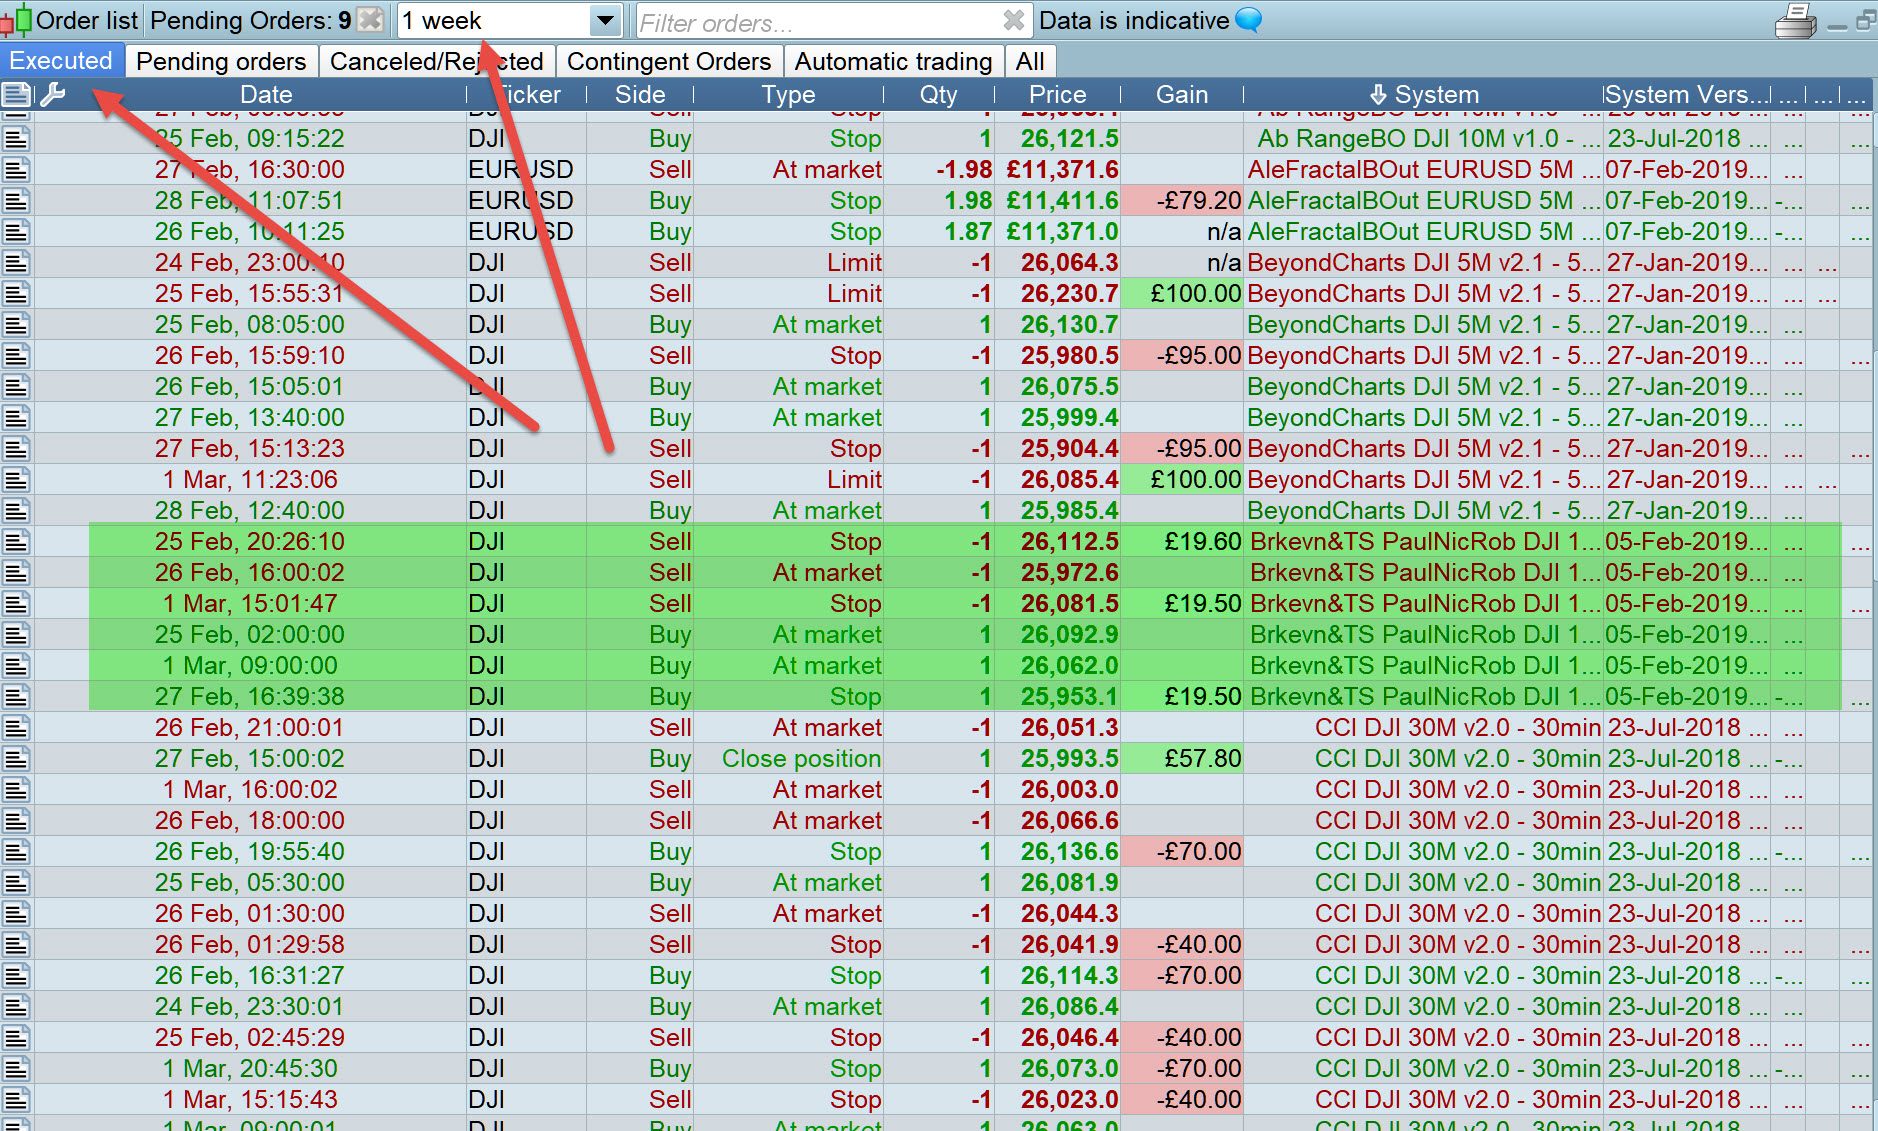
What I did was use the Orders Executed List, select 1 week and sort by System and visually scroll down the list until I spotted more greens than reds against respective Systems … attached illustrates.
Even doing above I had to get the calculator out to add up the figures and make Notes etc… seems loads less than a desirable way to Analyse Performance?
Also selecting 1 Week is not accurate anyway as this shows only Trades opened and closed in that same 1 Week (i.e. if a trade were opened in Week 12 and closed in Week 13 then it does not show when selecting 1 Week / Week 13!)
- Does anybody use any better / more effective method to drill down re System Performance?
- Do we know if Version 11 will offer effective System Performance Analysis Tools??
Thank You
GraHal
PS For reference, there’s a similar-ish post from @Ruark Baker on the link below asking about System Performance Analysis Tools …
https://www.prorealcode.com/topic/closed-automated-trades-reporting/