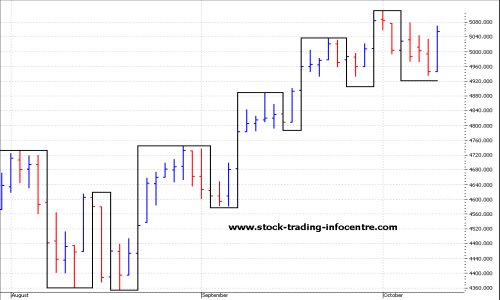
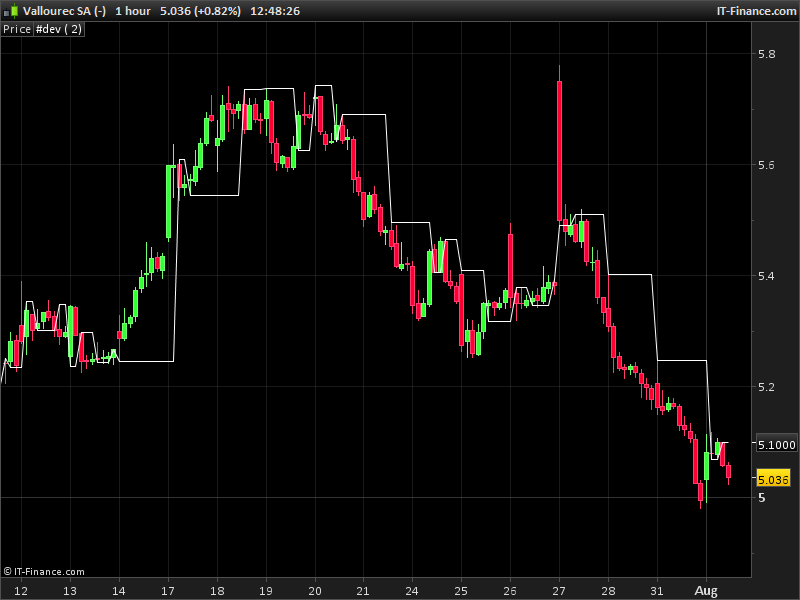
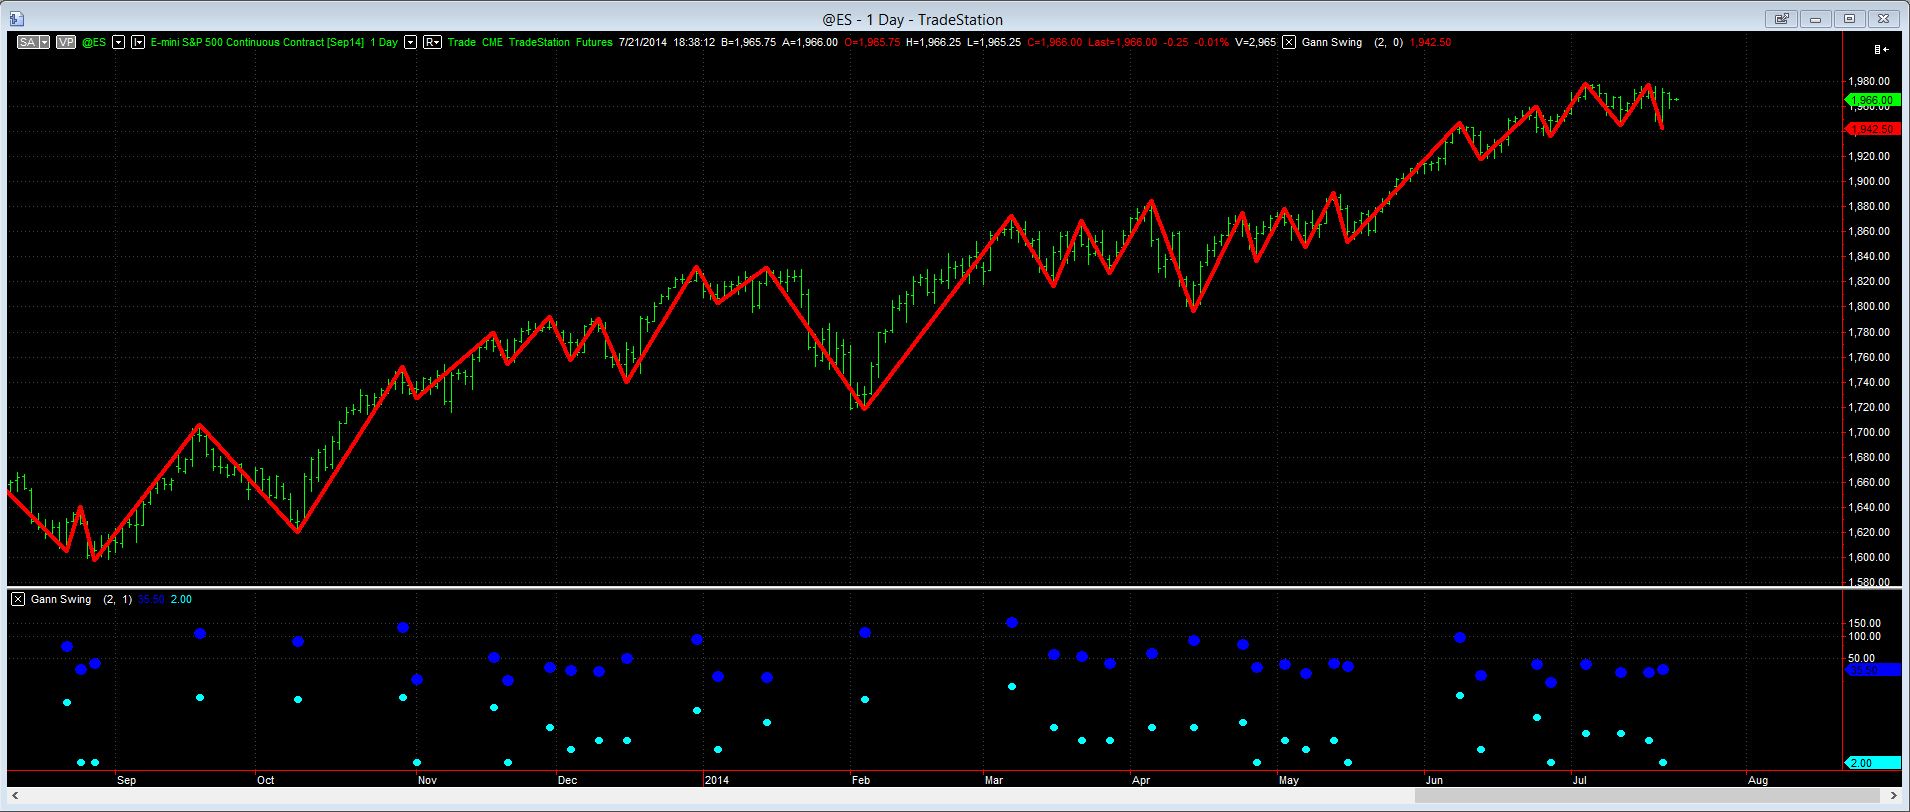
Buongiorno volevo sapere se è possibile avere gli Swing chart di Gann con la scelta di 1 o 2 o 3 giorni in cui lo swing si gira al rialzo o al ribasso
Puoi provare con questo codice che ho appena fatto. Non so se sono vicino all’indicatore originale o no, fai i tuoi test e consigli. Grazie.
È possibile modificare il conteggio della barra per cambiare la direzione di rotazione con il parametro “periodo” all’inizio del codice.
period = 2

once lastswing=0

if high>high[1] then
countH=countH+1
if countH>=period and lastswing<=0 then
swing = low//min(ll,low)
countH = 0
lastswing=1
endif
endif

if low<low[1] then
countL=countL+1
if countL>=period and lastswing>=0 then
swing = high//max(high,hh)
countL = 0
lastswing=-1
endif
endif

return swing
ciao grazie lo provo
però qual’è il percorso per incollare il codice. poi ho ancora una domanda sulle API posso chiedere a te?
 AVT
AVTParticipant
Senior
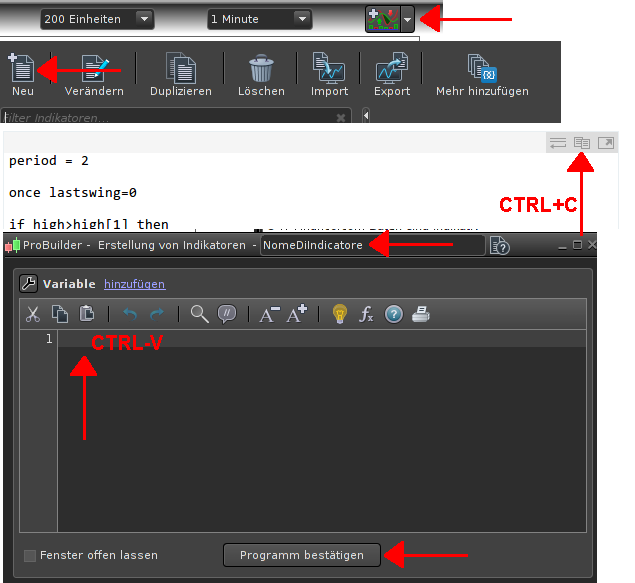
Italiano e difficile per me, ecco un imagine.
Spero che sia quello che vuoi.
Per copiare un testo seleziona quello che ti interessa poi premi CTRL+INS (o CTRL+C), infine posiziona il cursore dove vuoi incollarlo e premi CTRL+V.
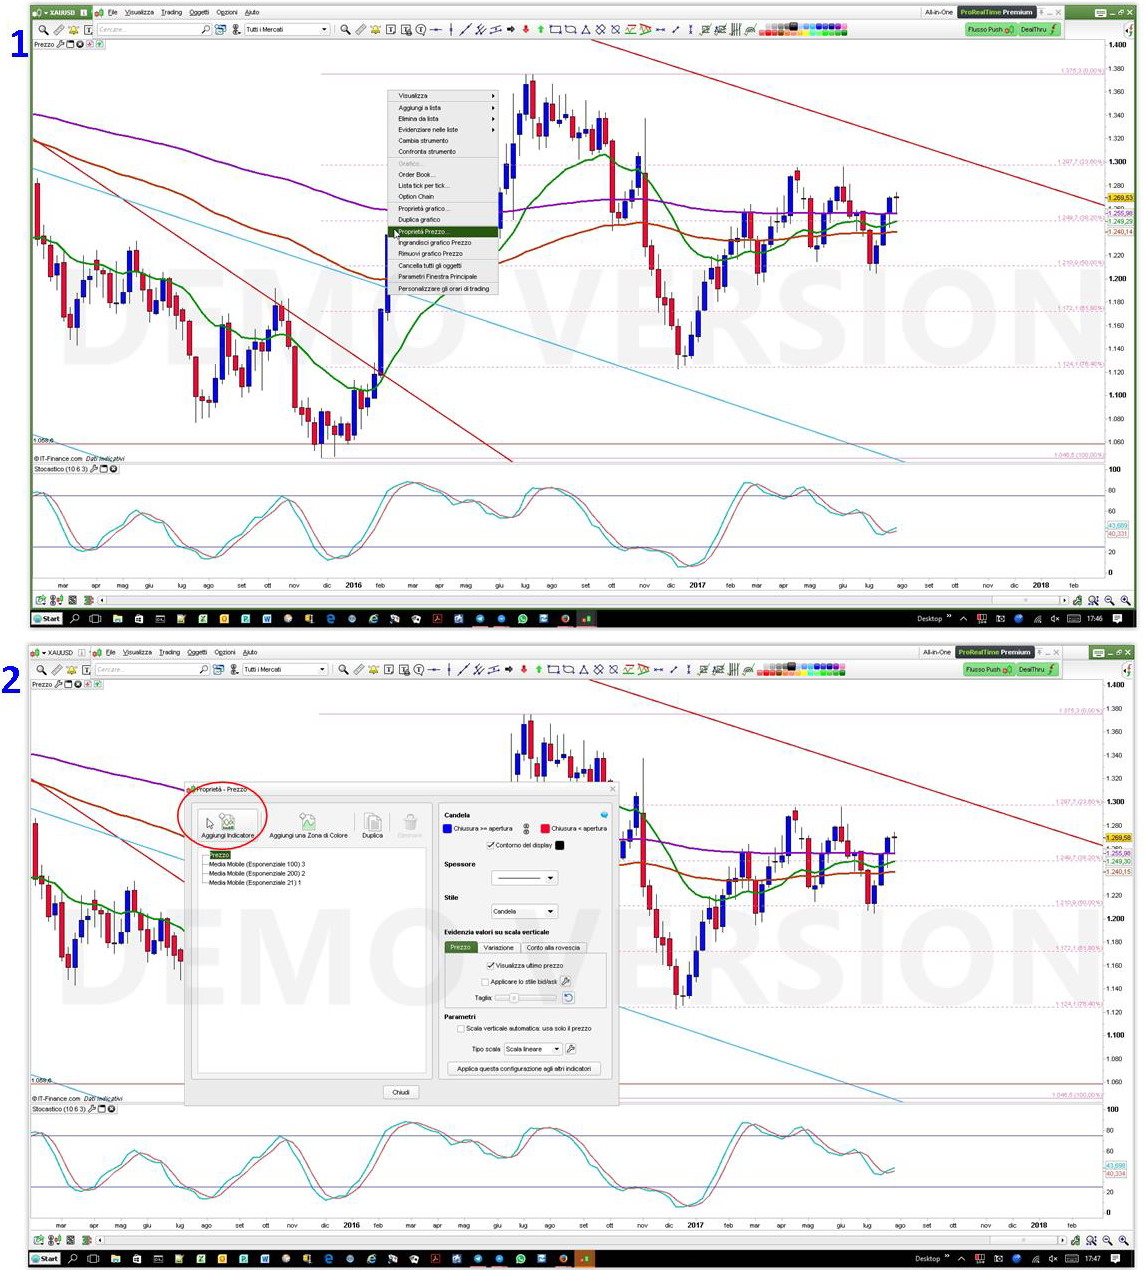
grazie avt. e se voglio posizionare l’indicatore direttamento sul grafico del prezzo cosa devo fare?
Innanzitutto posizionati sul grafico che ti interessa, poi fai click col pulsante destro del mouse e seleziona PROPRIETA’ PREZZO, dopodiché ti posizioni sulla voce PREZZO e clicchi in Alto a Sinistra.
Nell’immagine ti ho indicato i due semplici passi da fare.
Roberto
grazie nicolas mi sono permesso diu fare una modifica semplicissima
period = 2

once lastswing=0

if high>high[1] then
countH=countH+1
if countH>=period and lastswing<=0 then
swing = high//max(high,hh)
countH = 0
lastswing=1
endif
endif

if low<low[1] then
countL=countL+1
if countL>=period and lastswing>=0 then
swing = low//min(ll,low)
countL = 0
lastswing=-1
endif
endif

return swing
però il risultato sperato è ancora lontano e non so come modificare il codice
grazie avt. e se voglio posizionare l’indicatore direttamento sul grafico del prezzo cosa devo fare?
AVTParticipant
Senior
ciao ho trovato questo codice ma mi da degli errori
inputs: filter(2), stats(0);
vars  : xBar(0) , xHigh(0), xLow(0), xCount(0), xSwitch(0);
vars  : xSkip(0), xConfirm(0);
vars  : pBar(0) , pHigh(0), pLow(0);
vars  : bFirst(1);

if xSwitch = 0  then
 begin
  if High >= xHigh then
   begin
    xHigh  = High;
    xLow   = Low;
    xBar   = BarNumber;
    xSkip  = 0;
   end
  else
   begin
    xSkip  = xSkip + 1;
    if xSkip      >= filter then
     begin
       xConfirm    = 1;
       xCount      = 1;
       while xCount < filter
        begin
         if (Low[xCount] <= Low[xCount-1]) or (xLow <= Low[filter-1])
then
           begin
            xCount   = filter;
            xConfirm = 0;
           end;
         xCount      = xCount + 1;
        end;
       if xConfirm   = 1 then
        begin
          xSwitch = 1;
          if stats = 0 then
             plot1[BarNumber-xBar](xHigh,"Swing")
          else
           begin
            if bFirst = 0 then
             begin
               plot2[BarNumber-xBar](xHigh-pLow,"Range");
               plot3[BarNumber-xBar](xBar -pBar,"Duration");
             end;
             bFirst = 0;
           end;
          pHigh   = xHigh;
          pLow    = xLow;
          pBar    = xBar;
          xHigh   = High;
          xLow    = Low;
          xBar    = BarNumber;
          xSkip   = 0;
        end;
     end;
   end;
 end
else
 begin
  if Low <= xLow then
   begin
    xHigh = High;
    xLow  = Low;
    xBar  = BarNumber;
    xSkip = 0;
   end
  else
   begin
    xSkip = xSkip + 1;
    if xSkip >= filter then
     begin
      xConfirm = 1;
      xCount   = 1;
      while xCount < filter
        begin
         if (High[xCount] >= High[xCount-1]) or (xHigh >=
High[filter-1]) then
          begin
           xCount   = filter;
           xConfirm = 0;
          end;
         xCount   = xCount + 1;
        end;
      if xConfirm = 1 then
       begin
         xSwitch = 0;
         if stats = 0 then
           plot1[BarNumber-xBar](xLow,"Swing")
         else
          begin
           plot2[BarNumber-xBar](pHigh-xLow,"Range");
           plot3[BarNumber-xBar](xBar -pBar,"Duration");
          end;
         pHigh   = xHigh;
         pLow    = xLow;
         pBar    = xBar;
         xLow    = Low;
         xHigh   = High;
         xBar    = BarNumber;
         xSkip   = 0;
       end;
     end;
   end;
 end;

if ((date = lastcalcdate) and (time = lastcalctime)) then
 begin
  if xSwitch = 0 then
   begin
     if stats = 0 then
       plot1[BarNumber-xBar](xHigh,"Swing")
     else
       begin
         plot2[BarNumber-xBar](xHigh-pLow,"Range");
         plot3[BarNumber-xBar](xBar -pBar,"Duration");
       end;
   end
  else
   begin
     if stats = 0 then
       plot1[BarNumber-xBar](xLow,"Swing")
     else
       begin
         plot2[BarNumber-xBar](pHigh-xLow,"Range");
         plot3[BarNumber-xBar](xBar -pBar,"Duration");
       end;
   end;
 end;
Si possono risolvere gli errori???
e ho trovato questa versione in un vecchio forum italiano, è corretto secondo te?
// Swing di GANN
// dedicato a Katia
// creato da Luca De Florio per ProRealTime

if barindex=0 then
lasthigh=high
lastlow=low
oldrv=high
endif

// calcola le barre che hanno massimo e minimo piu' alto della precedente
if (high > lasthigh) AND (low > lastlow) then
rv = High[0]
lasthigh=rv
lastlow=low
lastrv=1
// Poi calcola le barre che hanno massimo e minimo piu' basso della precedente
elsif (high < lasthigh) AND (low < lastlow) then
rv = low[0]
lastlow=rv
lasthigh=high
lastrv=2
else

// nel caso di inside o outside, controlla la barra precedente,
// se era High prende il valore high, se era Low prende il valore Low

if lastrv=1 and high>lasthigh then
rv=high
lasthigh=high
lastlow= low
elsif lastrv=2 and low<lastlow then
rv=low
lasthigh=high
lastlow= low
else
rv=oldrv
endif

endif

// Solo nel caso della prima barra, si parte dall'High del giorno
oldrv=rv
return rv as "Swing"
ciao si l’ho provato e sembra funzionare.
mi sfugge il significato di rv e oldrv potresti illuminarmi?