Dear Nicolas, thank you in advance for your help on this. I would like the 4 main indicators of this strategy, published as a free MT4 code, to be converted into PRT codes.
I tried to edit/compile myself but has no knowledge in C language to proceed.
That system, and the related indicators, really looked interesting.
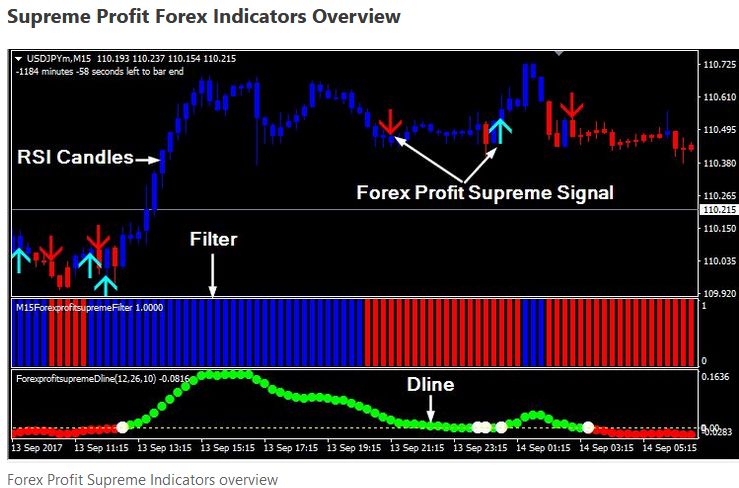
I attached the 4 indicators, and a screenshot of the chart from MT.
In short: when a blue arrow (bull signal) appears, AND is confirmed by the relevant RsiCandle color (blue), AND the Filter is blue, AND the DLine is green, then the signal is a valid buy.
But I feel confident to code this into PRT as a system once I will have your precious help creating the indicators above.
Again, thank you for your help.
Carl
I tried to attache a picture if the typical screen with those indicators but coulod not attach more than 4 files.
So, here it is in a new post.
Thank you,
Carl
First one is coloring bars depending of the RSI 21 periods OB/OS zones:
a = rsi[21]
oblevel = 50
oslevel = 50
if a>=oblevel then
drawcandle(open,high,low,close) coloured(0,0,255)
endif
if a<=oslevel then
drawcandle(open,high,low,close) coloured(255,0,0)
endif
return
second one is a basic MA cross signals indicator with some settings:
FastMA=5
FastMAshift=0
FastMAMethod=2
//0 = SMA 1 = EMA 2 = WMA 3 = Wilder 4 = Triangular 5 = End point 6 = Time series 7 = Hull (PRT v11 only) 8 = ZeroLag  (PRT v11 only)
SlowMA=13
SlowMAshift=0
SlowMAMethod=2

price = customclose
atr = AverageTrueRange[20](close)/2

fast = average[FastMA,FastMaMethod](price)[FastMAShift]
slow = average[SlowMA,SlowMaMethod](price)[SlowMAShift]

if fast crosses over slow then
drawarrowup(barindex,low-atr) coloured(0,255,255)
elsif fast crosses under slow then
drawarrowdown(barindex,high+atr) coloured(255,0,0)
endif

return
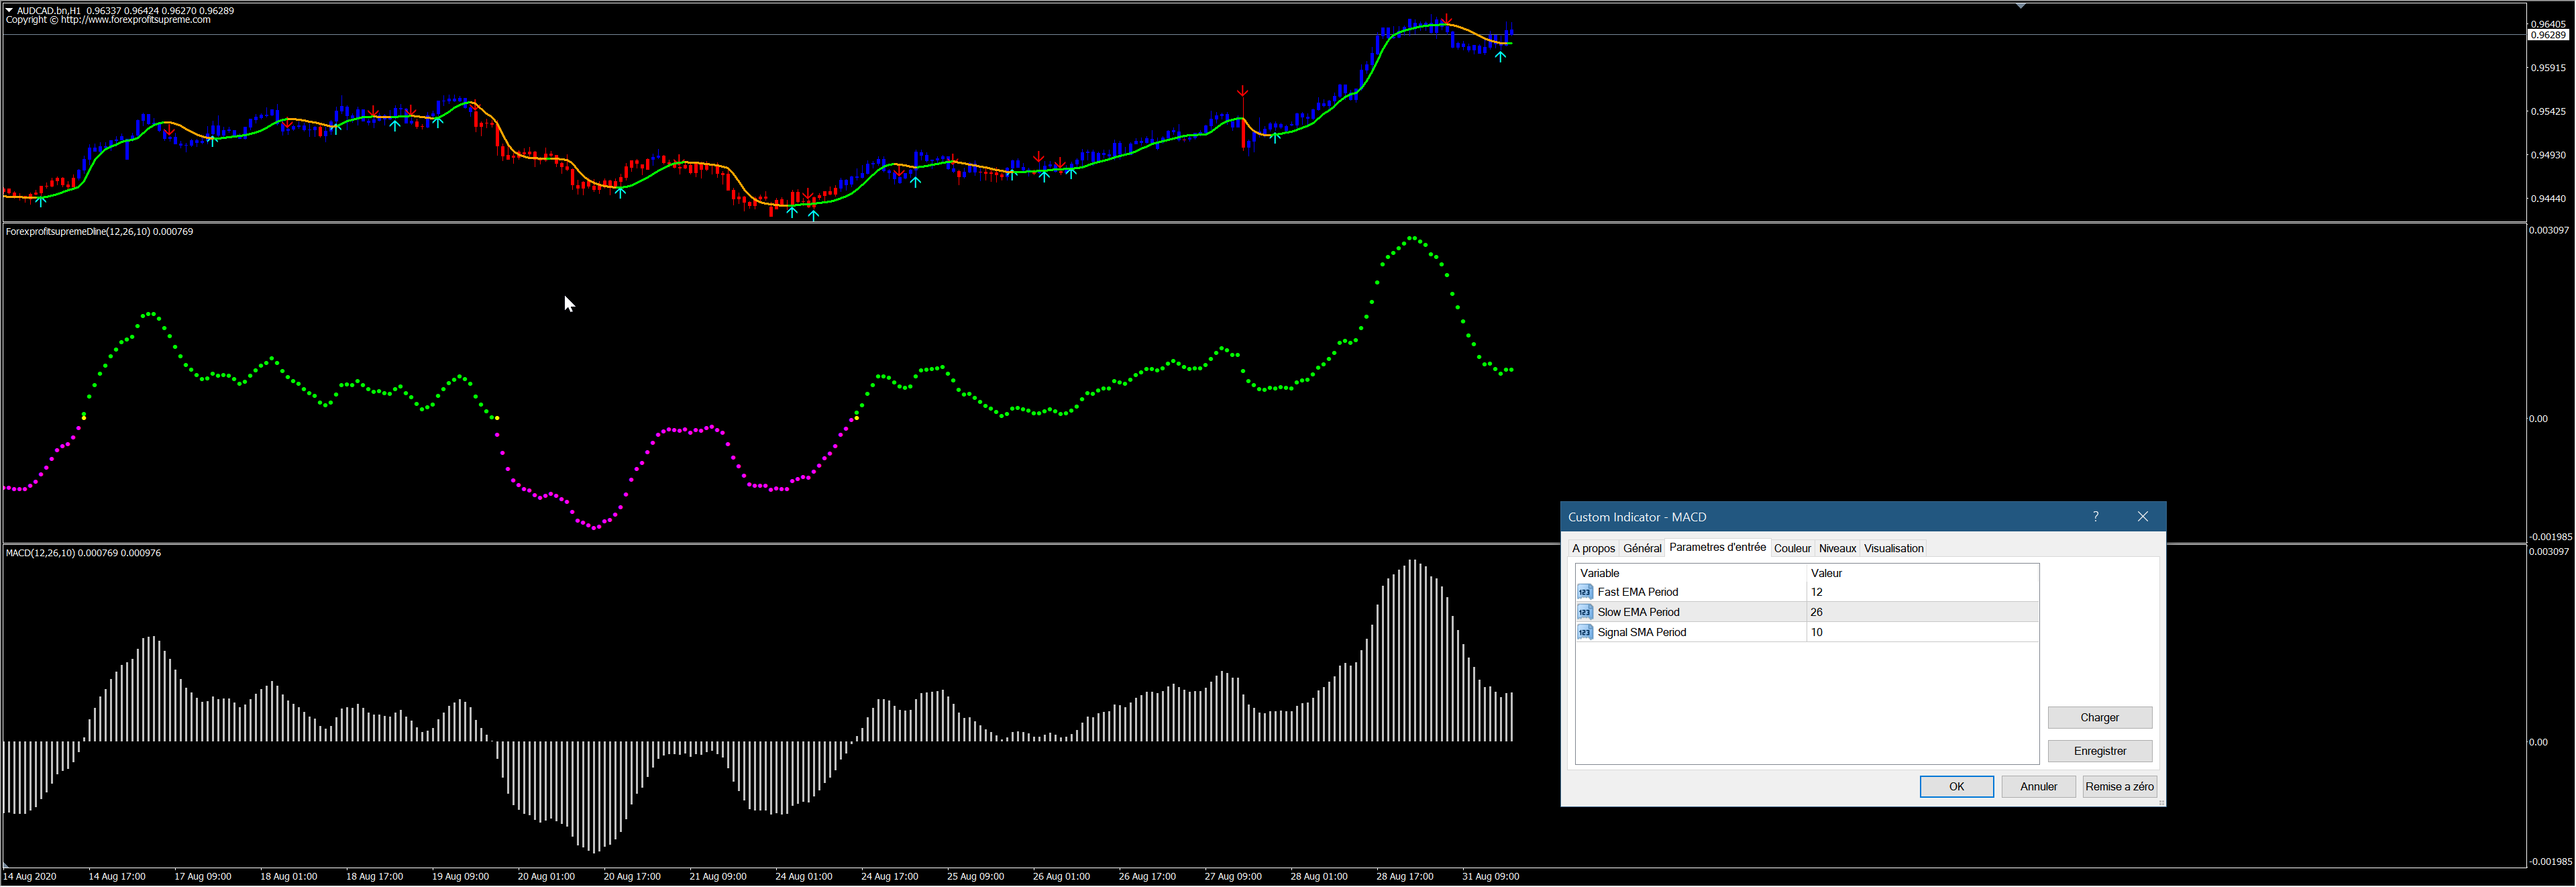
Dline indicator is a standard MACD histogram but plotted with dots. When the histogram crosses the zero line, the dot is yellow. Is it really essential to make a conversion for that? Above 0, the dots are green, otherwise they are violet.
No, absolutely not Nicolas. As I can’t read MT code I didn’t see it was a standard MACD – that one I will do by myself, thank you for noticing it.
Thank you for the other 2 indicators.
The Filter indicator is a decompiled code very hard to read, but I bet it is based upon the slope of a digital filter, such as a Jurik MA: https://www.prorealcode.com/topic/conversion-of-jurik-filter-from-mq4/#post-88081
Ok, great – I can take it from here, thanks again for your help.
There is indeed unnecessary code (Std dev upon the MACD), but I’m sure the dots are indeed the MT4 histogram of the MACD, see attached picture.
Yes, that really looks like a duplicate – nice comparison pic !
Nicolas, I just have one little question mark with the jurik code: what is “Series” in lines 39,40,41. It has not been defined prior I think, so I get an error msg.
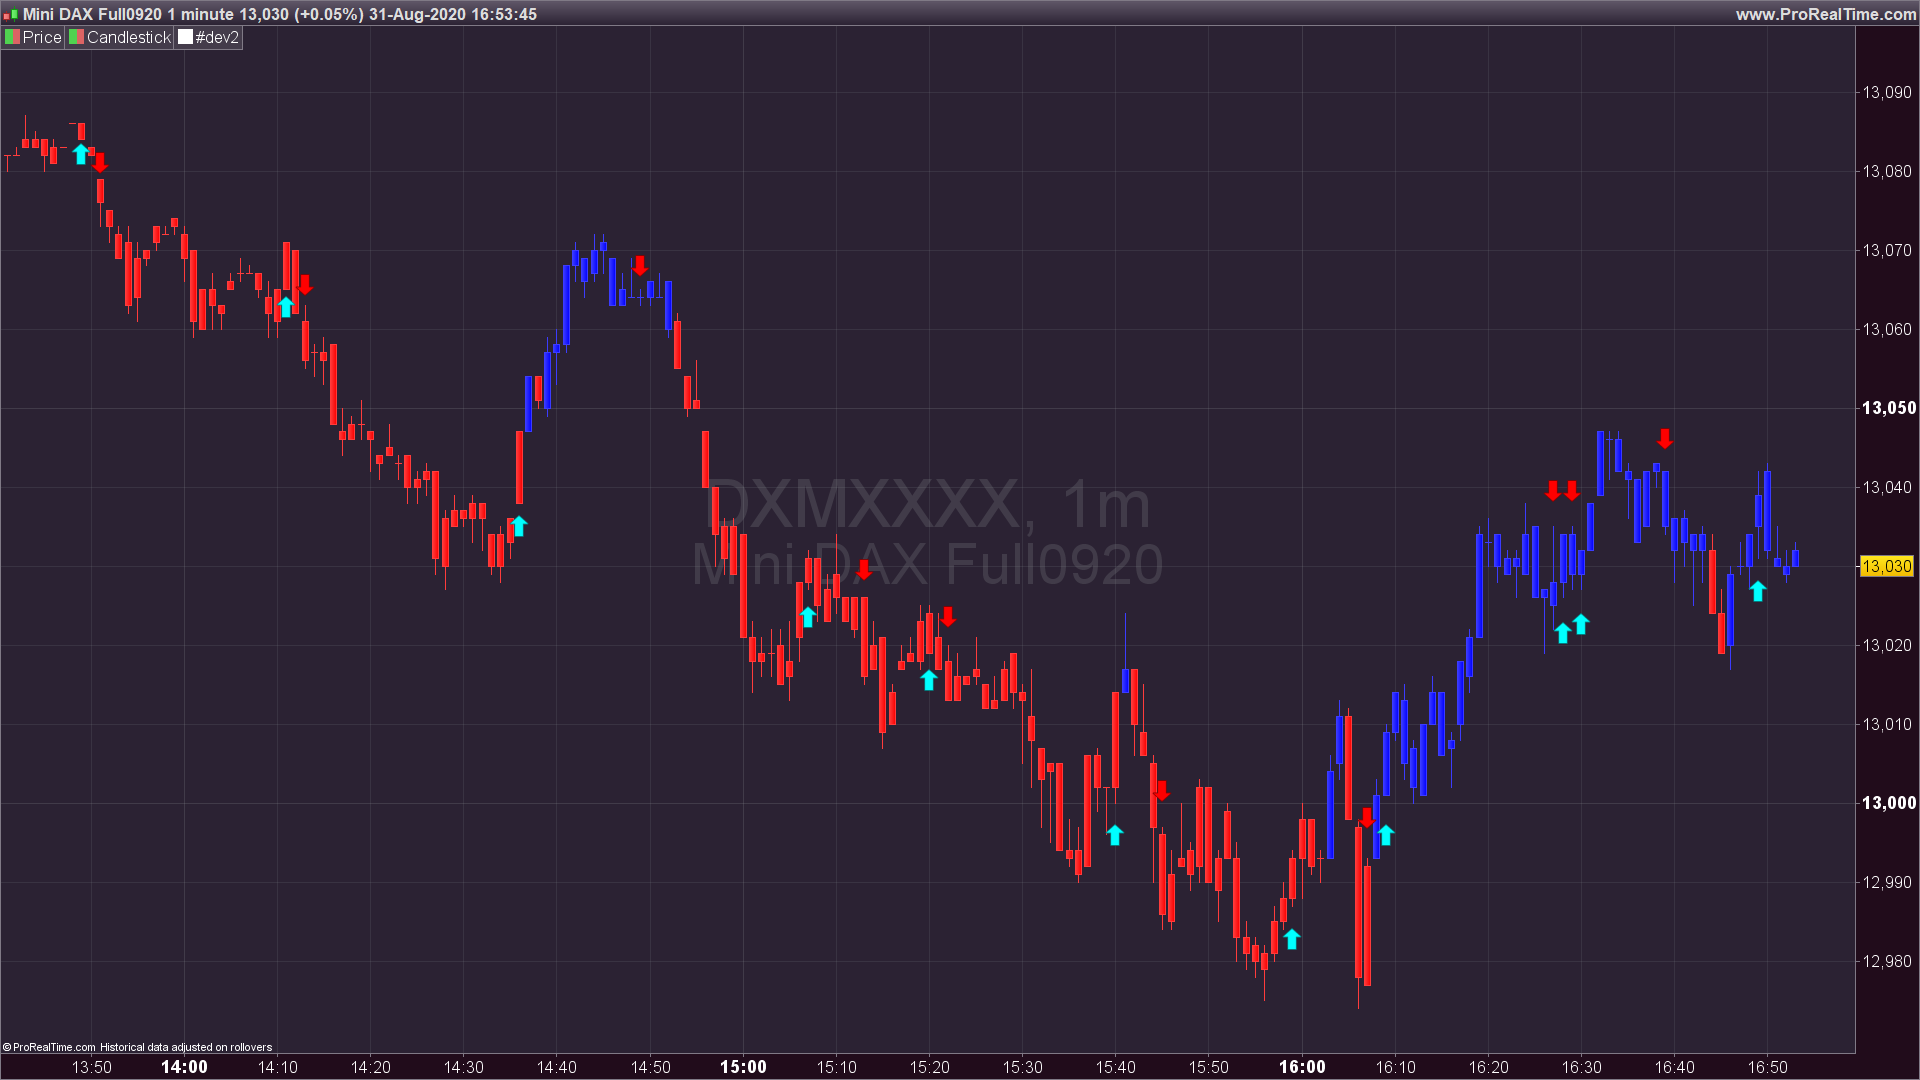
And then a very last one I promess: in the “SupremeBars” code based on RSI(21) the arrows appear on the chart but then they flicker and disappear/reappear all the time (lower time frames such as 1 minute). Perhaps something to add in the code to “stabilize” those nervous arrows?
the jurik code: what is “Series” in lines 39,40,41
You can add:
series=customclose
at the top of the code.
the arrows appear on the chart but then they flicker and disappear/reappear all the time
I think that you talk about the “signals” indicator. Arrows can appear/disappear on the current candle, as long as the candle is not closed, the conditions for them to appear can change.
Thank you Nicolas; all codes working fine now. About the “signal” indicator generating the arrows, no, in fact it is all arrows that are disappearing and reappearing all the time. But I just found the solution by adding DEFPARAM CalculateOnLastBars = 200 at the top of the code, and that seems to do the trick.