supporti e resistente

Viewing 5 posts - 1 through 5 (of 5 total)
  • Author
    Posts
  • #128867 quote
    Giovanni BelliGiovanni Belli
    Participant
    Average

    buonasera, è possibile programmare in automatico la formazione di linee di supporto e resistenza in modo da poterne usufruire nelle varie strategie di trading?

    grazie anticipatamente

    #128882 quote
    robertogozzirobertogozzi
    Moderator
    Legend

    Certo, questo è un indicatore che ho fatto https://www.prorealcode.com/prorealtime-indicators/pivot-support-resistance-zones/

    e può essere un valido esempio.

    Se cerchi Resistenze o Supporti troverai molti altri esempi e codici.

    #128937 quote
    Giovanni BelliGiovanni Belli
    Participant
    Average

    Grazie mille Roberto

    Buona giornata

    #128968 quote
    Giovanni BelliGiovanni Belli
    Participant
    Average

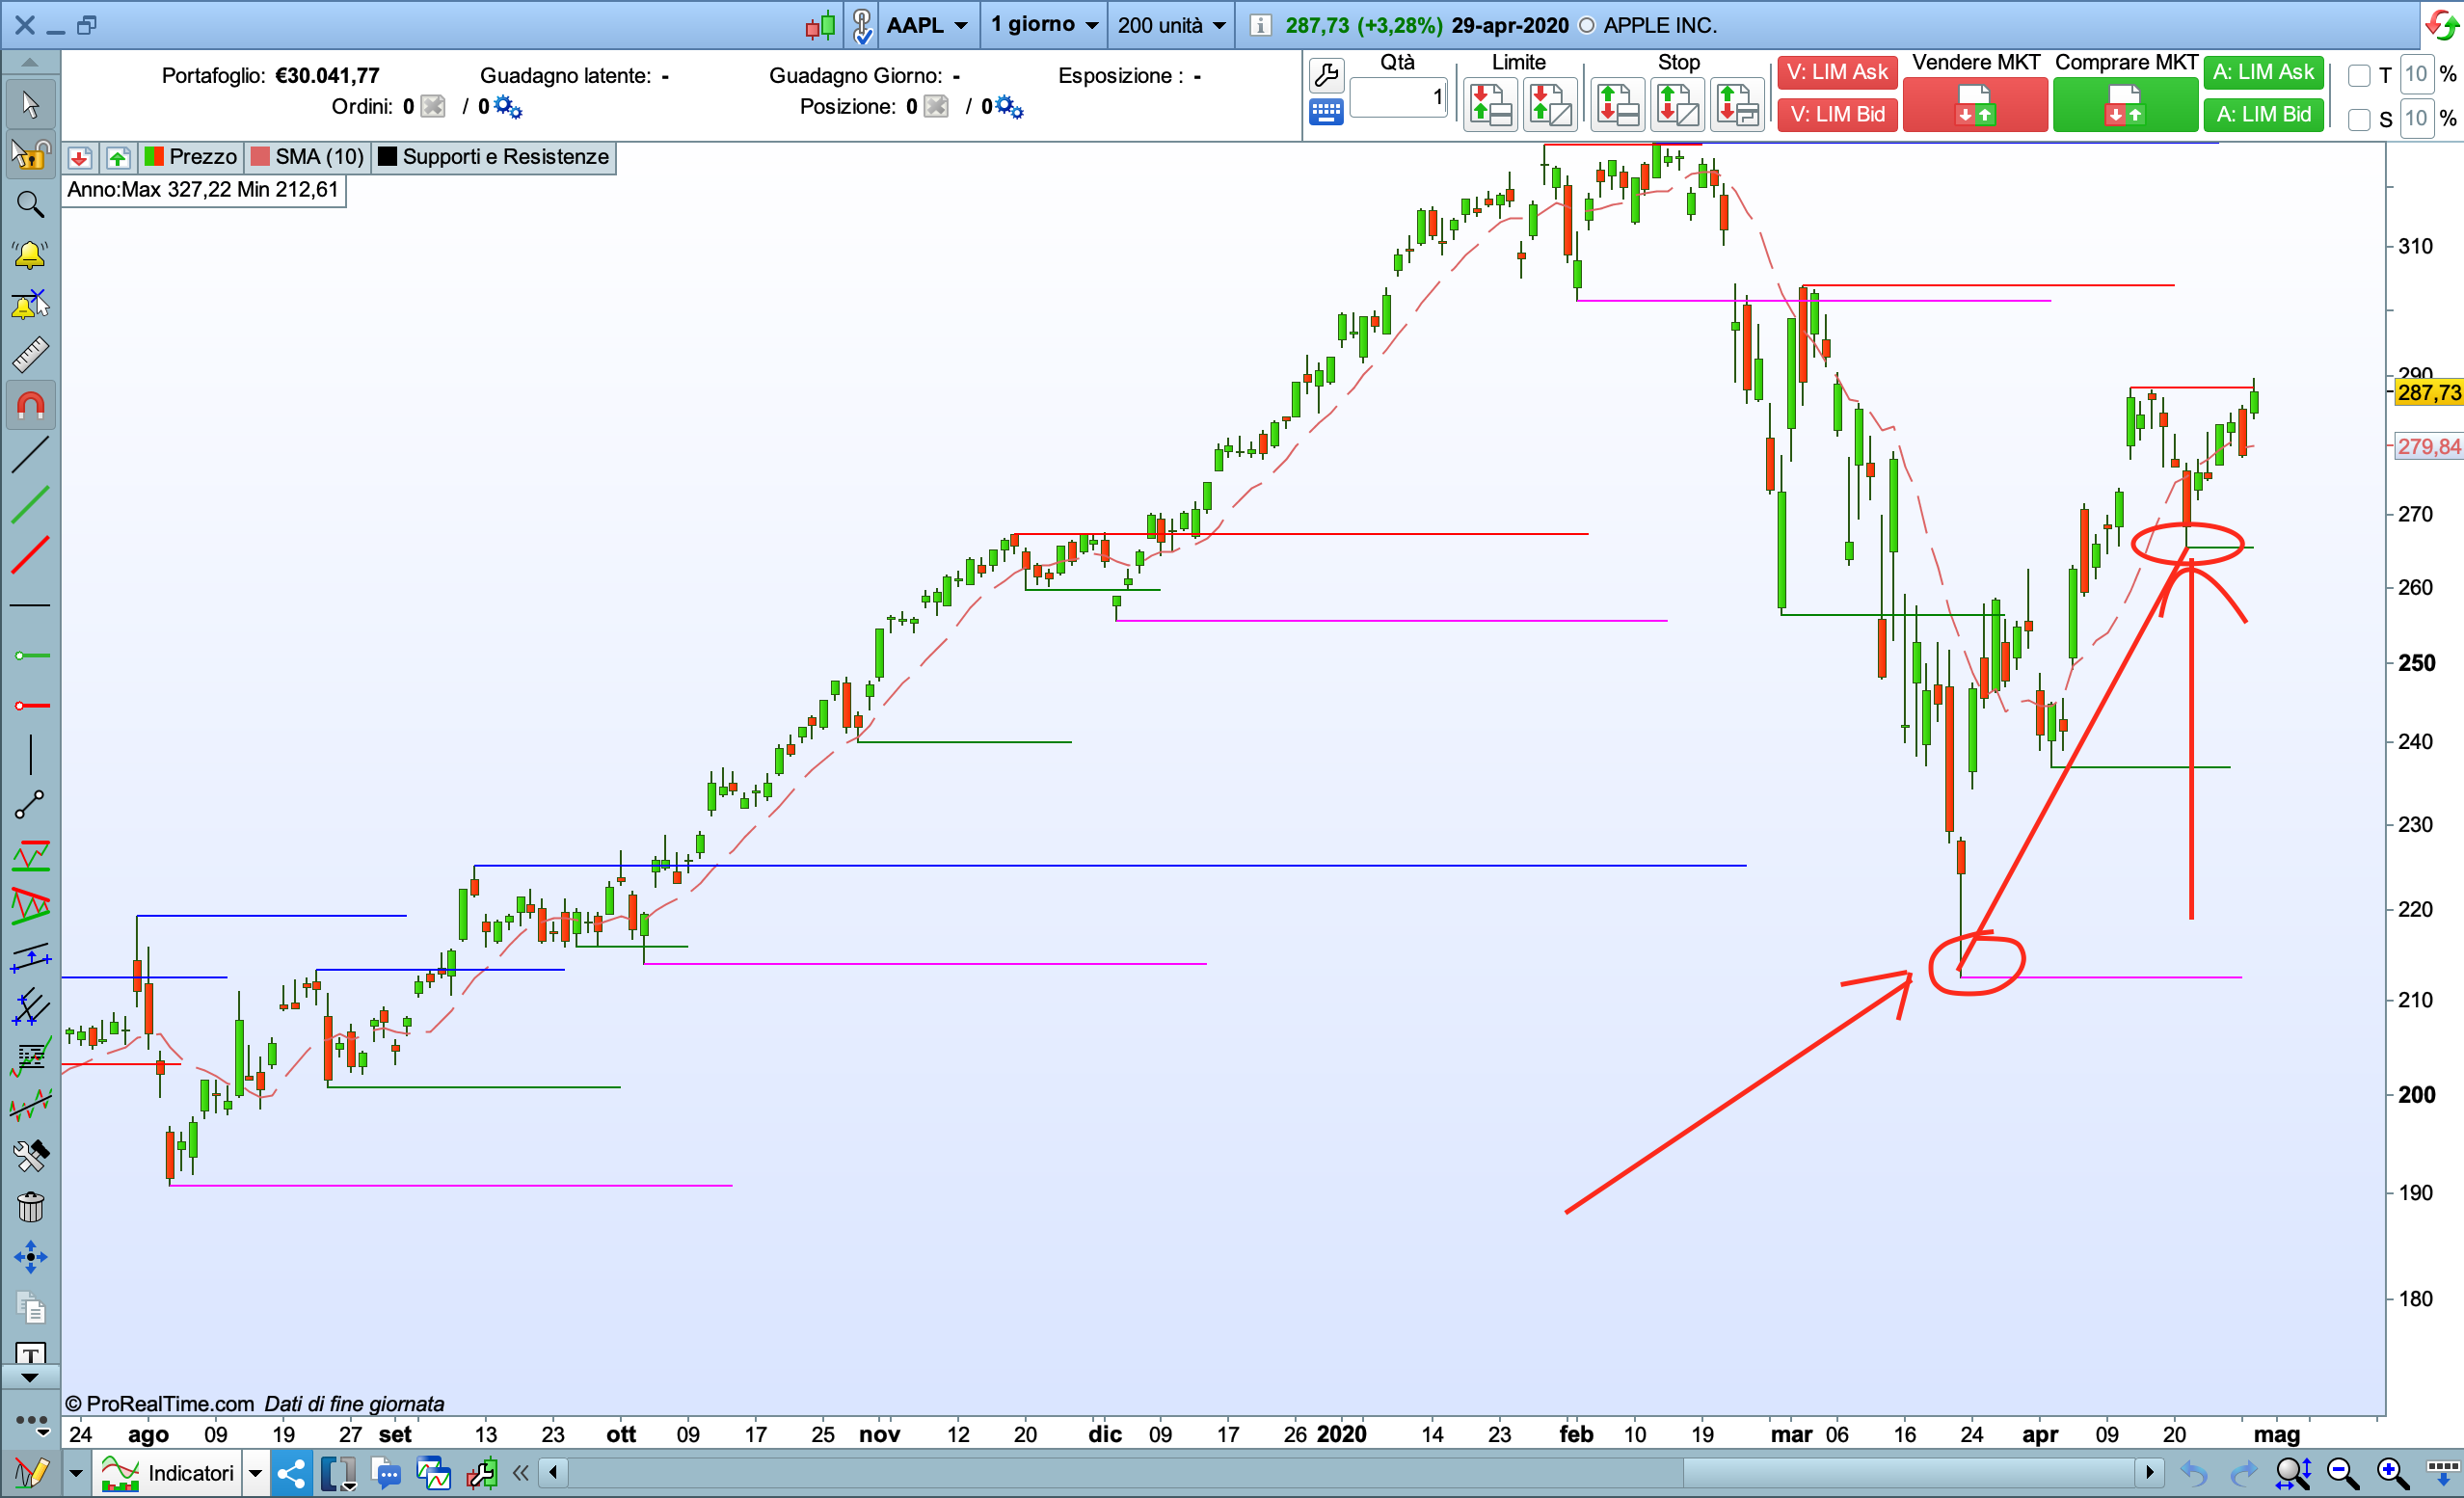
    Ho fatto in modo di avere due criteri diversi con identico programma , uno con PivotBar = 3 a l’altro con PivotBar = 5 (giusto come esempio).

    Ora la mia idea sarebbe quella di tracciare anche una Trend line tra i due minimi e i 2 massimi. Sapresti indicare come fare apparire solo l’ultimo segmento?

    Ti allego codice e immagine..


    DEFPARAM CalculateOnLastBars = 1000
    
    PivotBAR2 = 10 //2 bars AFTER pivot
    LookBack2 = 10 //3 bars BEFORE pivot
    
    BarLookBack2 = PivotBAR2 + 1
    IF low[PivotBAR2] < lowest[LookBack2](low)[BarLookBack2] THEN
    IF low[PivotBAR2] = lowest[BarLookBack2](low) THEN
    MySupport2 = BarIndex - PivotBAR2
    SupportPrice2 = low[PivotBAR2]
    ENDIF
    ENDIF
    IF high[PivotBAR2] > highest[LookBack2](high)[BarLookBack2] THEN
    IF high[PivotBAR2] = highest[BarLookBack2](high) THEN
    MyResistance2 = BarIndex - PivotBAR2
    ResistancePrice2 = high[PivotBAR2]//high[BarIndex - MyResistance]2
    ENDIF
    ENDIF
    
    DRAWSEGMENT(MyResistance2,ResistancePrice2,BarIndex[1],ResistancePrice2) COLOURED(0,0,255)
    DRAWSEGMENT(MySupport2,SupportPrice2,BarIndex[1],SupportPrice2) COLOURED(255,0,255)
    
    PivotBAR = 5 //2 bars AFTER pivot
    LookBack = 5 //3 bars BEFORE pivot
    
    BarLookBack = PivotBAR + 1
    IF low[PivotBAR] < lowest[LookBack](low)[BarLookBack] THEN
    IF low[PivotBAR] = lowest[BarLookBack](low) THEN
    MySupport = BarIndex - PivotBAR
    SupportPrice = low[PivotBAR]
    ENDIF
    ENDIF
    IF high[PivotBAR] > highest[LookBack](high)[BarLookBack] THEN
    IF high[PivotBAR] = highest[BarLookBack](high) THEN
    MyResistance = BarIndex - PivotBAR
    ResistancePrice = high[PivotBAR]//high[BarIndex - MyResistance]
    ENDIF
    ENDIF
    
    DRAWSEGMENT(MyResistance,ResistancePrice,BarIndex,ResistancePrice) COLOURED(255,0,0,255)
    DRAWSEGMENT(MySupport,SupportPrice,BarIndex,SupportPrice) COLOURED(0,128,0,255)
    
    RETURN

    Grazie come sempre

    Giovanni

    Schermata-2020-04-30-alle-11.36.54.png Schermata-2020-04-30-alle-11.36.54.png
    #128987 quote
    robertogozzirobertogozzi
    Moderator
    Legend

    Per stampare solu gli ultimo segmenti basta scivere, alla riga 2:

    DEFPARAM DrawOnLastBarOnly = true
Viewing 5 posts - 1 through 5 (of 5 total)
  • You must be logged in to reply to this topic.

ProRealAI ProRealAI New

Stuck on this ProBuilder code?

Describe what this topic is trying to build, in plain English, and ProRealAI writes the ProRealTime™ indicator, screener or system for you.

Available in 7 languages
Try ProRealAI

supporti e resistente


ProOrder: Trading Automatico & Backtesting

New Reply
Author
Summary

This topic contains 4 replies,
has 2 voices, and was last updated by robertogozzirobertogozzi
6 years, 5 months ago.

Topic Details
Forum: ProOrder: Trading Automatico & Backtesting
Language: Italian
Started: 04/29/2020
Status: Active
Attachments: 1 files
ProRealCode ProRealCode
Loading...