Hi Roberto,
Thanks a lot for your help!
Understood for the non time-based charts.
Yes I am aware it will rarely stop right on the limit, thanks
I still see one issue.
I have the feeling that the 100 euros daily limit is kind of used as a TP.
For example, when the day starts with a losing trade of let’s say 100 points and then there is an ongoing winning trade, it should go up to 200 points (go back to breakeven + make 100 in profit) and not stop at 100 points.
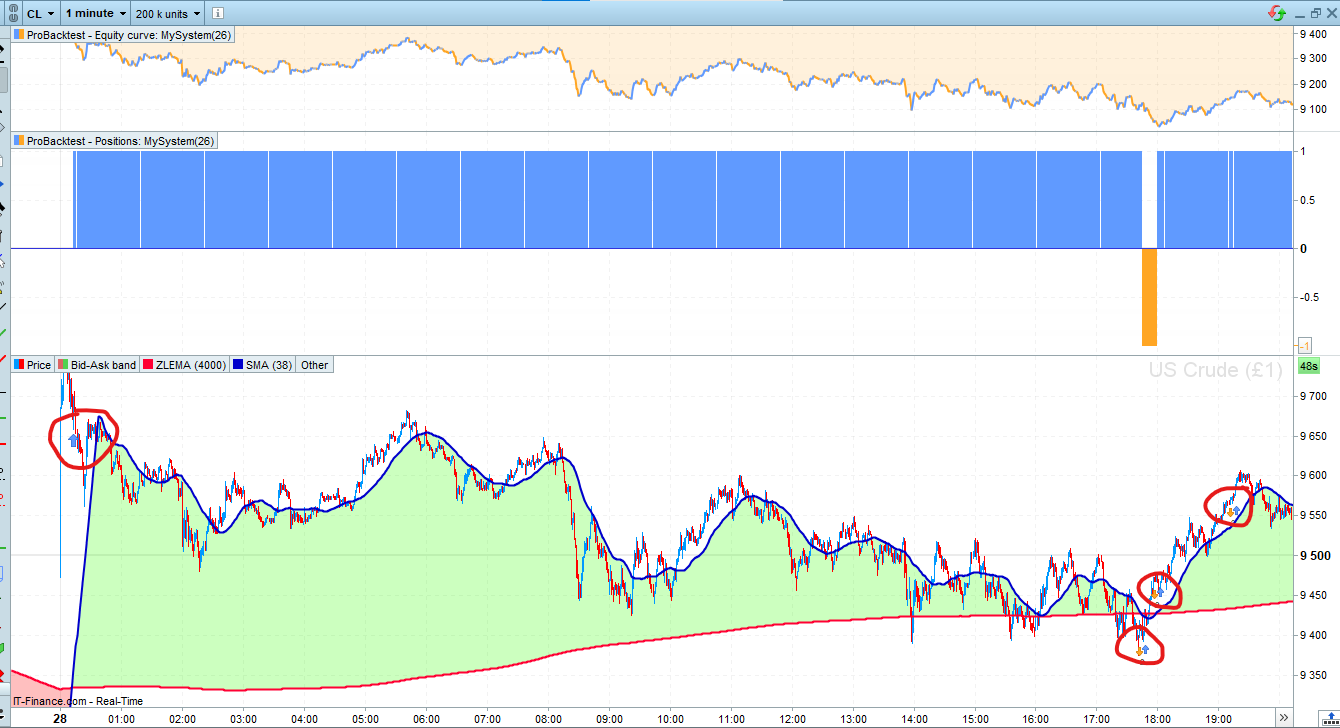
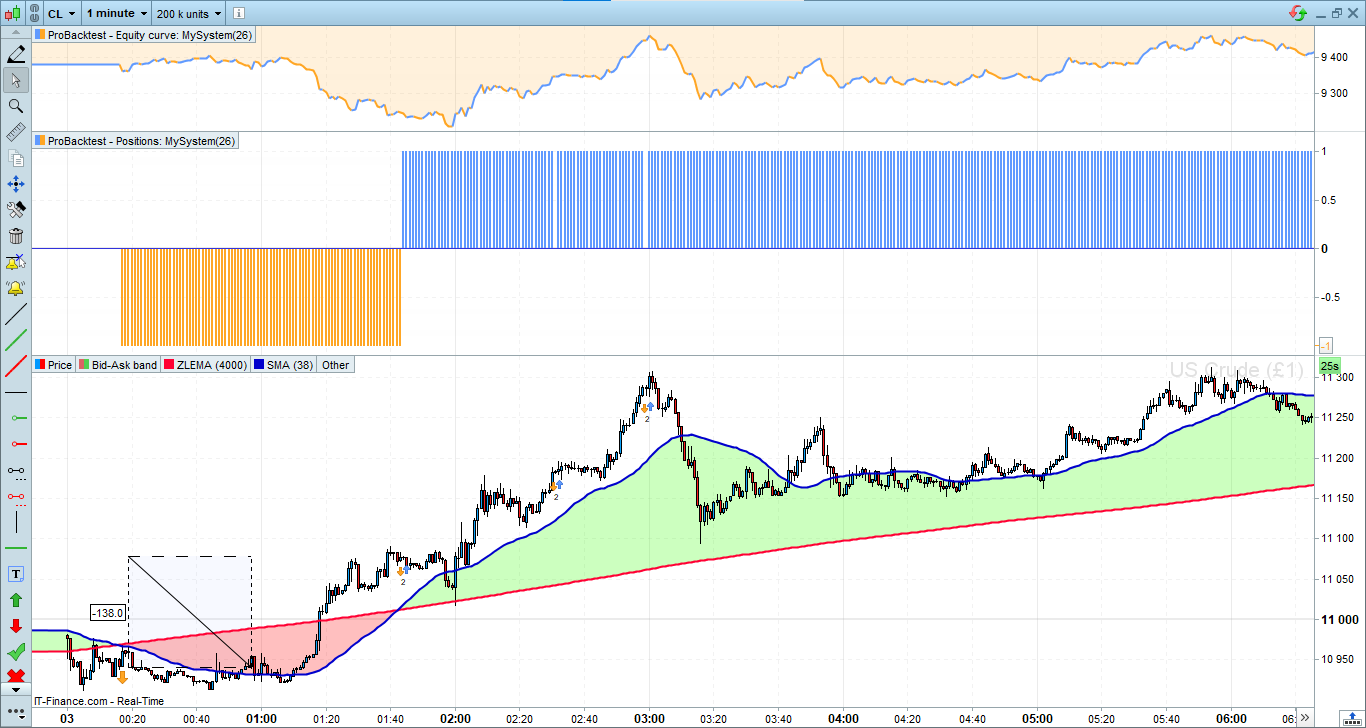
That is what happened on March 03/03. See attached.
Another example, on Graph 2802022, the last circled trade should not happen (it should go on until all the loss is compensated with the ongoing win + daily target profit.
I am not sure it is clear, please let me know if I need to elaborate.
Do you think that is possible to fix?
Enjoy your evening!
Jo
“I have the feeling that the 100 euros daily limit is kind of used as a TP“, yes, that’s correct, as you requested in your first post. I only forgot to disable trading after that. Now it’s working as desired.
As to doubling the TP after a loss… wel at a loss it stopped for that day.
What are you goals in case of either a
?
Hi Roberto,
“Now it’s working as desired”, you did not attach any code, did you change the latest one you sent?
I do not want to double the TP after a loss, maybe I should have taken a different number. I just want to take into account that loss(es) when deciding if the robot should continue trading.
For example, if the first trade was a loss of 35 points, it should try to get 135 points until the end of the day to be in profit of 100 points.
At any point in time, the robot should know where we are in terms of ongoing profit (gains/losses of previous trade + floating profit).
If the total loss of previous trades amounts for 32 points, it should go for 132 points.
If the total profit of previous trades amounts for 27 points, it should still go for 73 points. So if the current trade reaches 73 points, it should stop.
So total profit for the day will be 100.
I hope it makes more sens with different numbers.
So basically, the robot will never stop trading until it reaches the daily goal.
Is that possible?
Thanks again!
Jo
Sorry, I forgot to attach the modified code.
Now I added the last modifications requested, so that it keeps trading till 100 pips have been reached. Each new day it will restart from scratch:
DEFPARAM CumulateOrders = False
//
ONCE CrossOver = 0

IF IntraDayBarIndex = 0 THEN
CrossOver = 0
Tally     = 0
TradeON   = 1
ENDIF

Tally = Tally + ((StrategyProfit - StrategyProfit[1]) / PipValue)

indicator1 = ExponentialAverage[20](close)
indicator2 = ExponentialAverage[2000](close)

IF (indicator1 CROSSES OVER indicator2) OR (indicator1 CROSSES UNDER indicator2) THEN
CrossOver = 1
ENDIF

c1 = (indicator1 > indicator2)
c2 = (indicator1 < indicator2)

ONCE MyGOAL = 100                    //100 pips Daily
IF OnMarket AND (Tally + ((PositionPerf * PositionPrice / PipSize)) >= (MyGOAL * PipSize)) THEN
SELL      AT Market
EXITSHORT AT Market
TradeON = 0
ENDIF

// Formula floatingprofit
//floatingprofit = (((close-positionprice)*pointvalue)*countofposition)/pipsize

Timeframe (default)
//
// Conditions to enter long
IF NOT LongOnMarket AND c1 AND TradeON AND CrossOver THEN
BUY 1 CONTRACT AT MARKET
ENDIF
// Conditions to exit a buy position
If LongOnMarket AND c2 THEN
SELL AT MARKET
ENDIF
// Conditions to enter short
IF NOT ShortOnMarket AND c2 AND TradeON AND CrossOver THEN
SELLSHORT 1 CONTRACT AT MARKET
ENDIF
// Conditions to exit a sell position
IF ShortOnMarket AND c1 THEN
EXITSHORT AT MARKET
ENDIF
//
//graph floatingprofit
//graph Money
graph (Tally + (PositionPerf * PositionPrice / PipSize)) coloured(255,0,0,255)
graph TradeON
//graph c1
//graph c2
graphonprice indicator1 coloured(255,0,0,255) AS "Ema20"
graphonprice indicator2 coloured(0,0,255,255) AS "Ema200"
Thank you Roberto, I will have a look and get back to you if needed.
Enjoy your weekend!