Expert Services
 ProRealCode - Trading & Coding with ProRealTime™

No recent search
Supertrend on MTF
-
AuthorPosts
-
Hello everyone,
I would like to create an algo with the following functions (I tried to come up with something, see my code below).
Please note that I am a newbie in coding.BUY ORDER
ENTRY
2 conditions
>Price is above Supertrend (TF 30min)
>Previous candle closes above Supertrend (TF 1min)
EXIT
>Previous candle closes below Supertrend (TF 1min)SELL ORDER
ENTRY
2 conditions
>Price is below Supertrend (TF 30min)
>Previous candle closes below Supertrend (TF 1min)
EXIT
>Previous candle closes above Supertrend (TF 1min)OTHER: Stop the algo when earnings reach 100 points on the day.
There are 3 things I am struggling with
>Multi TimeFrame
> Use the indicator of the higher timeframe as a “constant”
> Code a daily max profitA couple questions
1. Multi TimeFrame
It seems my code below is not working, can someone please have a look? I can’t spot what is wrong2. Use the indicator of the higher timeframe as a “constant”
If we take a buy order for example, I would like to place a buy order only when the price crosses above the Supertrend M1 and is ALREADY above Supertrend M30.
I don’t want to enter long when the price crosses above the Supertrend M1 and then above the Supertrend M30
Same logic for a sell order but vice versa.
Is this the case here? If not, do you know how I could add this small difference?The Supertrend M30 should be a “constant” in the sense that the price is above or below the Supertrend M30 (except if price closes right on it)
So all buy orders will be placed when the price is above the Supertrend M30 and the candle closes > Supertrend M1
If the price goes back below the Supertrend M1 (still above the Supertrend M30), then we exit the trade. Later when it goes back above the Supertrend M1, we enter again to buy (if still above the Supertrend M30).My code below does not seem to work that way.
Is there a way to write “when price is above the supertrend” instead of “when price closes above the supertrend”?3. Code a daily max profit
What should I add for the maximum number of points per day (say 100)? (No more new trades if we have reached a gain of 100 points)Your help will be highly appreciated!!
Enjoy your day// Cumulating positions deactivated DEFPARAM CumulateOrders = False // Higher TimeFrame to indicate if we enter long or short on the lower TimeFrame Timeframe (30 minutes, updateonclose) // Variables indicator1 = SuperTrend[3,10] c1 = (close > indicator1) c2 = (close < indicator1) // Lower TimeFrame on which we enter long or short Timeframe (default) // Variables indicator2 = SuperTrend[3,10] c3 = (close > indicator2) c4 = (close < indicator2) // Conditions to enter long IF NOT LongOnMarket AND c1 AND c3 THEN BUY 1 CONTRACT AT MARKET ENDIF // Conditions to exit a buy position If LongOnMarket AND c4 THEN SELL AT MARKET ENDIF // Conditions to enter short IF NOT ShortOnMarket AND c2 AND c4 THEN SELL 1 CONTRACT AT MARKET ENDIF // Conditions to exit a sell position IF ShortOnMarket AND c3 THEN BUY AT MARKET ENDIFThere you go:
DEFPARAM CumulateOrders = False
//
Timeframe (30 minutes, updateonclose)
indicator1 = SuperTrend[3,10]
c1 = (close > indicator1)
c2 = (close < indicator1)
//
Timeframe (1 minute,UpdateOnClose)
indicator2 = SuperTrend[3,10]
c3 = close CROSSES OVER  indicator2
c3a= c1 AND c3
c4 = close CROSSES UNDER indicator2
c4a= c2 AND c4
//
Timeframe (default)
ONCETradeON = 1
IF IntradayBarIndex = 0 THEN
   TradeON  = 1
   MyProfit = STRATEGYPROFIT
   Pips     = 0
ENDIF
//
Pips = Pips + ((STRATEGYPROFIT - STRATEGYPROFIT[1]) / PipValue)
IF Pips >= 100 THEN
   TradeON = 0
ENDIF
// Conditions to enter long
IF NOT LongOnMarket AND c3a AND TradeON THEN
   BUY 1 CONTRACT AT MARKET
ENDIF
// Conditions to exit a buy position
If LongOnMarket AND c4 THEN
   SELL AT MARKET
ENDIF
// Conditions to enter short
IF NOT ShortOnMarket AND c4a AND TradeON THEN
   SELLSHORT 1 CONTRACT AT MARKET
ENDIF
// Conditions to exit a sell position
IF ShortOnMarket AND c3 THEN
   EXITSHORT AT MARKET
ENDIF
//graph Pips        coloured(255,0,0,255)
//graph Pips >= 100 coloured(0,0,255,255)
I want to point out that:
– to enter a LONG trade you have to use BUY
– to exit a LONG trade you have to use SELL
– to enter a SHORT trade you have to use SELLSHORT
– to exit a SHORT trade you have to use EXITSHORT.Jodal and Midlanddave thanked this postHi Roberto,
Wow … I can’t thank you enough, thank you for your help and reactivity…….
I really appreciate it
I will test it :))))
Hi Roberto,
I would like your advice on the code below.
I used the same “principles” as you did above for the Supertrend indicator.
Now the logic is the same but with 2 changes:1. Indicators are EMAs
2. I want to add the latent gain/loss in the equation.(I don’t know if I had to create a new topic because it was related to your previous answer, so I put it here.)
Do you spot what is wrong in the code below?
It is not entering and exiting the way I want it to.Thanks
Enjoy your dayDEFPARAM CumulateOrders = False // // Here I want the code to be updated at every 1-minute bar, so I removed "updateonclose" in the higher timeframe, is that correct? Timeframe (30 minutes) indicator1 = ExponentialAverage[100](close) c1 = (close > indicator1) c2 = (close < indicator1) // Timeframe (1 minute,UpdateOnClose) indicator2 = ExponentialAverage[20](close) c3 = close CROSSES OVER indicator2 c3a= c1 AND c3 c4 = close CROSSES UNDER indicator2 c4a= c2 AND c4 // I added the latent gain component in "Myprofit" because I want the robot to stop at the close of the current 1-minute bar as soon as we reach 100 points in daily profit . // Formula floatingprofit floatingprofit = (((close-positionprice)*pointvalue)*countofposition)/pipsize Timeframe (default) ONCETradeON = 1 IF IntradayBarIndex = 0 THEN TradeON = 1 MyProfit = (STRATEGYPROFIT+floatingprofit) Pips = 0 ENDIF // Here below I replaced STRETAGYPROFIT by MyProfit. I don't know if I should change STRATEGYPROFIT[1]? Pips = Pips + ((MyProfit - STRATEGYPROFIT[1]) / PipValue) IF Pips >= 100 THEN TradeON = 0 ENDIF // Conditions to enter long IF NOT LongOnMarket AND c3a AND TradeON THEN BUY 1 CONTRACT AT MARKET ENDIF // Conditions to exit a buy position If LongOnMarket AND c4a THEN SELL AT MARKET ENDIF // Conditions to enter short IF NOT ShortOnMarket AND c4a AND TradeON THEN SELLSHORT 1 CONTRACT AT MARKET ENDIF // Conditions to exit a sell position IF ShortOnMarket AND c3a THEN EXITSHORT AT MARKET ENDIFI also tried with the code below but not working either.
Happy to read your take on that.
Thank you!
DEFPARAM CumulateOrders = False // // Here I want the code to be updated at every 1-minute bar, so I removed "updateonclose" in the higher timeframe, is that correct? Timeframe (30 minutes) indicator1 = ExponentialAverage[100](close) // Timeframe (1 minute,UpdateOnClose) indicator2 = ExponentialAverage[20](close) c1 = (indicator1 > indicator2) c2 = (indicator1 < indicator2) // I added the latent gain component in "Myprofit" because I want the robot to stop at the close of the current 1-minute bar as soon as we reach 100 points in daily profit . // Formula floatingprofit floatingprofit = (((close-positionprice)*pointvalue)*countofposition)/pipsize Timeframe (default) ONCETradeON = 1 IF IntradayBarIndex = 0 THEN TradeON = 1 MyProfit = (STRATEGYPROFIT+floatingprofit) Pips = 0 ENDIF // Here below I replaced STRETAGYPROFIT by MyProfit. I don't know if I should change STRATEGYPROFIT[1]? Pips = Pips + ((MyProfit - STRATEGYPROFIT[1]) / PipValue) IF Pips >= 100 THEN TradeON = 0 ENDIF // Conditions to enter long IF NOT LongOnMarket AND 1 AND TradeON THEN BUY 1 CONTRACT AT MARKET ENDIF // Conditions to exit a buy position If LongOnMarket AND c2 THEN SELL AT MARKET ENDIF // Conditions to enter short IF NOT ShortOnMarket AND c2 AND TradeON THEN SELLSHORT 1 CONTRACT AT MARKET ENDIF // Conditions to exit a sell position IF ShortOnMarket AND c1 THEN EXITSHORT AT MARKET ENDIFHi @<span class=”bbp-author-name”>robertogozzi</span>,
Do you have any idea about the code to incorporate the latent gain? (strategy profit + floating profit)
So I do not wait for the “exit condition” to exit the trade. It will go out automatically when I reach my daily goal at the end of the current 1-minute bar.
Please let me know if you need any additional information.
Thank you
Jo
There you go:
DEFPARAM CumulateOrders = False
//
// Here I want the code to be updated at every 1-minute bar, so I removed "updateonclose" in the higher timeframe, is that correct?
Timeframe (30 minute, updateonclose)
indicator1 = ExponentialAverage[100](close)

c1 = (close > indicator1)
c2 = (close < indicator1)

//
Timeframe (1 minute,UpdateOnClose)

ONCE MyGOAL = 100             //100 currency units (be them Euros, US dollars or alse
IF OnMarket AND ((PositionPerf * PositionPrice * PipValue) >= MyGOAL) THEN
SELL      AT Market
EXITSHORT AT Market
ENDIF

indicator2 = ExponentialAverage[20](close)

c3 = close CROSSES OVER  indicator2
c3a= c1 AND c3
c4 = close CROSSES UNDER indicator2
c4a= c2 AND c4

// I added the latent gain component in "Myprofit" because I want the robot to stop at the close of the current 1-minute bar as soon as we reach 100 points in daily profit .

// Formula floatingprofit
floatingprofit = (((close-positionprice)*pointvalue)*countofposition)/pipsize

Timeframe (default)
//
ONCETradeON = 1
IF IntradayBarIndex = 0 THEN
TradeON = 1
MyProfit = (STRATEGYPROFIT+floatingprofit)
Pips = 0
ENDIF
// Here below I replaced STRETAGYPROFIT by MyProfit. I don't know if I should change STRATEGYPROFIT[1]?
Pips = Pips + ((MyProfit - STRATEGYPROFIT[1]) / PipValue)
IF Pips >= 100 THEN
TradeON = 0
ENDIF
// Conditions to enter long
IF NOT LongOnMarket AND c3a AND TradeON THEN
BUY 1 CONTRACT AT MARKET
ENDIF
// Conditions to exit a buy position
If LongOnMarket AND c4a THEN
SELL AT MARKET
ENDIF
// Conditions to enter short
IF NOT ShortOnMarket AND c4a AND TradeON THEN
SELLSHORT 1 CONTRACT AT MARKET
ENDIF
// Conditions to exit a sell position
IF ShortOnMarket AND c3a THEN
EXITSHORT AT MARKET
ENDIF
//
//graphonprice indicator1 coloured(0,0,255,255)
//graphonprice indicator2 coloured(0,255,0,255)
//graph PositionPerf * PositionPrice * PipValue
Jodal thanked this postHi Roberto,
Thank you for taking the time … again 🙂
I see 2 issues
- I have several green days with over 100 in profit (which I guess should not happen?)
- Some trades were executed for no reason
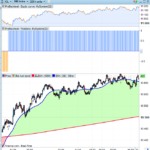
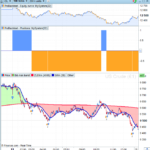
See attached screenshots
I find the profit strategy a bit confusing so I tried to simplify my system and changed a EMA 200 on a 10min timeframe into a EMA 2000 on a 1min (they are really similar).
So I think it will be less complicated to use my strategy in one timeframe (and easier to backtest / check as well).
I amended your code with the one below but I still have weird entry/exit points so I think something is wrong.
I feel we are almost there but there is something wrong with the profit strategy…
Can you spot anything wrong?
Enjoy your evening
Jo
DEFPARAM CumulateOrders = False // indicator1 = ExponentialAverage[20](close) indicator2 = ExponentialAverage[2000](close) c1 = (indicator1 > indicator2) c2 = (indicator1 < indicator2) ONCE MyGOAL = 100 //100 currency units (be them Euros, US dollars or alse IF OnMarket AND ((PositionPerf * PositionPrice * PipValue) >= MyGOAL) THEN SELL AT Market EXITSHORT AT Market ENDIF // Formula floatingprofit floatingprofit = (((close-positionprice)*pointvalue)*countofposition)/pipsize Timeframe (default) // ONCETradeON = 1 IF IntradayBarIndex = 0 THEN TradeON = 1 MyProfit = (STRATEGYPROFIT+floatingprofit) Pips = 0 ENDIF // Here below I replaced STRETAGYPROFIT by MyProfit. I don't know if I should change STRATEGYPROFIT[1]? Pips = Pips + ((MyProfit - STRATEGYPROFIT[1]) / PipValue) IF Pips >= 100 THEN TradeON = 0 ENDIF // Conditions to enter long IF NOT LongOnMarket AND c1 AND TradeON THEN BUY 1 CONTRACT AT MARKET ENDIF // Conditions to exit a buy position If LongOnMarket AND c2 THEN SELL AT MARKET ENDIF // Conditions to enter short IF NOT ShortOnMarket AND c2 AND TradeON THEN SELLSHORT 1 CONTRACT AT MARKET ENDIF // Conditions to exit a sell position IF ShortOnMarket AND c1 THEN EXITSHORT AT MARKET ENDIFTell me:
- what TF and instrument you are using
- what are the dates and time a wrong trade was entered or exited
- what are the dates and times there was any issue with the profit.
Jodal thanked this postHi Roberto,
Thanks a lot for your reply.
Instrument is Crude Oil (CL)
Timeframe is 1 minuteBacktest was done on 200k units (22/11/21 – 03/06/22)
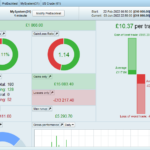
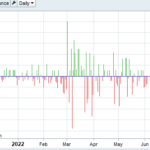
Regarding the green days > 100 in profit, please see attached screenshot of the detail report, a lot of bars are above the 100 mark.
For example: 23/11, 30/11, 01/03, 06/03, 09/03, 25/04Regarding the wrong entry/exit for a trade, here are a few:
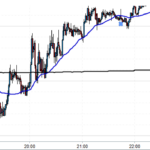
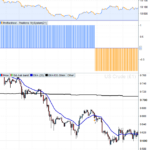
02/06/22 Entry at 16:09 (See Graph 020622)
It happens way too late.
Exit is good (exit a the close of the candle once we reach 100).
However, it takes another trade a few minutes later.
Why?08/04/2022 at 20:40
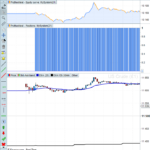
11/04/2022 at 2:28 (See attached Graph 11042022)Also, many times it executed a trade at the very beginning of the day (without EMA crossing)
A few dates:
23/04/2022
13/04/2022
31/05/2022 (See Graph 310522),
02/06/22Or is it because the calculation of the indicator (EMA200 on 30minutes) is not well displayed on my chart?
Here is the code I added:TIMEFRAME(30 minutes)
ind=ExponentialAverage[100](close)
return ind
The 100-pip limit was applied only NOT to trade anymore for the day, but the current trade was not stopped, now it is.
There was also a glitch in the calculation of Pips (I also replaced the variable Pips with Money):DEFPARAM CumulateOrders = False // indicator1 = ExponentialAverage[20](close) indicator2 = ExponentialAverage[2000](close) c1 = (indicator1 > indicator2) c2 = (indicator1 < indicator2) ONCE MyGOAL = 100 //100 currency units (be them Euros, US dollars or alse IF OnMarket AND ((PositionPerf * PositionPrice * PipValue) >= MyGOAL) THEN SELL AT Market EXITSHORT AT Market ENDIF // Formula floatingprofit floatingprofit = (((close-positionprice)*pointvalue)*countofposition)/pipsize Timeframe (default) // ONCETradeON = 1 IF IntradayBarIndex = 0 THEN TradeON = 1 MyProfit = STRATEGYPROFIT Money = 0 ENDIF // Here below I replaced STRETAGYPROFIT by MyProfit. I don't know if I should change STRATEGYPROFIT[1]? Money = (StrategyProfit + floatingprofit) - MyProfit IF Money >= 100 THEN TradeON = 0 SELL AT MARKET EXITSHORT AT MARKET ENDIF // Conditions to enter long IF NOT LongOnMarket AND c1 AND TradeON THEN BUY 1 CONTRACT AT MARKET ENDIF // Conditions to exit a buy position If LongOnMarket AND c2 THEN SELL AT MARKET ENDIF // Conditions to enter short IF NOT ShortOnMarket AND c2 AND TradeON THEN SELLSHORT 1 CONTRACT AT MARKET ENDIF // Conditions to exit a sell position IF ShortOnMarket AND c1 THEN EXITSHORT AT MARKET ENDIF //graph floatingprofit //graph Money //graph Money >= 100 //graph TradeON //graph c1 //graph c2Jodal thanked this postThank you Roberto for your quick reply and work, I appreciate it.
Here I am in 100TICKS, SMA38 and ZLEMA4000
The entries are perfect, really at the crossing!
However, I still have 2 issues
1. It will open a trade at the first candle of each new day (even if there is no crossing).
If the faster MA is above the slow one (no crossing) it will open a buy order, if the faster MA is below the slow one (no crossing), it will open a sell order.
How can we avoid that?2. Most of the days it will indeed stop at 100 but not all of them.
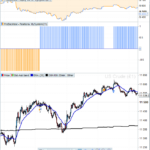
For example, on March 21, it opens at the crossing (great), closes 100 pts later (great) but also opens a new trade (no crossing), and then it does it again later
See attached graph 21032022See also on April 11, first it opens on the first candle of the day, then it places an order at the first crossing (to close the first buy position). The sell position is opened and then it closes it 100 pips late (which is good) but again opens a new trade again (no crossing, just opens a new one when closing the good one) It should have just stopped for the day.
This makes bigger earning days but also big losing days because it keeps trading while it should have stopped (because in profit earlier)
Do you see what’s wrong?
Almost there 🙂
Thank you!!!!!You are using 100 ticks, which are not allowed in autotrading.
Please post the complete code (or attach the ITF file).
Jodal thanked this postHi @robertogozzi,
Too bad for the 100 ticks.
I can backtest it but you mean it won’t work when I go “live autotrading”?Can I do autotrading on the TF 30 seconds or the minimum is 1 minute?
I tried to backtest on the 1min timeframe, I still have the same issues mentioned above (trade at day start + does not always stop once I reach 100 pips/currency)
Here is the code
Thank you Roberto
DEFPARAM CumulateOrders = False // indicator1 = Average[38](close) indicator2 = ZLEMA[4000](close) c1 = (indicator1 > indicator2) c2 = (indicator1 < indicator2) ONCE MyGOAL = 100 //100 currency units (be them Euros, US dollars or alse IF OnMarket AND ((PositionPerf * PositionPrice * PipValue) >= MyGOAL) THEN SELL AT Market EXITSHORT AT Market ENDIF // Formula floatingprofit floatingprofit = (((close-positionprice)*pointvalue)*countofposition)/pipsize Timeframe (default) // ONCETradeON = 1 IF IntradayBarIndex = 0 THEN TradeON = 1 MyProfit = STRATEGYPROFIT Money = 0 ENDIF // Here below I replaced STRETAGYPROFIT by MyProfit. I don't know if I should change STRATEGYPROFIT[1]? Money = (StrategyProfit + floatingprofit) - MyProfit IF Money >= 100 THEN TradeON = 0 SELL AT MARKET EXITSHORT AT MARKET ENDIF // Conditions to enter long IF NOT LongOnMarket AND c1 AND TradeON THEN BUY 1 CONTRACT AT MARKET ENDIF // Conditions to exit a buy position If LongOnMarket AND c2 THEN SELL AT MARKET ENDIF // Conditions to enter short IF NOT ShortOnMarket AND c2 AND TradeON THEN SELLSHORT 1 CONTRACT AT MARKET ENDIF // Conditions to exit a sell position IF ShortOnMarket AND c1 THEN EXITSHORT AT MARKET ENDIF //graph floatingprofit //graph Money //graph Money >= 100 //graph TradeON //graph c1 //graph c2You can trade from 1 second on… (non time-based charts can’t be usedf in autotrading).
I modified the code so that a CROSSOVER is required each new day.
The LIMIT is checked when the candle closes, so it’s quiter rare that it’s exactly 100, most often it will be greater. It depends on the last candle, the greater the spike, the greter the profit/loss.
DEFPARAM CumulateOrders = False // ONCE CrossOver = 0 IF IntraDayBarIndex = 0 THEN CrossOver = 0 ENDIF indicator1 = ExponentialAverage[20](close) indicator2 = ExponentialAverage[2000](close) IF (indicator1 CROSSES OVER indicator2) OR (indicator1 CROSSES UNDER indicator2) THEN CrossOver = 1 ENDIF c1 = (indicator1 > indicator2) c2 = (indicator1 < indicator2) ONCE MyGOAL = 100 //100 currency units (be them Euros, US dollars or alse IF OnMarket AND ((PositionPerf * PositionPrice * PipValue) >= MyGOAL) THEN SELL AT Market EXITSHORT AT Market ENDIF // Formula floatingprofit floatingprofit = (((close-positionprice)*pointvalue)*countofposition)/pipsize Timeframe (default) // ONCETradeON = 1 IF IntradayBarIndex = 0 THEN TradeON = 1 MyProfit = STRATEGYPROFIT Money = 0 ENDIF // Here below I replaced STRETAGYPROFIT by MyProfit. I don't know if I should change STRATEGYPROFIT[1]? Money = (StrategyProfit + floatingprofit) - MyProfit IF Money >= 100 THEN TradeON = 0 SELL AT MARKET EXITSHORT AT MARKET ENDIF // Conditions to enter long IF NOT LongOnMarket AND c1 AND TradeON AND CrossOver THEN BUY 1 CONTRACT AT MARKET ENDIF // Conditions to exit a buy position If LongOnMarket AND c2 THEN SELL AT MARKET ENDIF // Conditions to enter short IF NOT ShortOnMarket AND c2 AND TradeON AND CrossOver THEN SELLSHORT 1 CONTRACT AT MARKET ENDIF // Conditions to exit a sell position IF ShortOnMarket AND c1 THEN EXITSHORT AT MARKET ENDIF //graph floatingprofit //graph Money //graph (Money >= 100) * 50 coloured(255,0,0,255) //graph TradeON //graph c1 //graph c2 -
AuthorPosts
- You must be logged in to reply to this topic.
Supertrend on MTF
ProOrder: Automated Strategies & Backtesting
Summary
This topic contains 19 replies,
has 2 voices, and was last updated by Jodal
3 years, 8 months ago.
Topic Details
| Forum: | ProOrder: Automated Strategies & Backtesting |
| Language: | English |
| Started: | 05/27/2022 |
| Status: | Active |
| Attachments: | 11 files |


About personal data collected
The information collected on this form is stored in a computer file by ProRealCode to create and access your ProRealCode profile. This data is kept in a secure database for the duration of the member's membership. They will be kept as long as you use our services and will be automatically deleted after 3 years of inactivity. Your personal data is used to create your private profile on ProRealCode. This data is maintained by SAS ProRealCode, 407 rue Freycinet, 59151 Arleux, France. If you subscribe to our newsletters, your email address is provided to our service provider "MailChimp" located in the United States, with whom we have signed a confidentiality agreement. This company is also compliant with the EU/Swiss Privacy Shield, and the GDPR. For any request for correction or deletion concerning your data, you can directly contact the ProRealCode team by email at privacy@prorealcode.com If you would like to lodge a complaint regarding the use of your personal data, you can contact your data protection supervisory authority.

