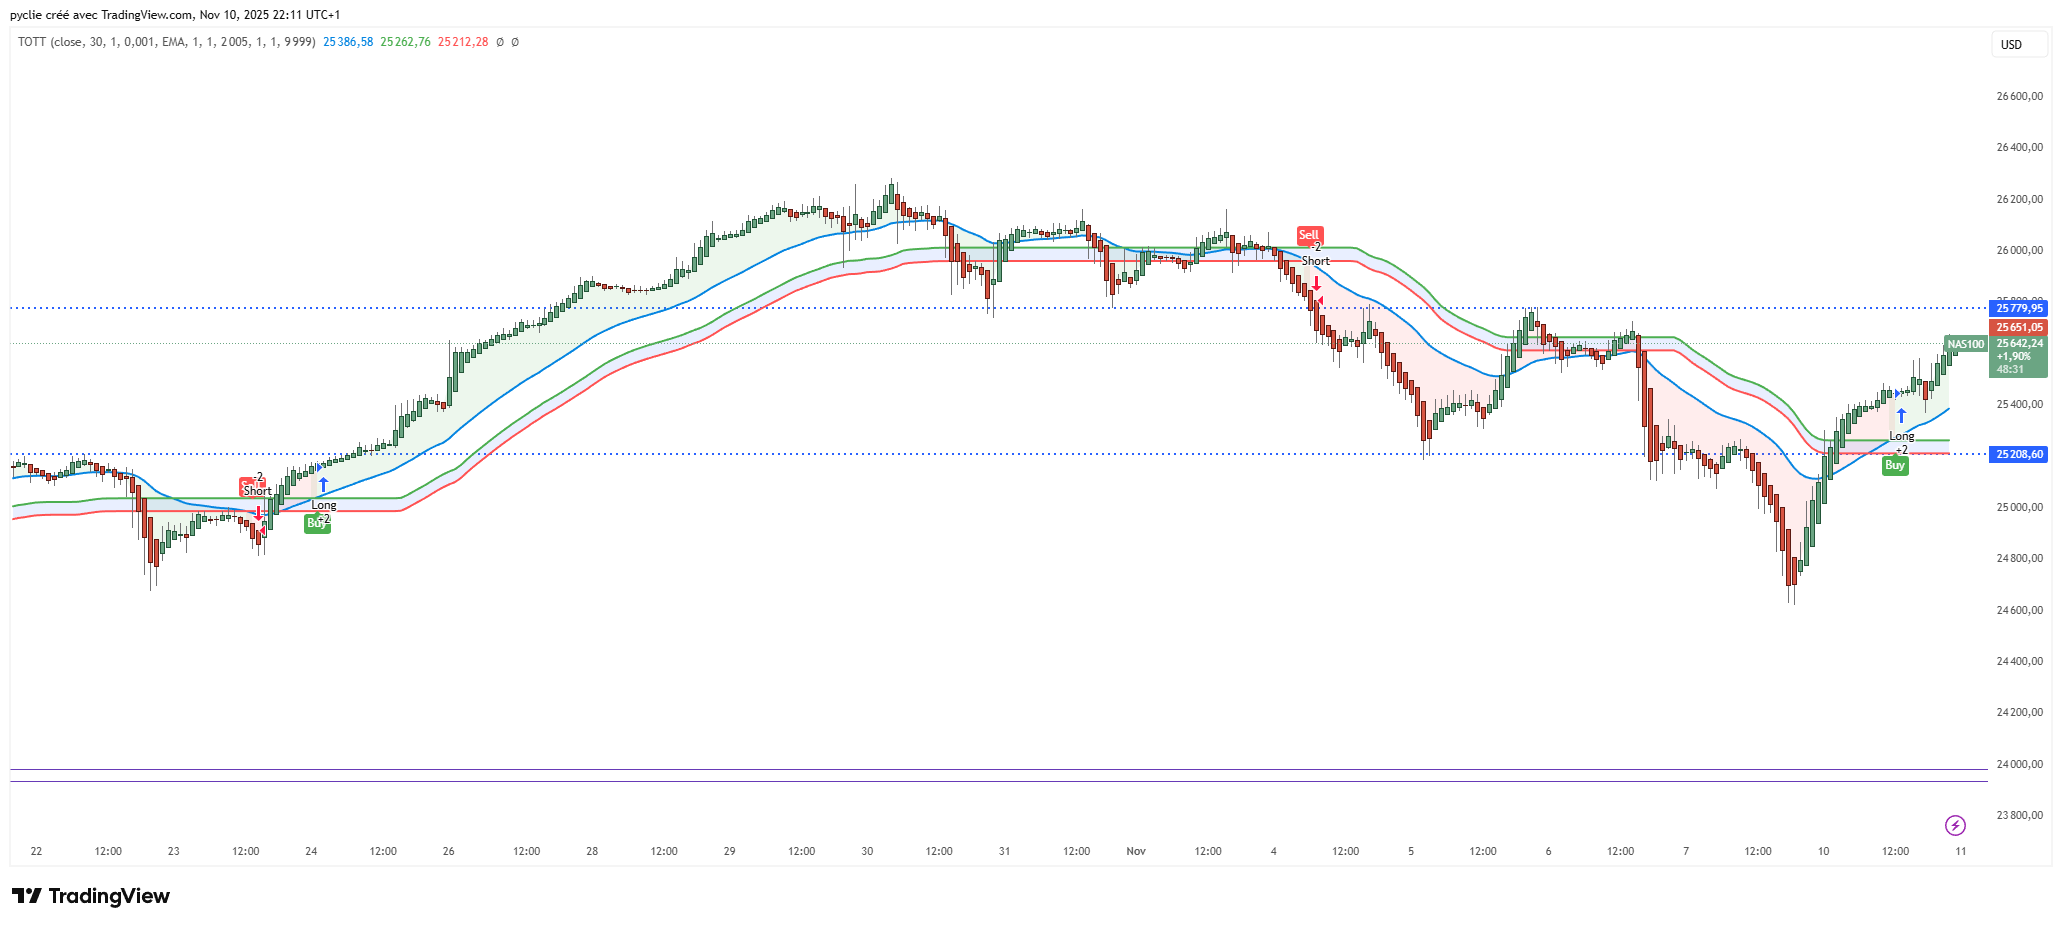
Bonjour j’ai trouvé cet indicateur sur trading view si quelqu’un pouvait le traduire en prt merci d’avance
//@version=5
// This source code is subject to the terms of the Mozilla Public License 2.0 at https://mozilla.org/MPL/2.0/
// © KivancOzbilgic
//created by: @Anil_Ozeksi
//developer: ANIL ÖZEKŞİ
//author: @kivancozbilgic
strategy(‘Twin Optimized Trend Tracker’, ‘TOTT’, overlay=true)
src = input(close, title=’Source’)
length = input.int(40, ‘OTT Period’, minval=1)
percent = input.float(1, ‘Optimization Constant’, step=0.1, minval=0)
coeff = input.float(0.001, ‘Twin OTT Coefficient’, step=0.001, minval=0)
showsupport = input(title=’Show Support Line?’, defval=true)
showsignalsk = input(title=’Show Signals?’, defval=true)
mav = input.string(title=’Moving Average Type’, defval=’VAR’, options=[‘SMA’, ‘EMA’, ‘WMA’, ‘TMA’, ‘VAR’, ‘WWMA’, ‘ZLEMA’, ‘TSF’])
highlighting = input(title=’Highlighter On/Off ?’, defval=true)
Var_Func(src, length) =>
valpha = 2 / (length + 1)
vud1 = src > src[1] ? src – src[1] : 0
vdd1 = src < src[1] ? src[1] – src : 0 vUD = math.sum(vud1, 9) vDD = math.sum(vdd1, 9) vCMO = nz((vUD – vDD) / (vUD + vDD)) VAR = 0.0 VAR := nz(valpha * math.abs(vCMO) * src) + (1 – valpha * math.abs(vCMO)) * nz(VAR[1]) VAR VAR = Var_Func(src, length) Wwma_Func(src, length) =>
wwalpha = 1 / length
WWMA = 0.0
WWMA := wwalpha * src + (1 – wwalpha) * nz(WWMA[1])
WWMA
WWMA = Wwma_Func(src, length)
Zlema_Func(src, length) =>
zxLag = length / 2 == math.round(length / 2) ? length / 2 : (length – 1) / 2
zxEMAData = src + src – src[zxLag]
ZLEMA = ta.ema(zxEMAData, length)
ZLEMA
ZLEMA = Zlema_Func(src, length)
Tsf_Func(src, length) =>
lrc = ta.linreg(src, length, 0)
lrc1 = ta.linreg(src, length, 1)
lrs = lrc – lrc1
TSF = ta.linreg(src, length, 0) + lrs
TSF
TSF = Tsf_Func(src, length)
getMA(src, length) =>
ma = 0.0
if mav == ‘SMA’
ma := ta.sma(src, length)
ma
if mav == ‘EMA’
ma := ta.ema(src, length)
ma
if mav == ‘WMA’
ma := ta.wma(src, length)
ma
if mav == ‘TMA’
ma := ta.sma(ta.sma(src, math.ceil(length / 2)), math.floor(length / 2) + 1)
ma
if mav == ‘VAR’
ma := VAR
ma
if mav == ‘WWMA’
ma := WWMA
ma
if mav == ‘ZLEMA’
ma := ZLEMA
ma
if mav == ‘TSF’
ma := TSF
ma
ma
MAvg = getMA(src, length)
fark = MAvg * percent * 0.01
longStop = MAvg – fark
longStopPrev = nz(longStop[1], longStop)
longStop := MAvg > longStopPrev ? math.max(longStop, longStopPrev) : longStop
shortStop = MAvg + fark
shortStopPrev = nz(shortStop[1], shortStop)
shortStop := MAvg < shortStopPrev ? math.min(shortStop, shortStopPrev) : shortStop dir = 1 dir := nz(dir[1], dir) dir := dir == -1 and MAvg > shortStopPrev ? 1 : dir == 1 and MAvg < longStopPrev ? -1 : dir MT = dir == 1 ? longStop : shortStop OTT = MAvg > MT ? MT * (200 + percent) / 200 : MT * (200 – percent) / 200
OTTup = OTT * (1 + coeff)
OTTdn = OTT * (1 – coeff)
PPLOT = plot(showsupport ? MAvg : na, color=color.new(#0585E1, 0), linewidth=2, title=’Support Line’)
pALLup = plot(nz(OTTup[2]), color=color.new(color.green, 0), linewidth=2, title=’OTTup’)
pALLdn = plot(nz(OTTdn[2]), color=color.new(color.red, 0), linewidth=2, title=’OTTdown’)
buySignalk = ta.crossover(MAvg, OTTup[2])
sellSignalk = ta.crossunder(MAvg, OTTdn[2])
K1 = ta.barssince(buySignalk)
K2 = ta.barssince(sellSignalk)
O1 = ta.barssince(buySignalk[1])
O2 = ta.barssince(sellSignalk[1])
plotshape(buySignalk and showsignalsk and O1 > K2 ? math.min(low, OTTdn) : na, title=’Buy’, text=’Buy’, location=location.absolute, style=shape.labelup, size=size.tiny, color=color.new(color.green, 0), textcolor=color.new(color.white, 0))
plotshape(sellSignalk and showsignalsk and O2 > K1 ? math.max(high, OTTup) : na, title=’Sell’, text=’Sell’, location=location.absolute, style=shape.labeldown, size=size.tiny, color=color.new(color.red, 0), textcolor=color.new(color.white, 0))
mPlot = plot(ohlc4, title=”, style=plot.style_circles, linewidth=0, display=display.none)
longFillColor = highlighting ? O2 > K1 ? color.green : na : na
shortFillColor = highlighting ? O1 > K2 ? color.red : na : na
fill(mPlot, PPLOT, title=’UpTrend Highligter’, color=longFillColor, transp=90)
fill(mPlot, PPLOT, title=’DownTrend Highligter’, color=shortFillColor, transp=90)
fill(pALLup, pALLdn, title=’Flat Zone Highligter’, color=color.new(color.blue, 90))
dummy0 = input(true, title=’=Backtest Inputs=’)
FromDay = input.int(defval=1, title=’From Day’, minval=1, maxval=31)
FromMonth = input.int(defval=1, title=’From Month’, minval=1, maxval=12)
FromYear = input.int(defval=2005, title=’From Year’, minval=2005)
ToDay = input.int(defval=1, title=’To Day’, minval=1, maxval=31)
ToMonth = input.int(defval=1, title=’To Month’, minval=1, maxval=12)
ToYear = input.int(defval=9999, title=’To Year’, minval=2006)
Start = timestamp(FromYear, FromMonth, FromDay, 00, 00)
Finish = timestamp(ToYear, ToMonth, ToDay, 23, 59)
Timerange() =>
time >= Start and time <= Finish ? true : false
if buySignalk
strategy.entry(‘Long’, strategy.long, when=Timerange())
if sellSignalk
strategy.entry(‘Short’, strategy.short, when=Timerange())