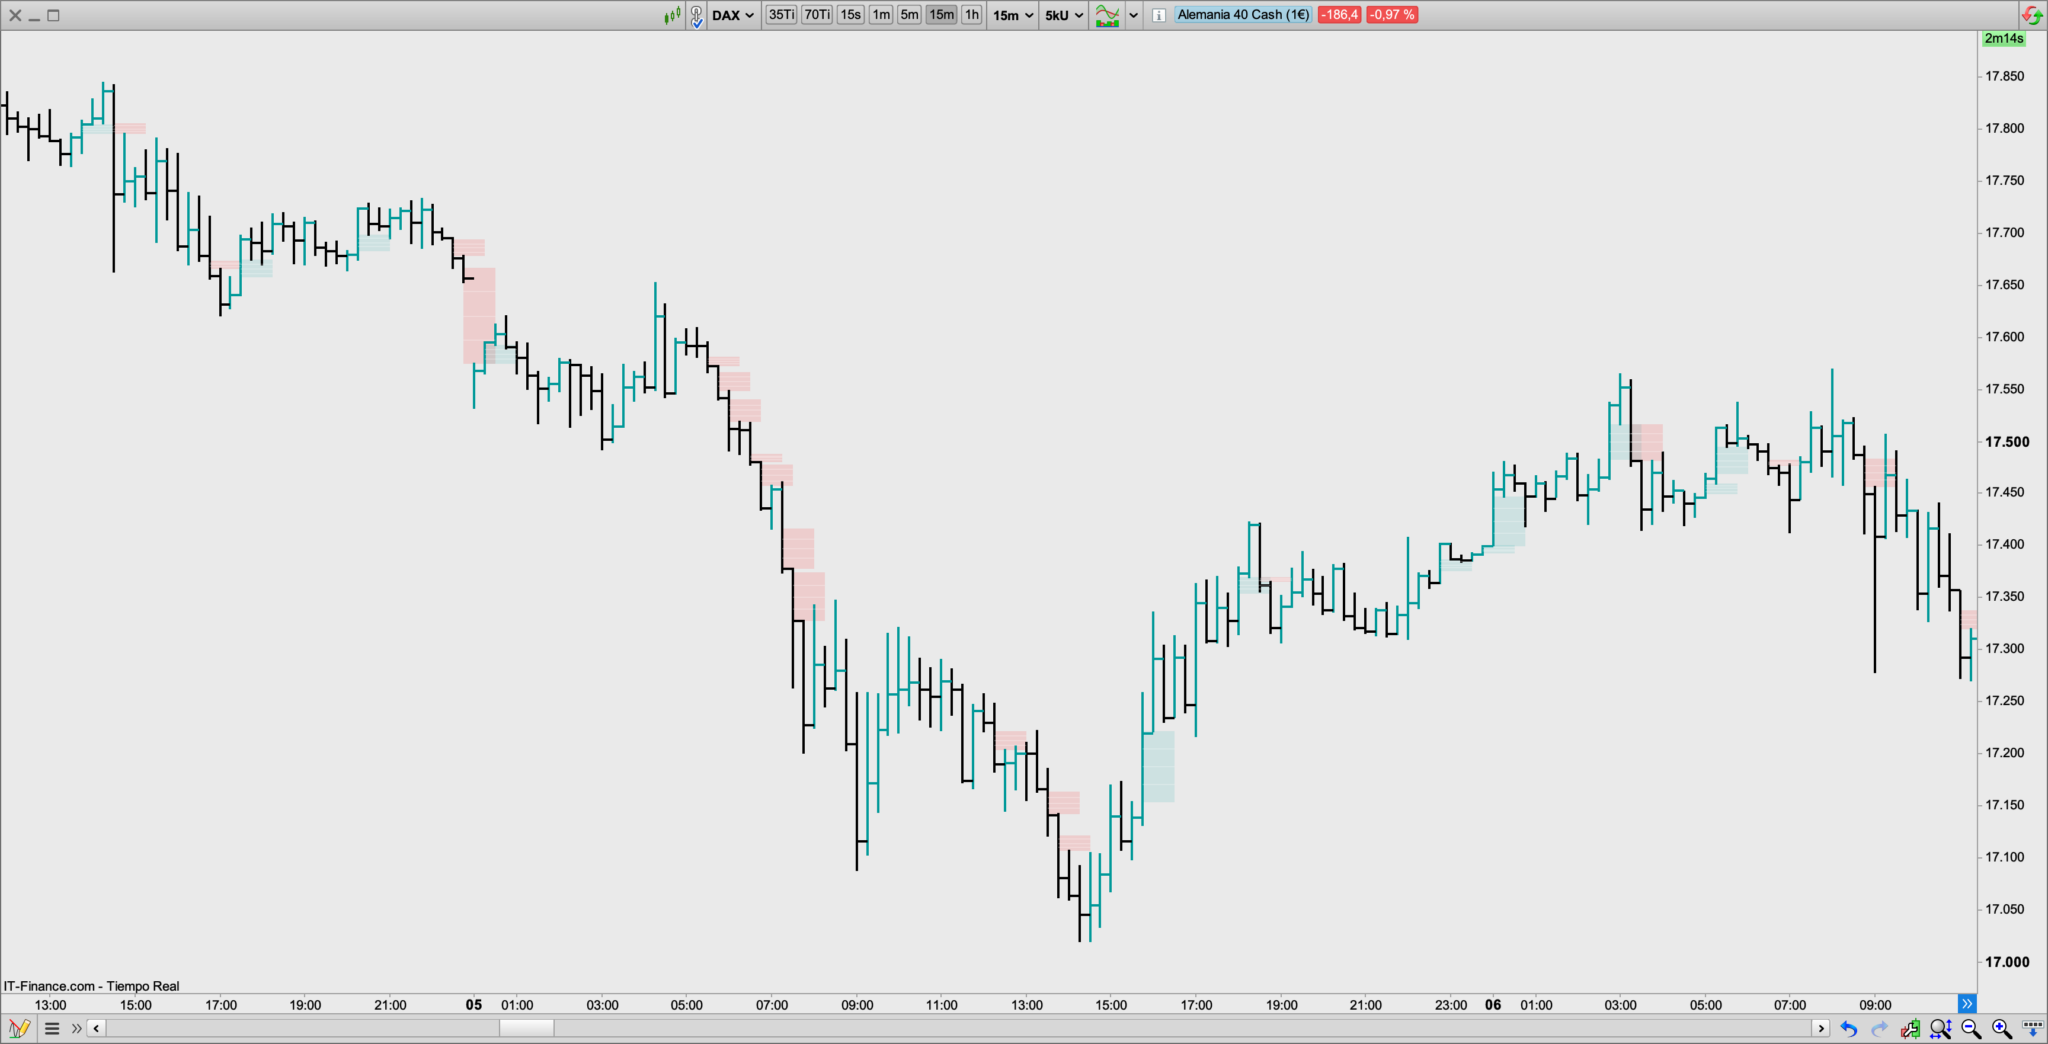
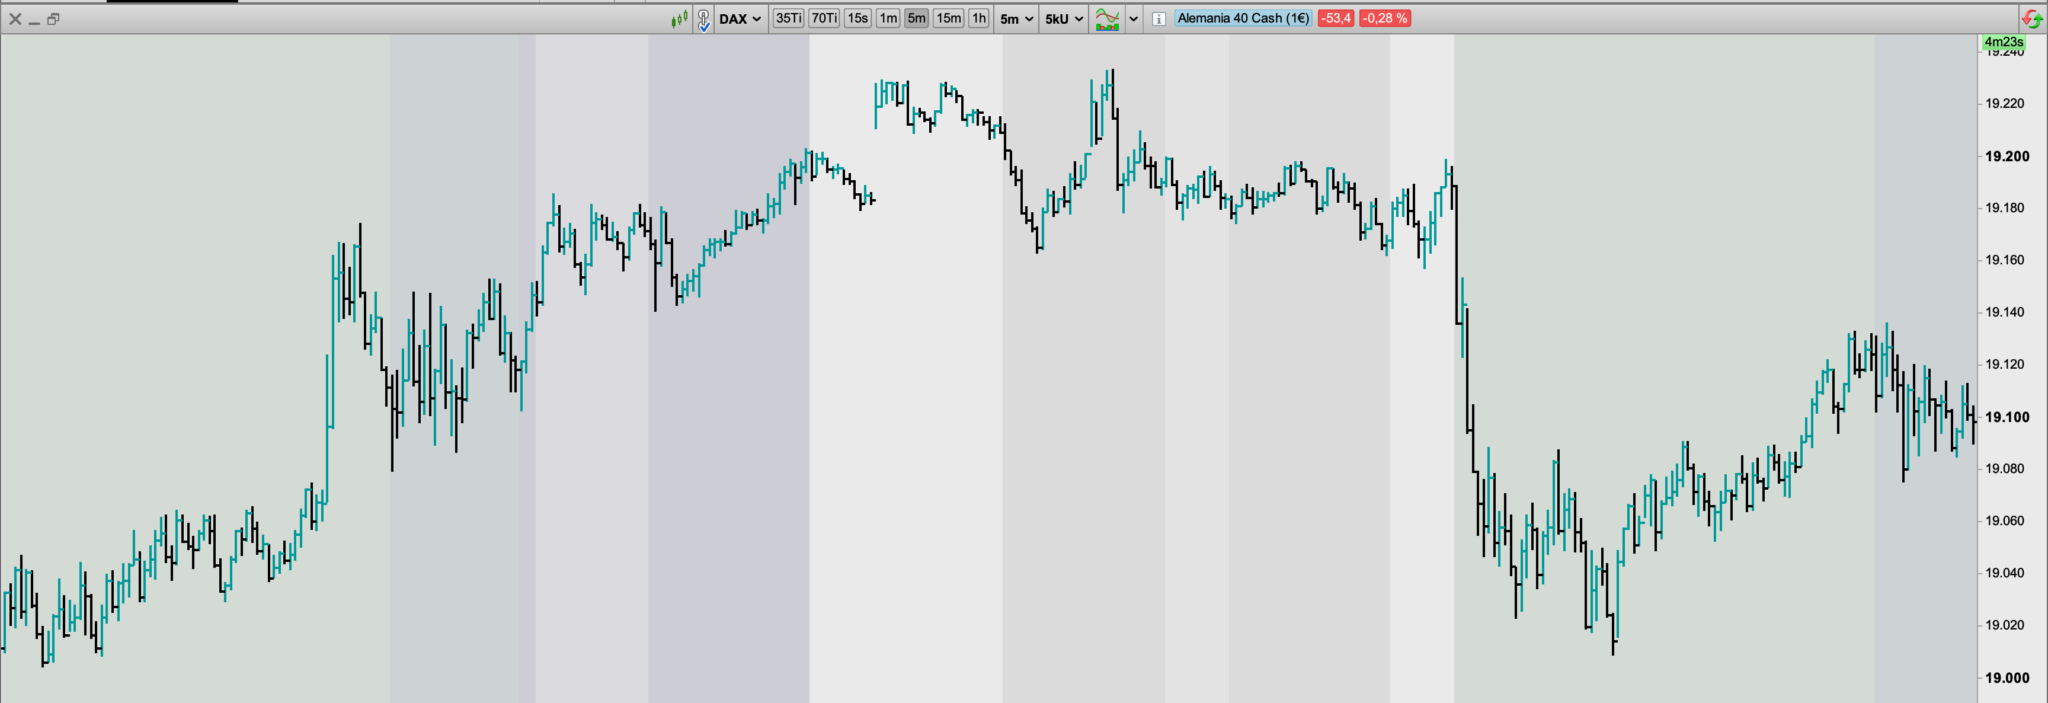
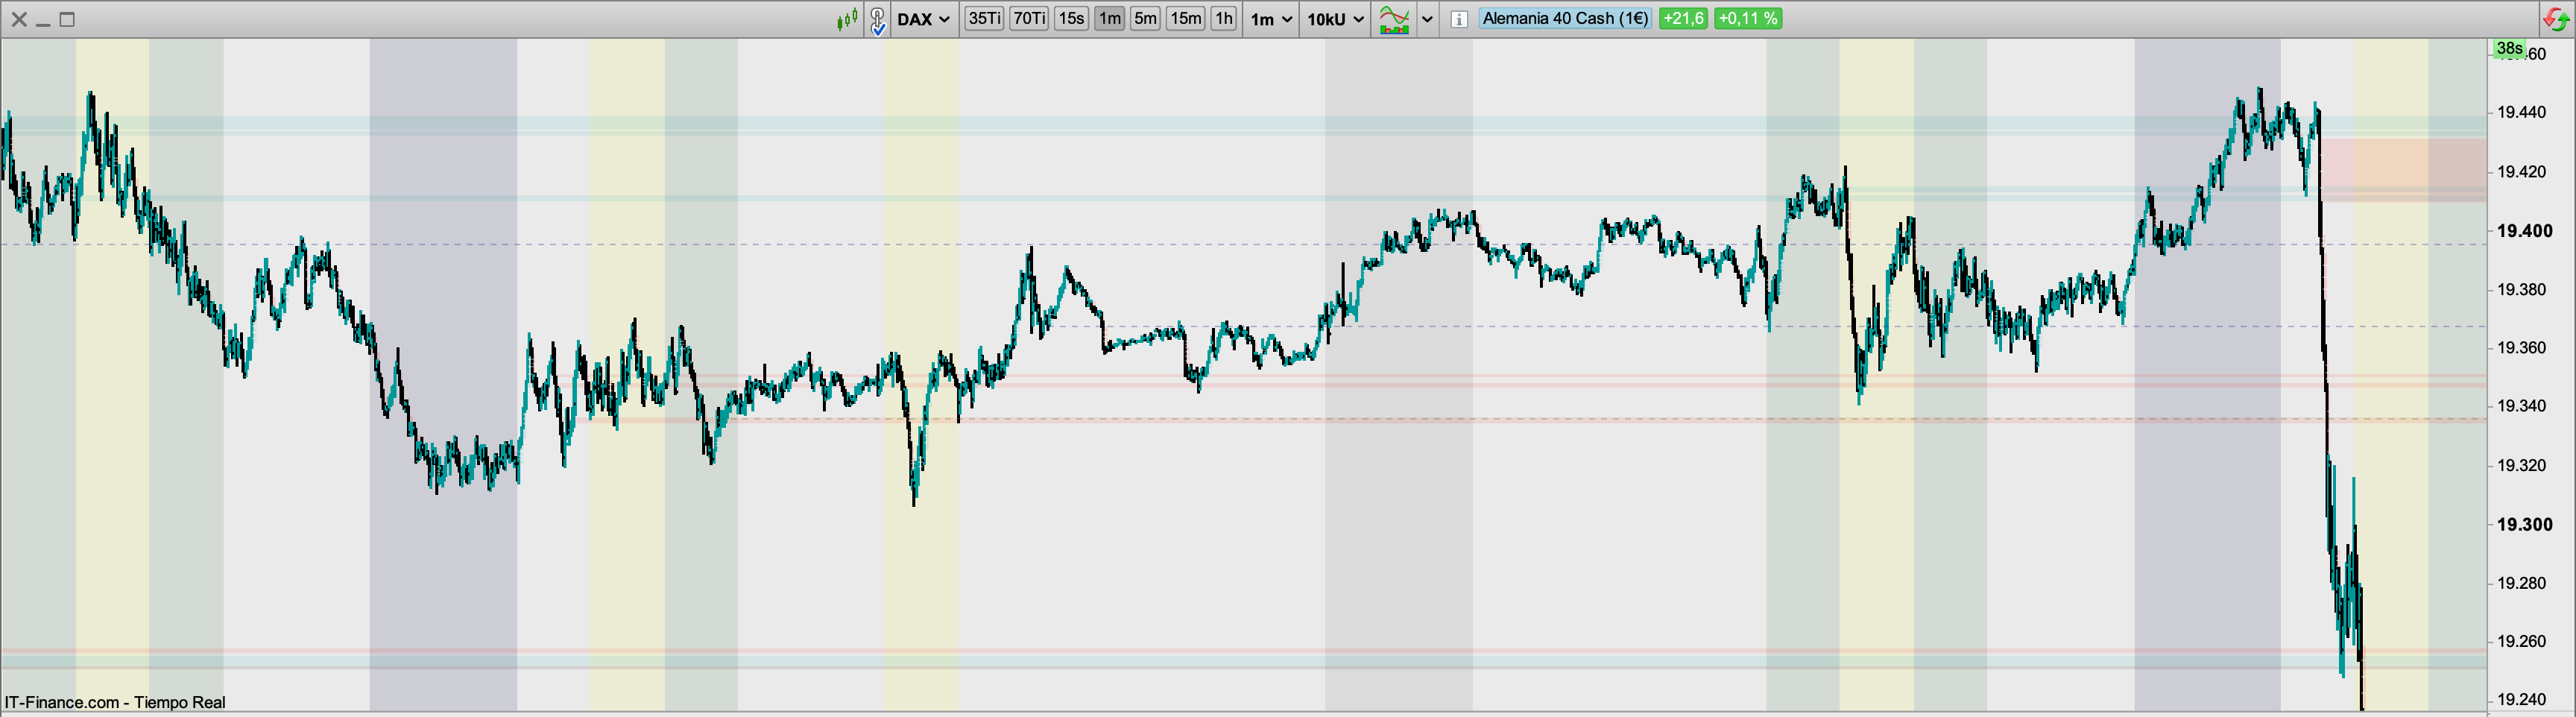
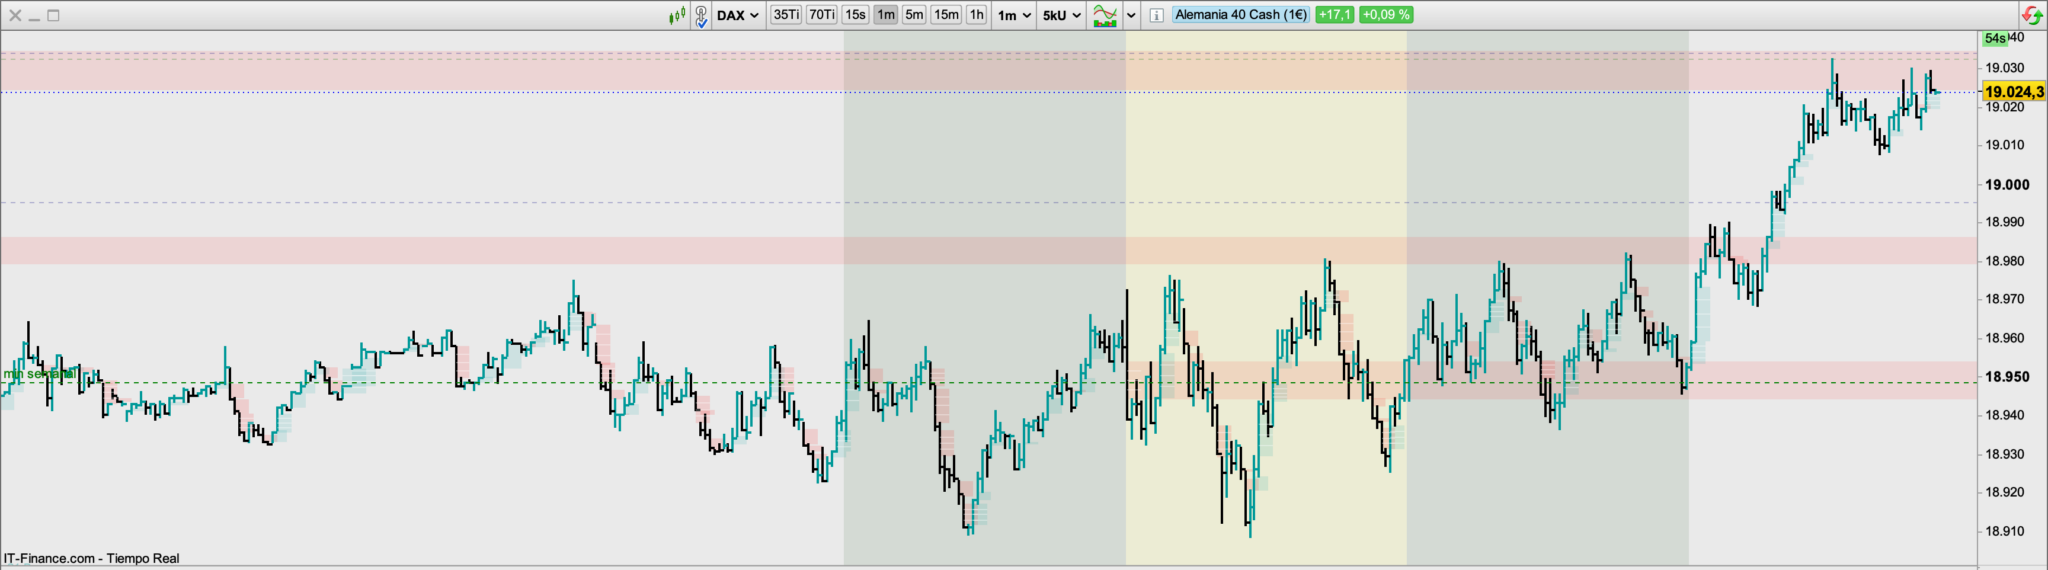
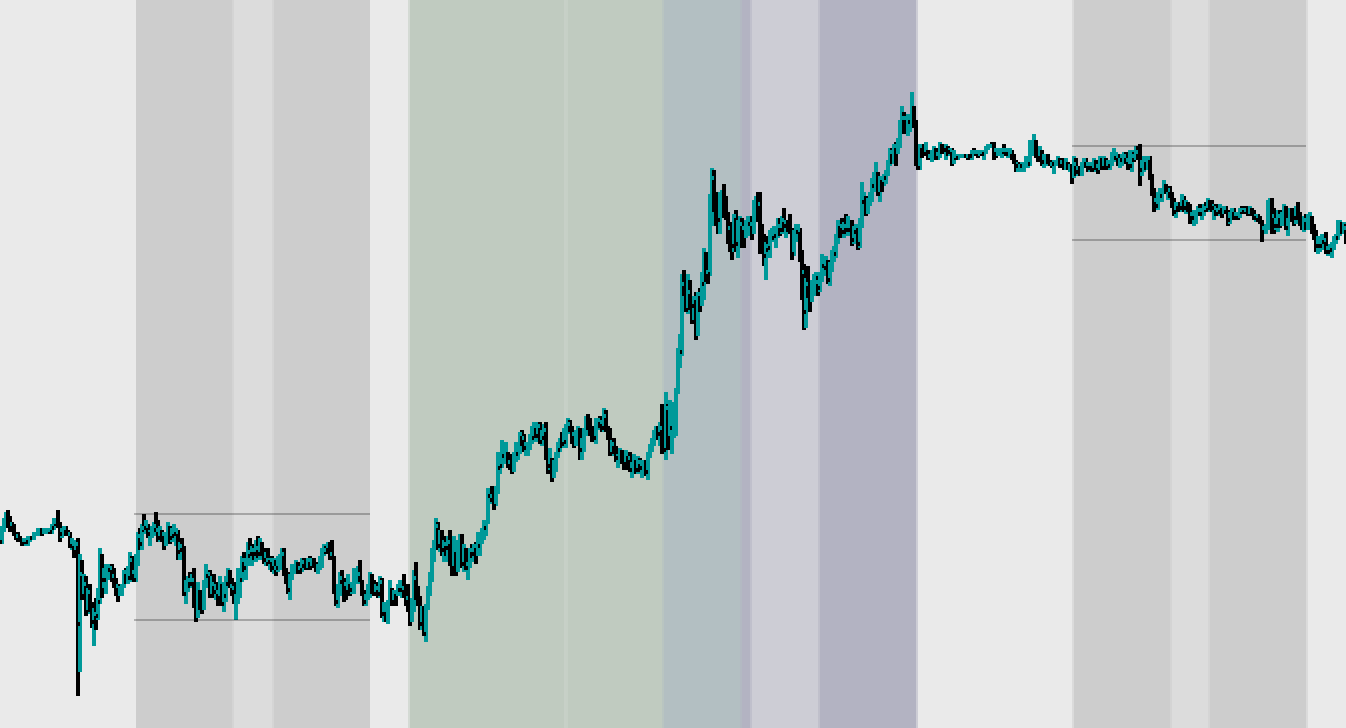
este indicador aúna varios conceptos SMC (Smart Money Concepts) / ICT (The Inner Circle Trader) como Kill Zones, Silver Bullet Hours o primer FVG de la sesión LONDON y NY (9.00 y 15.30 hora española)
paso el código “tal cual” pero lo mantengo en permanente revisión y mejora a lo largo del tiempo
// Author: toniyecla
// basado en los conceptos de The Inner Circle Trader - https://www.youtube.com/@InnerCircleTrader
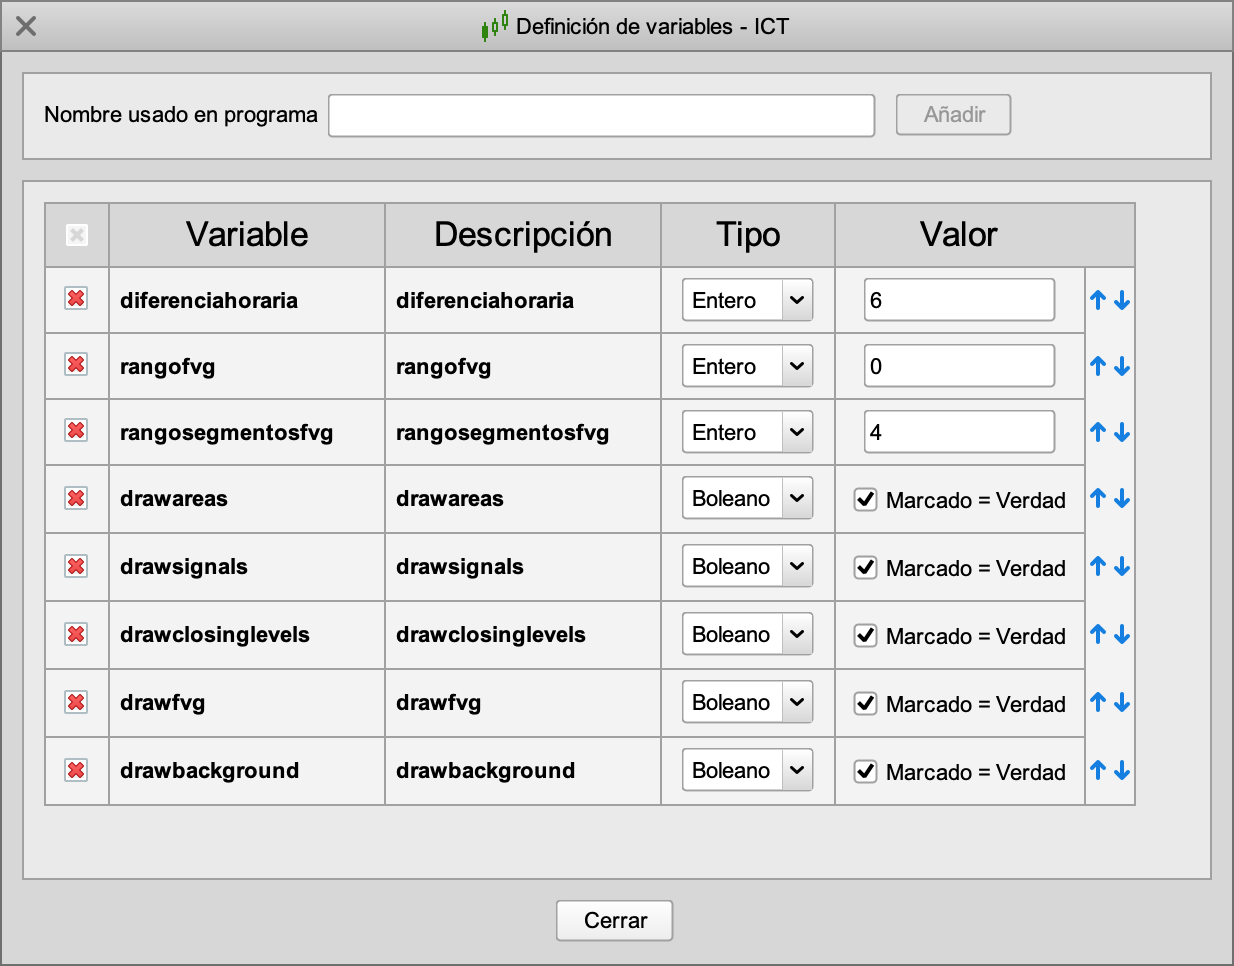
once fvg = 1
once opacidad = 1
once NbBar = 1
MyDay=openday
dayminutes = 1440*(MyDay-MyDay[1])
MyHour=openhour
hourminutes = 60*(MyHour-MyHour[1])
MyMin=openminute
barminutes = MyMin - MyMin[1] + hourminutes + dayminutes
barminutes=abs(barminutes)
Mybarminutes = lowest[NbBar](barminutes)[1]
if (Mybarminutes <= 60 and opensecond = 0) then
periodos = 60 / Mybarminutes
if (opensecond <> opensecond[1]) then
periodos = 60 * 4
endif
//// KILL ZONES
// ICT Asian Kill Zone (08:00 PM - 10:00 PM, NY UTC -4)
asian = 22 + diferenciahoraria
// ICT London Kill Zone (02:00 AM - 05:00 AM, NY UTC -4)
london = 5 + diferenciahoraria
// ICT New York Kill Zone (07:00 AM - 09:00 AM, NY UTC -4)
ny = 9 + diferenciahoraria
// ICT London Close Kill Zone (10:00 AM - 12:00 PM, NY UTC -4)
londonclose = 12 + diferenciahoraria
if (asian > 23) then
asian = asian - 24
endif
if (london > 23) then
london = london - 24
endif
if (ny > 23) then
ny = ny - 24
endif
if (londonclose > 23) then
londonclose = londonclose - 24
endif
// BACKGROUND
if drawbackground then
if (hour[1] = asian - 2 or hour[1] = asian - 1) then
backgroundcolor(0, 0, 0, 16 * opacidad)
endif
if (hour[1] = london - 3 or hour[1] = london - 2 or hour[1] = london - 1) then
backgroundcolor(0, 64, 0, 24 * opacidad)
endif
if (hour[1] = ny - 2 or hour[1] = ny - 1) then
backgroundcolor(0, 0, 64, 32 * opacidad)
endif
if (hour[1] = londonclose - 2 or hour[1] = londonclose - 1) then
backgroundcolor(0, 64, 0, 24 * opacidad)
endif
endif
// AREAS
if drawareas then
if (hour[1] = asian and minute[1] = 0) or (hour[1] = london and minute[1] = 0) or (hour[1] = ny and minute[1] = 0) or (hour[1] = londonclose and minute[1] = 0) then
if (hour[1] = london) then
x0 = barindex[periodos * 3]
y0 = highest[periodos * 3](high[1])
x1 = barindex[1]
y1 = lowest[periodos * 3](low[1])
else
x0 = barindex[periodos * 2]
y0 = highest[periodos * 2](high[1])
x1 = barindex[1]
y1 = lowest[periodos * 2](low[1])
endif
DRAWRECTANGLE(x0, y0, x1, y1) coloured(255, 255, 255, 96) bordercolor(255, 255, 255, 0)
endif
endif
// SIGNAL
if drawsignals then
if (IsLastBarUpdate = 1) then
if (hour[1] = asian - 2 or hour[1] = asian - 1) then
DRAWRECTANGLE(-5, -24, -138, -40) coloured(255, 255, 255, 255) bordercolor(255, 255, 255, 0) anchor(TOPRIGHT)
drawtext("ASIAN KILL ZONE", -71, -31, SansSerif, Standard, 8) coloured(0, 0, 0, 255) anchor(TOPRIGHT)
endif
if (hour[1] = london - 3 or hour[1] = london - 2 or hour[1] = london - 1) then
DRAWRECTANGLE(-5, -24, -138, -40) coloured(255, 255, 255, 255) bordercolor(255, 255, 255, 0) anchor(TOPRIGHT)
drawtext("LONDON KILL ZONE", -71, -31, SansSerif, Standard, 8) coloured(0, 0, 0, 255) anchor(TOPRIGHT)
endif
if (hour[1] = ny - 2 or hour[1] = ny - 1) then
DRAWRECTANGLE(-5, -24, -138, -40) coloured(255, 255, 255, 255) bordercolor(255, 255, 255, 0) anchor(TOPRIGHT)
drawtext("NEW YORK KILL ZONE", -71, -31, SansSerif, Standard, 8) coloured(0, 0, 0, 255) anchor(TOPRIGHT)
endif
if (hour[1] = londonclose - 2 or hour[1] = londonclose - 1) then
DRAWRECTANGLE(-5, -24, -138, -40) coloured(255, 255, 255, 255) bordercolor(255, 255, 255, 0) anchor(TOPRIGHT)
drawtext("LONDON CLOSE KILL ZONE", -71, -31, SansSerif, Standard, 8) coloured(0, 0, 0, 255) anchor(TOPRIGHT)
endif
endif
endif
//// SILVER BULLET
// The London Open Silver Bullet (03:00 AM - 04:00 AM, NY UTC -4)
london = 4 + diferenciahoraria
// The AM session Silver Bullet (10:00 AM - 11:00 AM, NY UTC -4)
am = 11 + diferenciahoraria
// The PM session Silver Bullet (02:00 PM - 03:00 PM, NY UTC -4)
pm = 15 + diferenciahoraria
if (london > 23) then
london = london - 24
endif
if (am > 23) then
am = am - 24
endif
if (pm > 23) then
pm = pm - 24
endif
// BACKGROUND
if drawbackground then
if (hour[1] = london - 1) then
backgroundcolor(255, 255, 0, 24 * opacidad)
endif
if (hour[1] = am - 1) then
backgroundcolor(255, 255, 0, 24 * opacidad)
endif
if (hour[1] = pm - 1) then
backgroundcolor(255, 255, 0, 24 * opacidad)
endif
endif
// AREAS
if drawareas then
if (hour[1] = london and minute[1] = 0) or (hour[1] = am and minute[1] = 0) or (hour[1] = pm and minute[1] = 0) then
x0 = barindex[periodos]
y0 = highest[periodos](high[1])
x1 = barindex[1]
y1 = lowest[periodos](low[1])
DRAWRECTANGLE(x0, y0, x1, y1) coloured(0, 0, 0, 0) bordercolor(0, 0, 0, 64) STYLE(dottedline1, 1)
endif
endif
// SIGNAL
if drawsignals then
if (IsLastBarUpdate = 1) then
if (hour[1] = london - 1) then
DRAWRECTANGLE(-5, -5, -138, -21) coloured(0, 0, 0, 0) bordercolor(0, 0, 0, 255) STYLE(dottedline1, 1) anchor(TOPRIGHT)
drawtext("LONDON SILVER BULLET", -71, -12, SansSerif, Standard, 8) coloured(0, 0, 0, 255) anchor(TOPRIGHT)
endif
if (hour[1] = am - 1) then
DRAWRECTANGLE(-5, -5, -138, -21) coloured(0, 0, 0, 0) bordercolor(0, 0, 0, 255) STYLE(dottedline1, 1) anchor(TOPRIGHT)
drawtext("AM SESSION SILVER BULLET", -71, -12, SansSerif, Standard, 8) coloured(0, 0, 0, 255) anchor(TOPRIGHT)
endif
if (hour[1] = pm - 1) then
DRAWRECTANGLE(-5, -5, -138, -21) coloured(0, 0, 0, 0) bordercolor(0, 0, 0, 255) STYLE(dottedline1, 1) anchor(TOPRIGHT)
drawtext("PM SESSION SILVER BULLET", -71, -12, SansSerif, Standard, 8) coloured(0, 0, 0, 255) anchor(TOPRIGHT)
endif
endif
endif
//// FVG
if drawfvg then
if (hour[1] = 9 and minute[2] = 0) or (hour[1] = 15 and minute[2] = 30 + Mybarminutes) then
fvg = 0
endif
alcista = close[2] > open[2]
if (alcista) then
maximo = low[1]
minimo = high[3]
if (maximo-minimo > rangofvg) then
if (fvg = 1) then
drawrectangle(barindex[2], maximo, barindex + 1, minimo) coloured (0,157,157,32) bordercolor (0,153,153,0)
if (maximo-minimo > rangosegmentosfvg) then
drawsegment(barindex[2], maximo - (maximo - minimo) / 2, barindex + 1, maximo - (maximo - minimo) / 2) coloured (255,255,255,96)
drawsegment(barindex[2], maximo - (maximo - minimo) / 4, barindex + 1, maximo - (maximo - minimo) / 4) coloured (255,255,255,96)
drawsegment(barindex[2], minimo + (maximo - minimo) / 4, barindex + 1, minimo + (maximo - minimo) / 4) coloured (255,255,255,96)
endif
else // opening fvg
drawrectangle(barindex[2], maximo, barindex + 10000, minimo) coloured (0,157,157,24) bordercolor (0,153,153,0)
if (maximo-minimo > rangosegmentosfvg) then
drawsegment(barindex[2], maximo - (maximo - minimo) / 2, barindex + 1, maximo - (maximo - minimo) / 2) coloured (255,255,255,96)
drawsegment(barindex[2], maximo - (maximo - minimo) / 4, barindex + 1, maximo - (maximo - minimo) / 4) coloured (255,255,255,96)
drawsegment(barindex[2], minimo + (maximo - minimo) / 4, barindex + 1, minimo + (maximo - minimo) / 4) coloured (255,255,255,96)
endif
endif
if (maximo-minimo > 1.5 or maximo < 10000) then // dibuja también el siguiente en caso de ser muy pequeño, <10000 evita el SP500
fvg = 1
endif
endif
else
maximo = low[3]
minimo = high[1]
if (maximo-minimo > rangofvg) then
if (fvg = 1) then
drawrectangle(barindex[2], maximo, barindex + 1, minimo) coloured (255,0,0,32) bordercolor (255,102,102,0)
if (maximo-minimo > rangosegmentosfvg) then
drawsegment(barindex[2], maximo - (maximo - minimo) / 2, barindex + 1, maximo - (maximo - minimo) / 2) coloured (255,255,255,96)
drawsegment(barindex[2], maximo - (maximo - minimo) / 4, barindex + 1, maximo - (maximo - minimo) / 4) coloured (255,255,255,96)
drawsegment(barindex[2], minimo + (maximo - minimo) / 4, barindex + 1, minimo + (maximo - minimo) / 4) coloured (255,255,255,96)
endif
else // opening fvg
drawrectangle(barindex[2], maximo, barindex + 10000, minimo) coloured (255,0,0,24) bordercolor (255,102,102,0)
if (maximo-minimo > rangosegmentosfvg) then
drawsegment(barindex[2], maximo - (maximo - minimo) / 2, barindex + 1, maximo - (maximo - minimo) / 2) coloured (255,255,255,96)
drawsegment(barindex[2], maximo - (maximo - minimo) / 4, barindex + 1, maximo - (maximo - minimo) / 4) coloured (255,255,255,96)
drawsegment(barindex[2], minimo + (maximo - minimo) / 4, barindex + 1, minimo + (maximo - minimo) / 4) coloured (255,255,255,96)
endif
endif
if (maximo-minimo > 1.5 or maximo < 10000) then // dibuja también el siguiente en caso de ser muy pequeño, <10000 evita el SP500
fvg = 1
endif
endif
endif
endif
//// CLOSING LEVELS
if drawclosinglevels then
// linea en precio post-cierre a las 17.45 hora europea
if (hour[1] = 17 and minute[1] = 45 + Mybarminutes) or (hour[1] = 18 and minute[1] = 0 and Mybarminutes = 15) then
drawray(barindex[2], close[2], barindex[1], close[2]) coloured(0, 128, 0, 64) STYLE(dottedline3, 1)
endif
// linea en precio post-cierre a las 16.15 hora americana
if (hour[1] = 22 and minute[1] = 15 + Mybarminutes) then
drawray(barindex[2], close[2], barindex[1], close[2]) coloured(0, 0, 128, 64) STYLE(dottedline3, 1)
endif
endif
endif
return