Hi folks,
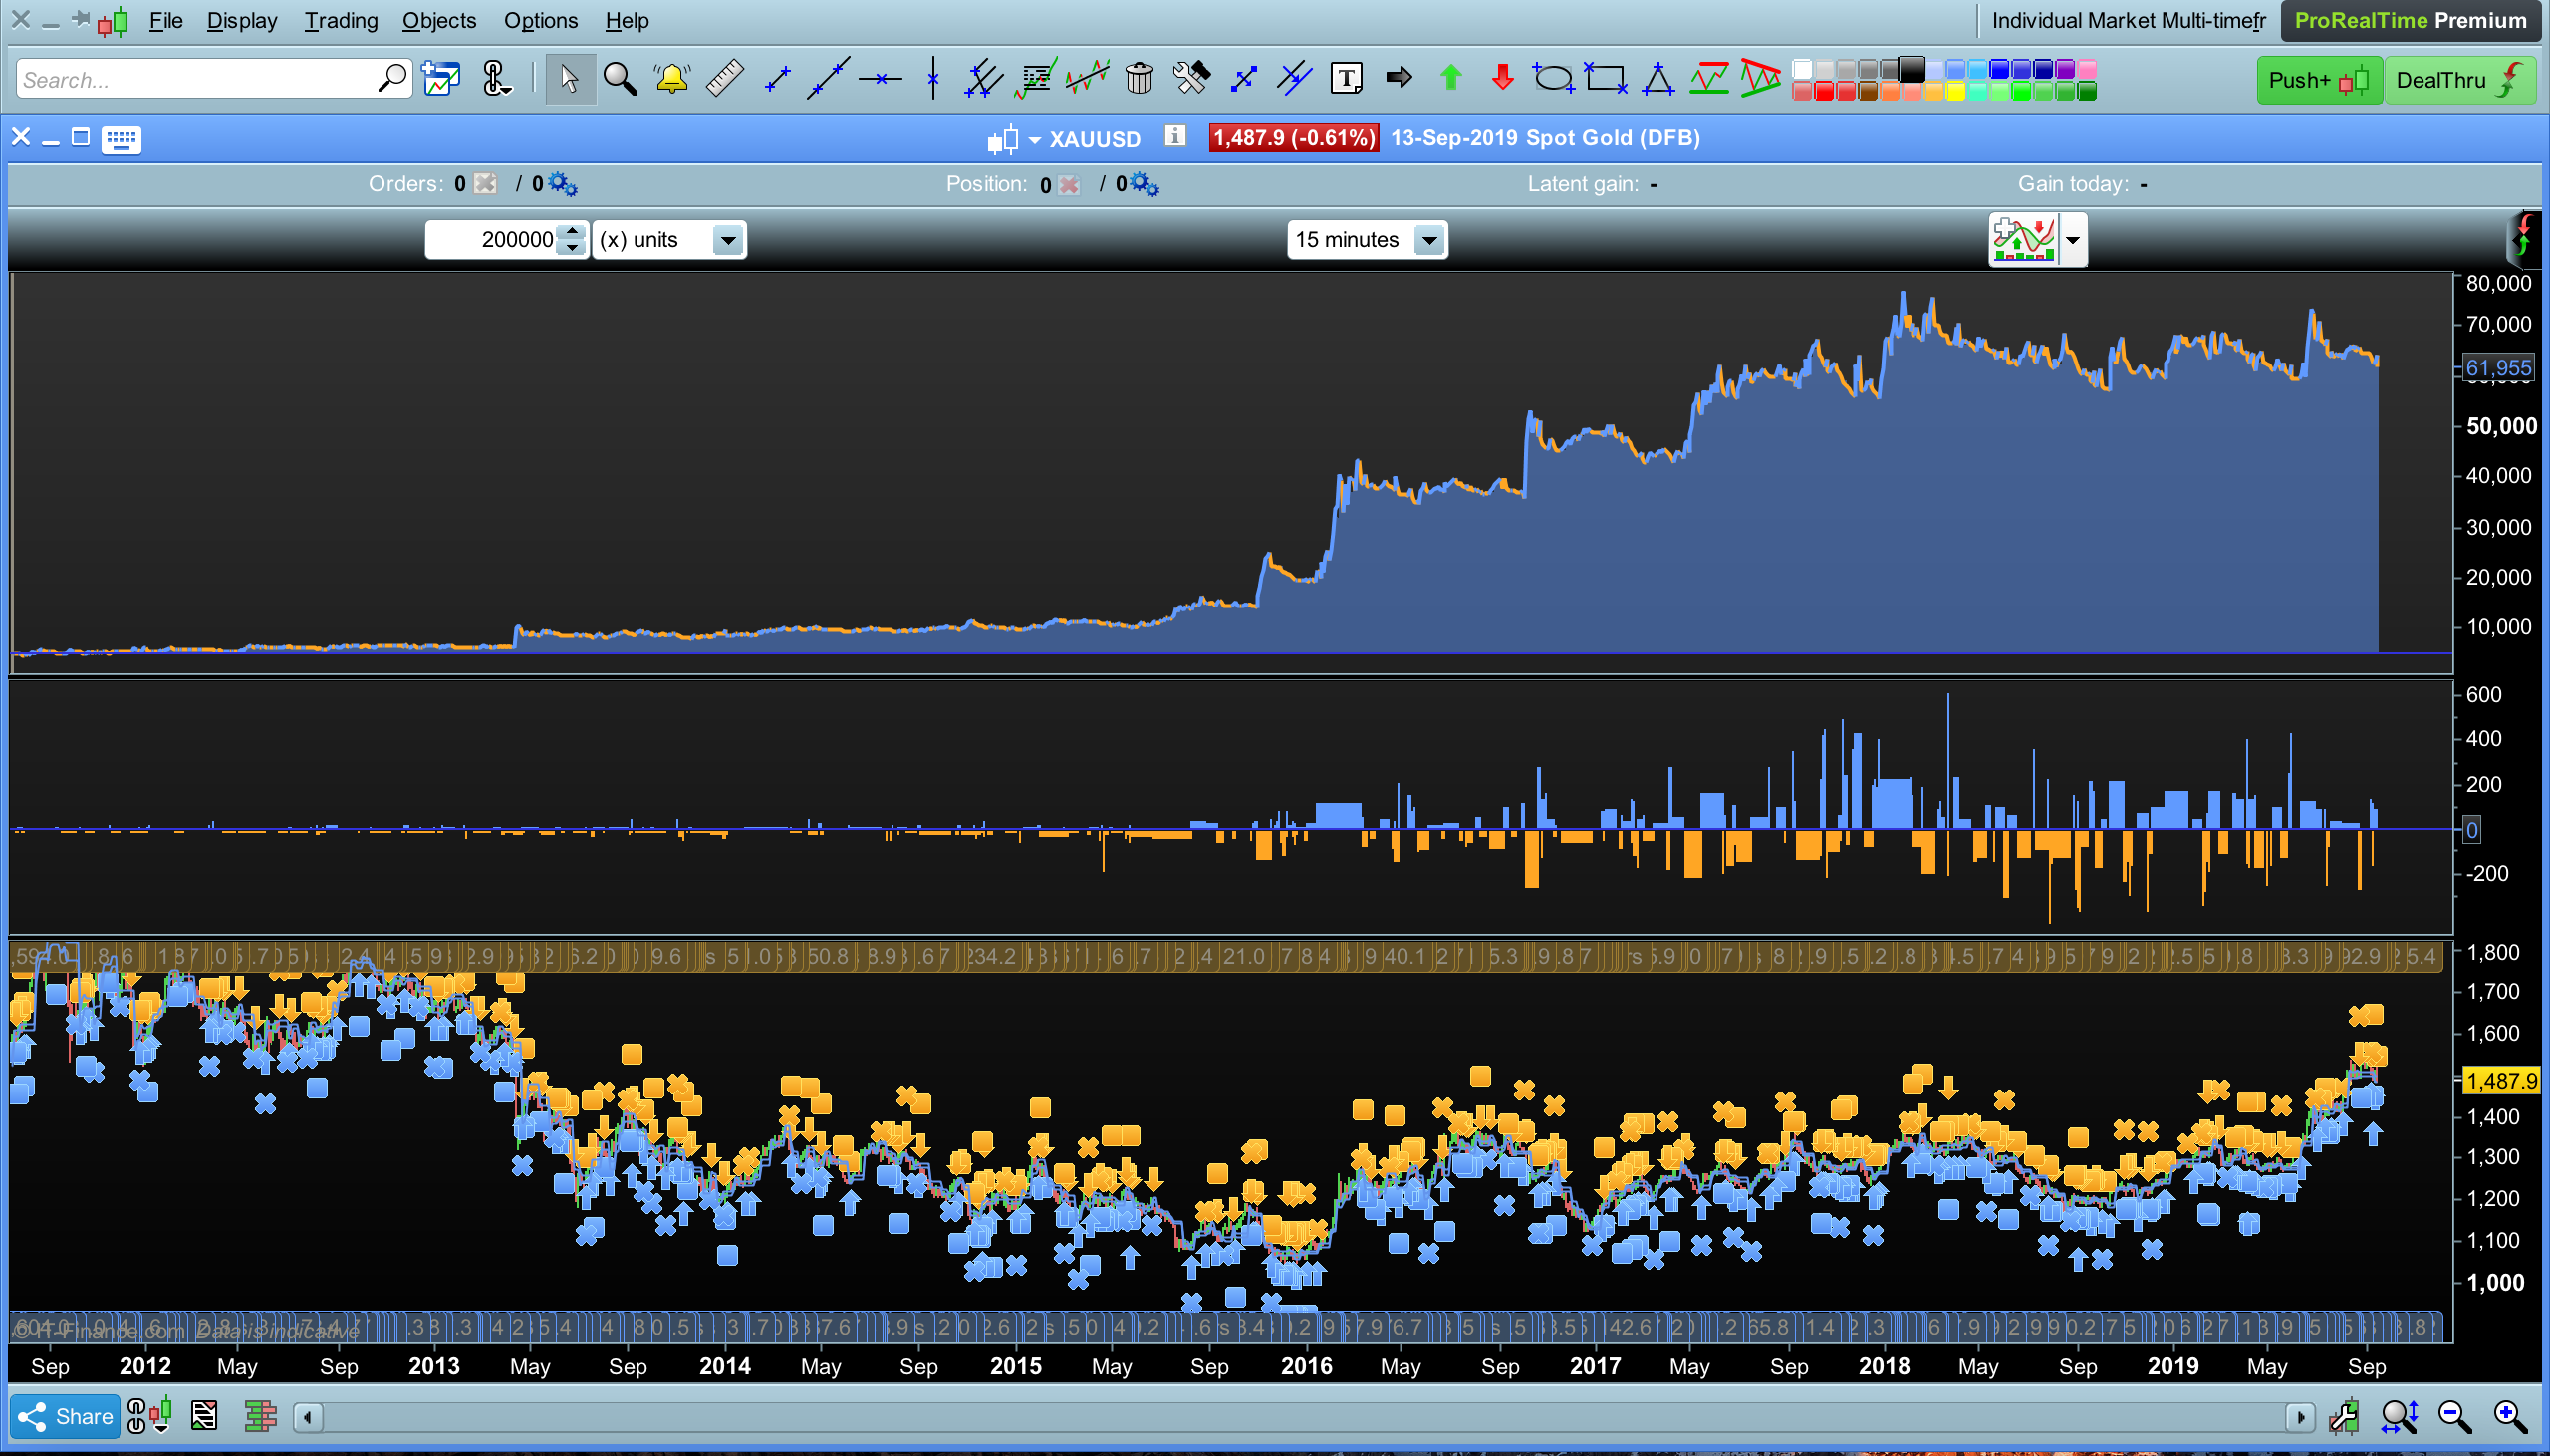
I’d like to get your opinion on some results of a system Ive been developing on Gold. Without giving away all the details, the system is a breakout style. It uses a donchian channel to define a range and then trades the breakout of that range (its a bit more complicated than that but thats the gist). It then follows the trend as far as possible with another donchian. In total the strategy has 3 parameters that govern various look back periods.
I have tested the sample by optimising on half the data and then testing on the other half and both ways it gives solid results.
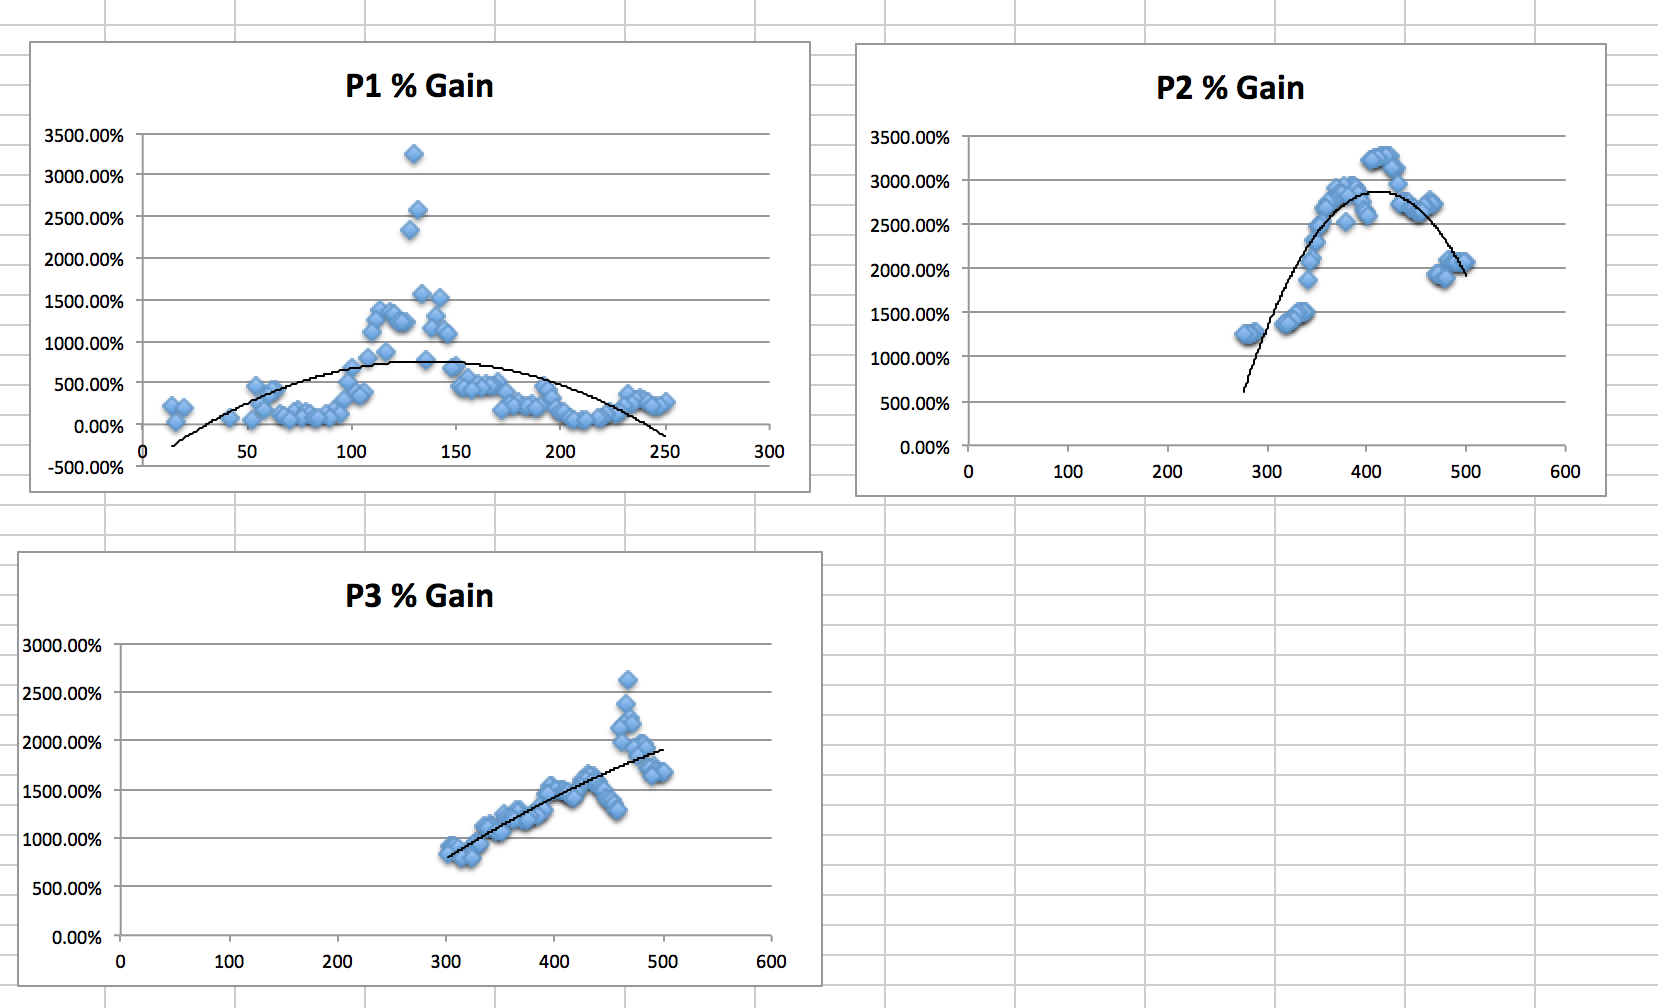
What I’d like your opinion on is the attached plots which show the distribution of performance when I optimise each parameter separately (thanks Vonsai for the suggestion in previous post). You can see that P1 in particular has a clear peak in the lookback, which is a bit concerning.
The strategy also performs on Silver, Crude, DAX, Bitcoin but the loopback periods need to be adjusted for each market.
Any thoughts greatfuly received. Im trading the system in demo right now and its behaving its self (i.e. trading as its supposed to).
Thanks,
Thally
First of all you don’t say what time frame you are trading on as 50% of 1 second history is very different to 50% of daily history.
The peak in p1 is concerning but without knowing what the variable was applied to it is impossible to say how concerning. If it is a simple MA then yes it is possibly very fitted. If however it is a much more interesting calculation and it works almost exactly the same on a variety of markets then we can forgive it the spike where it works best – as long as it is the same or a similar spike on a lot of markets.
Ultimately after robustness testing forward testing in demo is your only true way to prove whether your analysis is correct and P1 is curve fitted or not and in my mind the faster the time frame you are trading on the longer the forward testing should be – but that is just my humble opinion as someone who needs a lot of history to prove that what just happened in the last minute will keep happening!
Cheers Vonsai.
Its a m15 timeframe, but also works on H1 and I’m sure on others too but haven’t tested. The parameters are not moving averages. Its a breakout system that uses a Donchian channel to define the range and another Donchian to trail a stop once we’re in and a third calculation that I can’t disclose which also has a loopback window. The parameters are the loockback periods of the Donchains and my calculation.
The fact that it works across indices, energies, metals gives me some more confidence and the parameter sets for each are all within +/- 20%.
Thanks for the input.
Donchian channels are as easy to curve fit as moving averages and if p1 is a donchian channel look back period then I would be concerned. The 15 minute time frame does not give a huge amount of history for confident back testing Also how many trades are we talking about? Without sharing equity curves, trade quantities, draw down or ultimately the whole strategy it will be impossible for anyone else but you to say any more than the fact that p1 looks a bit peaky which you have already worked out yourself. Without the exact condition that uses p1 everyone else can only guess. It would be interesting to see results of a robustness test especially on values either side of p1.
At the end of the day it is like Nicolas has sometimes told me – you will be surprised by the crazy stuff that sometimes works that you think should not work!
Cheers Vonsai. So I’ve done a bunch of testing and analysis and thought I’d share this incase it helps other with similar issues. The long and the short of it is that I think the outrageous performance of the strategy with the optimal parameter is unlikely to be robust, but nevertheless the zone of parameter space that is more robust still performs very well.
Here’s what Ive done…
- Analysed the distribution of performance vs parameter value. You can see that its hugely peaked and there are a cluster of values that give outrageous performance.
- Analysed the distribution of parameter values that are in the top 100, this give roughly a normal distribution so we can take the mean. The thought is that the mean of this distribution is more likely to give a parameter value that is robust because the highest frequency of top 100 values occur in this region.
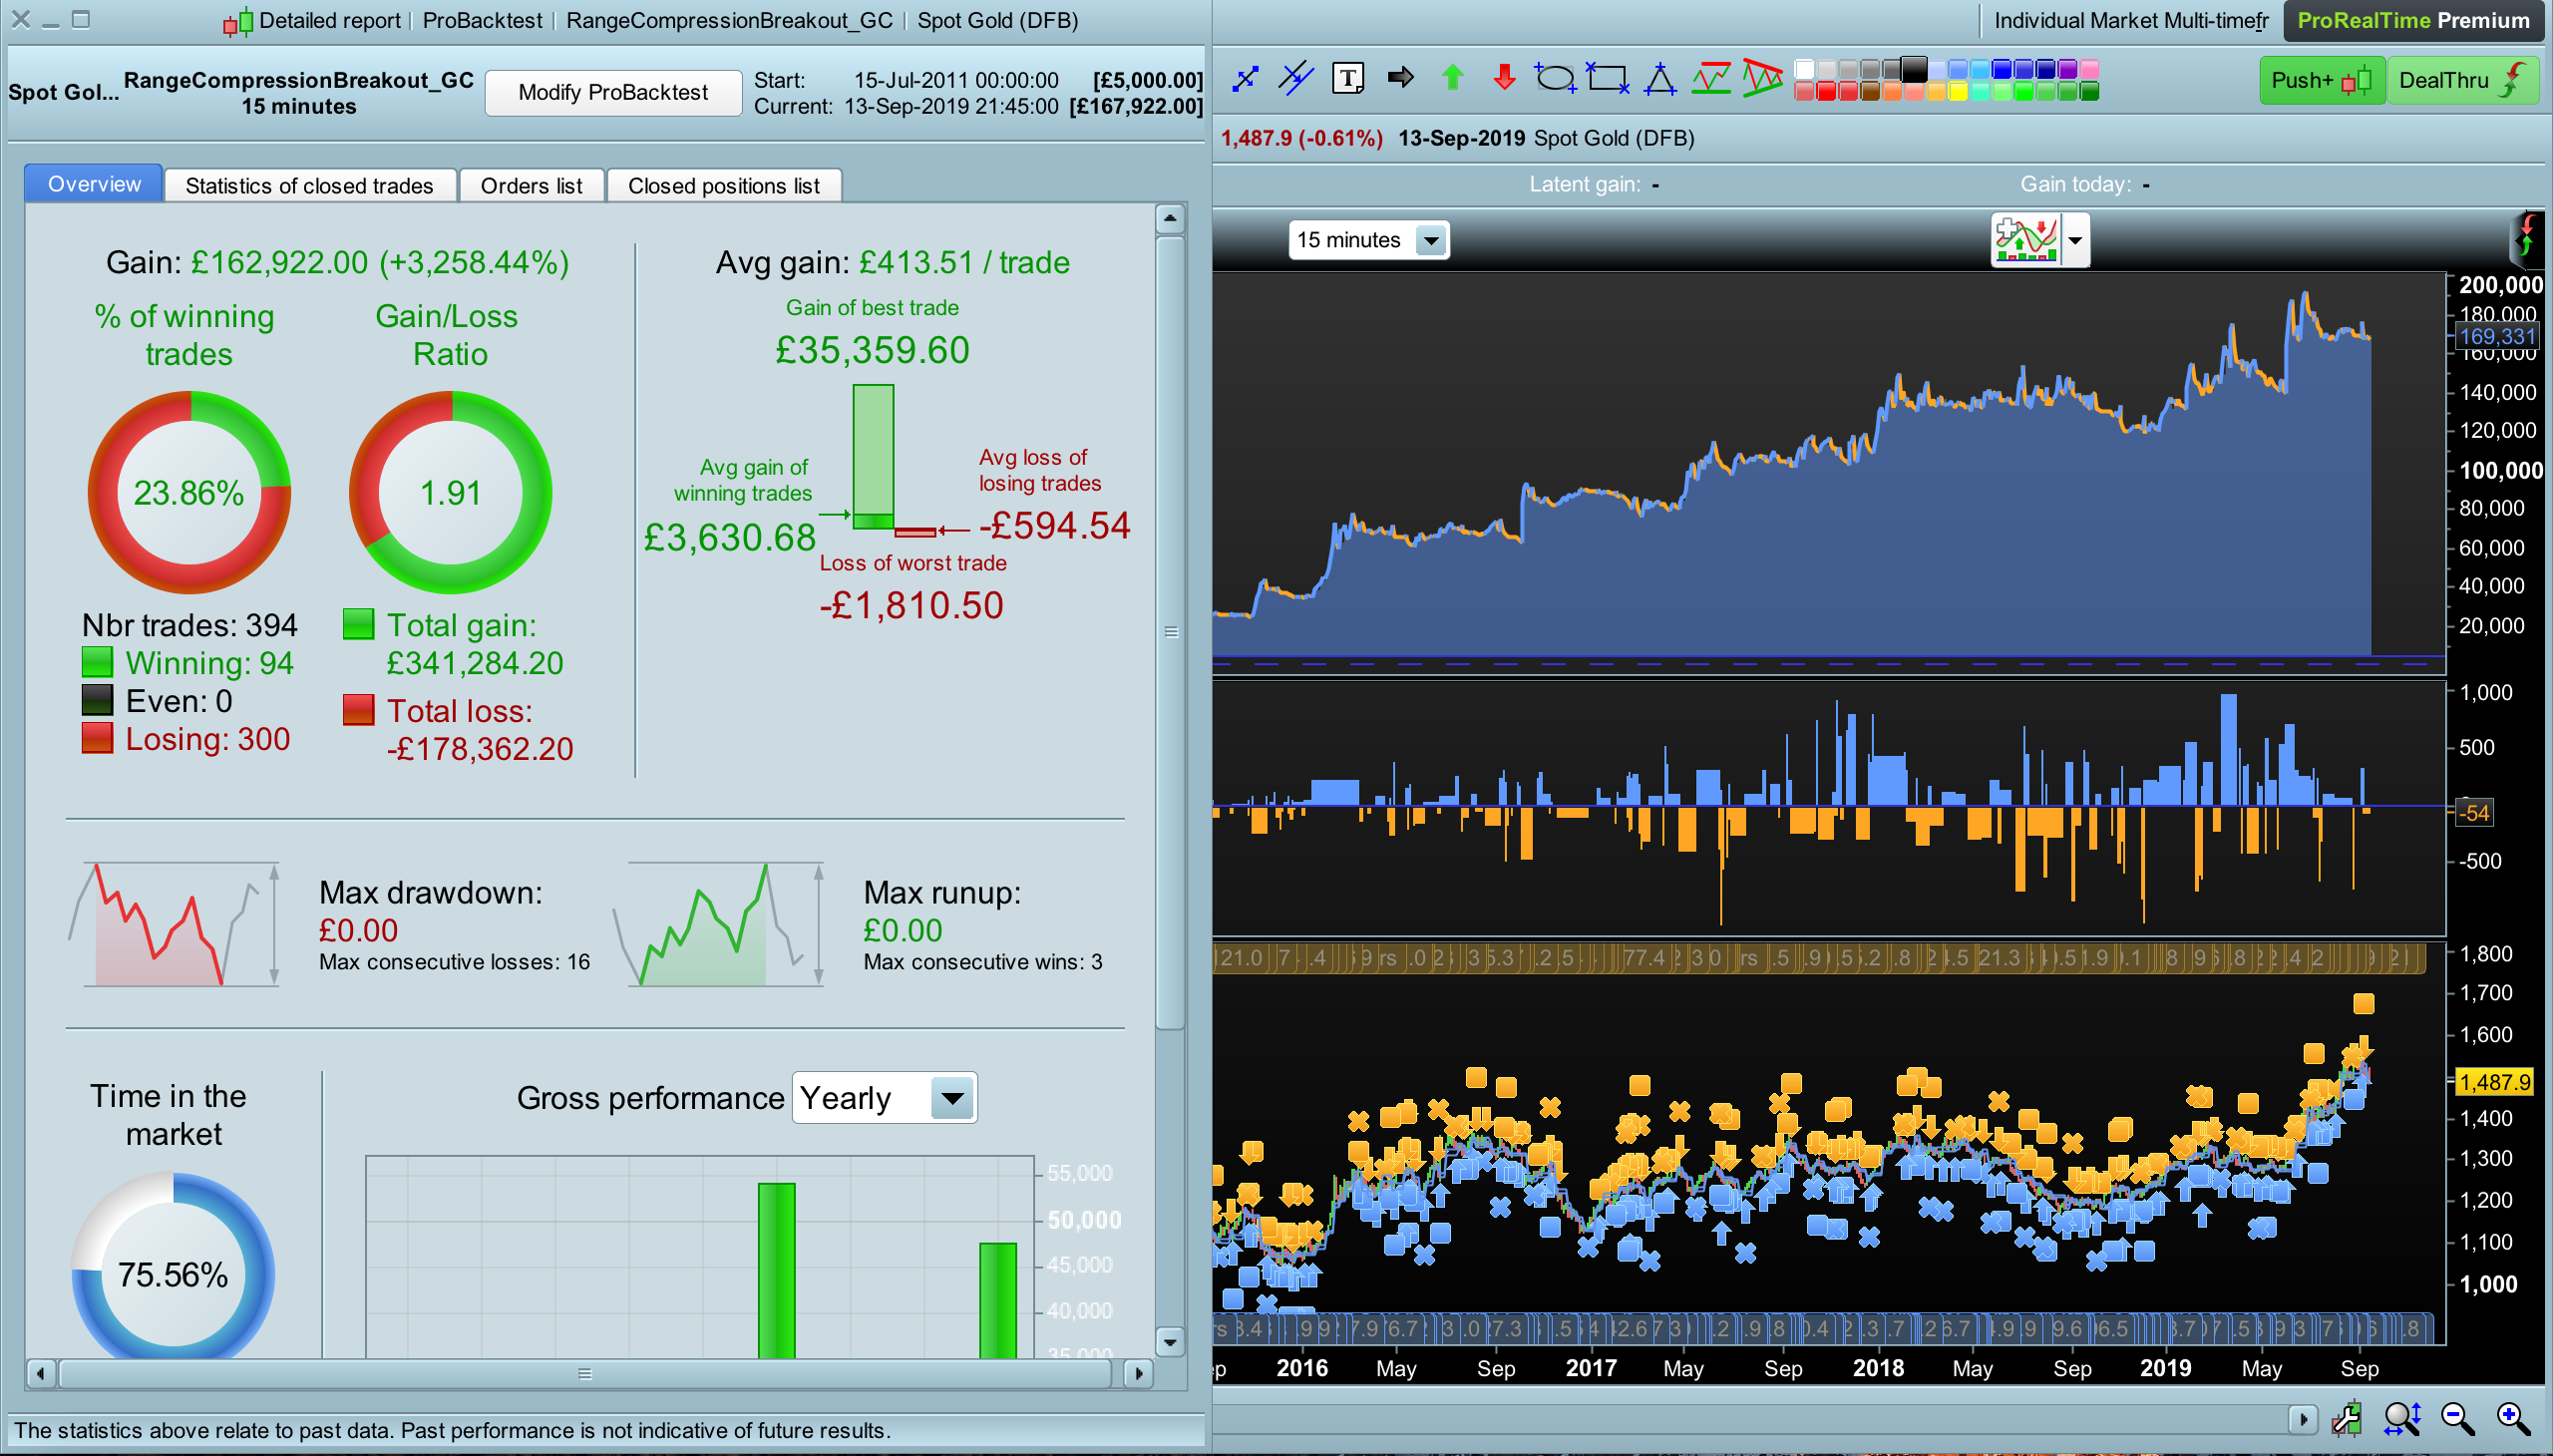
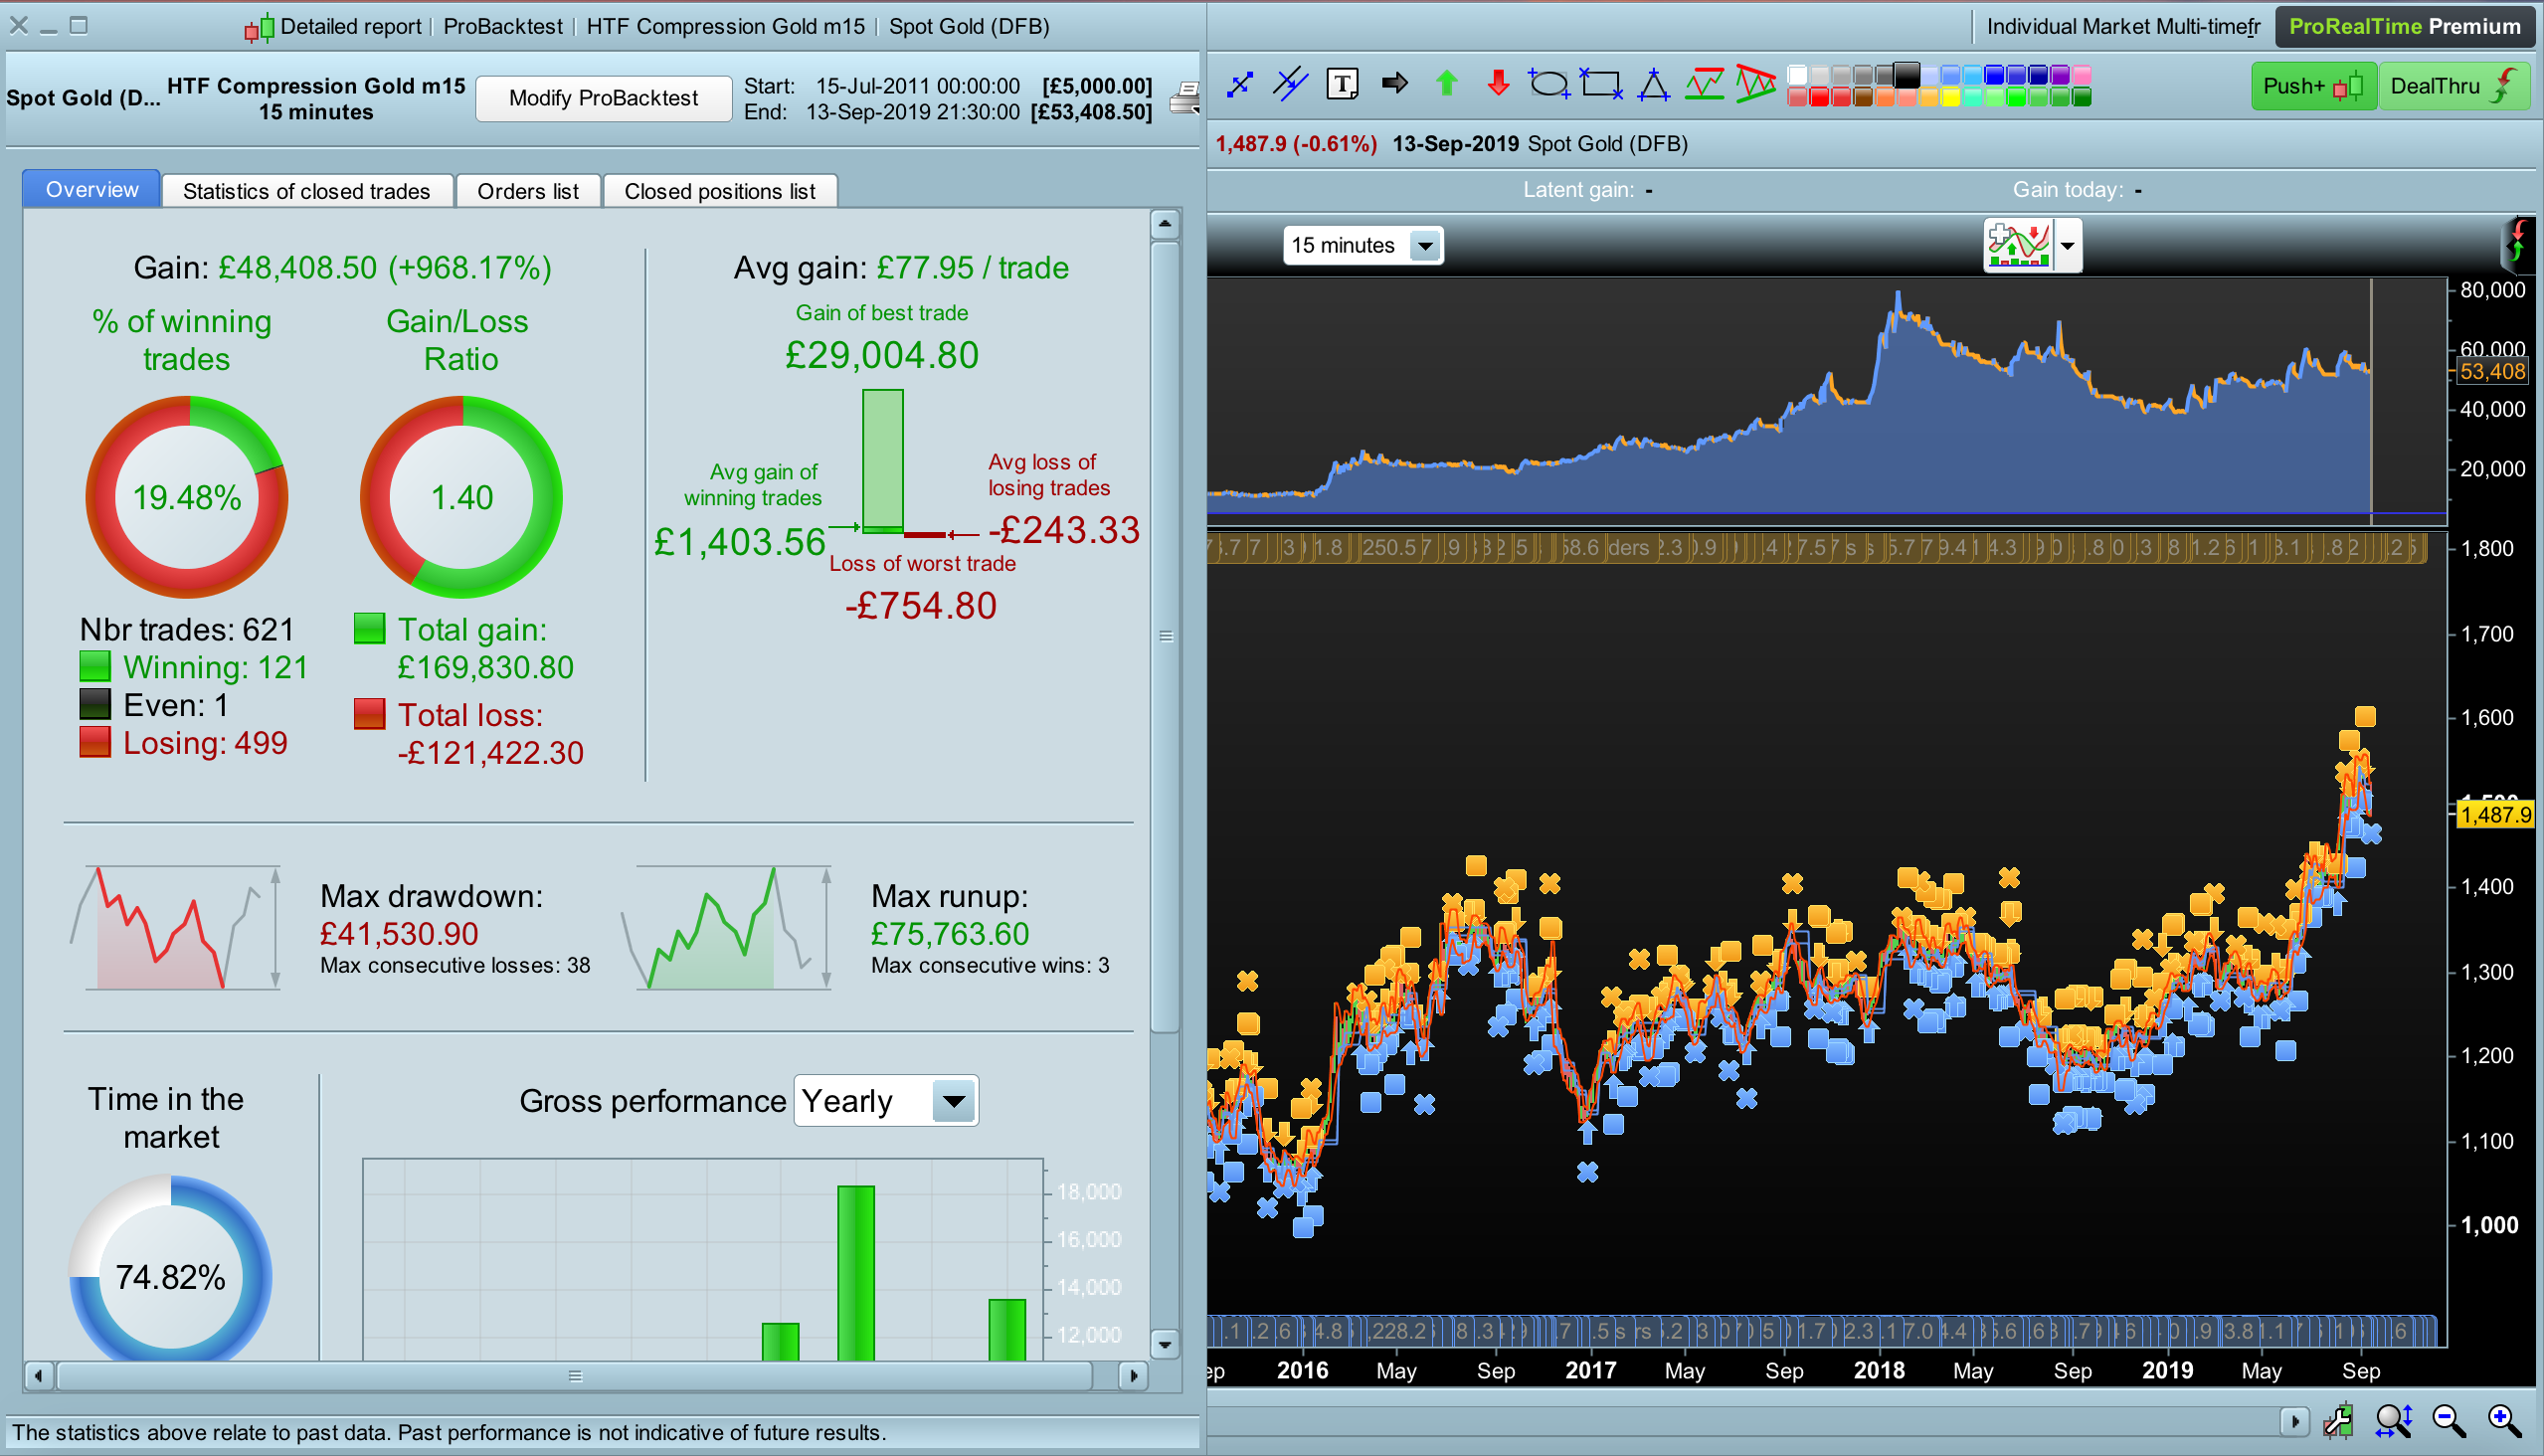
Attached are the analysis plots of the distributions as well as the performance stats and equity curves for the optimal vs average parameter.
Interestingly, I also figured out a way of capturing the range without having to use a Donchain channel that has a look back by using a higher timeframe pattern, this gives very similar stats to the average parameter giving further credence to the idea that optimal parameter is unlikely to be robust but the system logic is good.
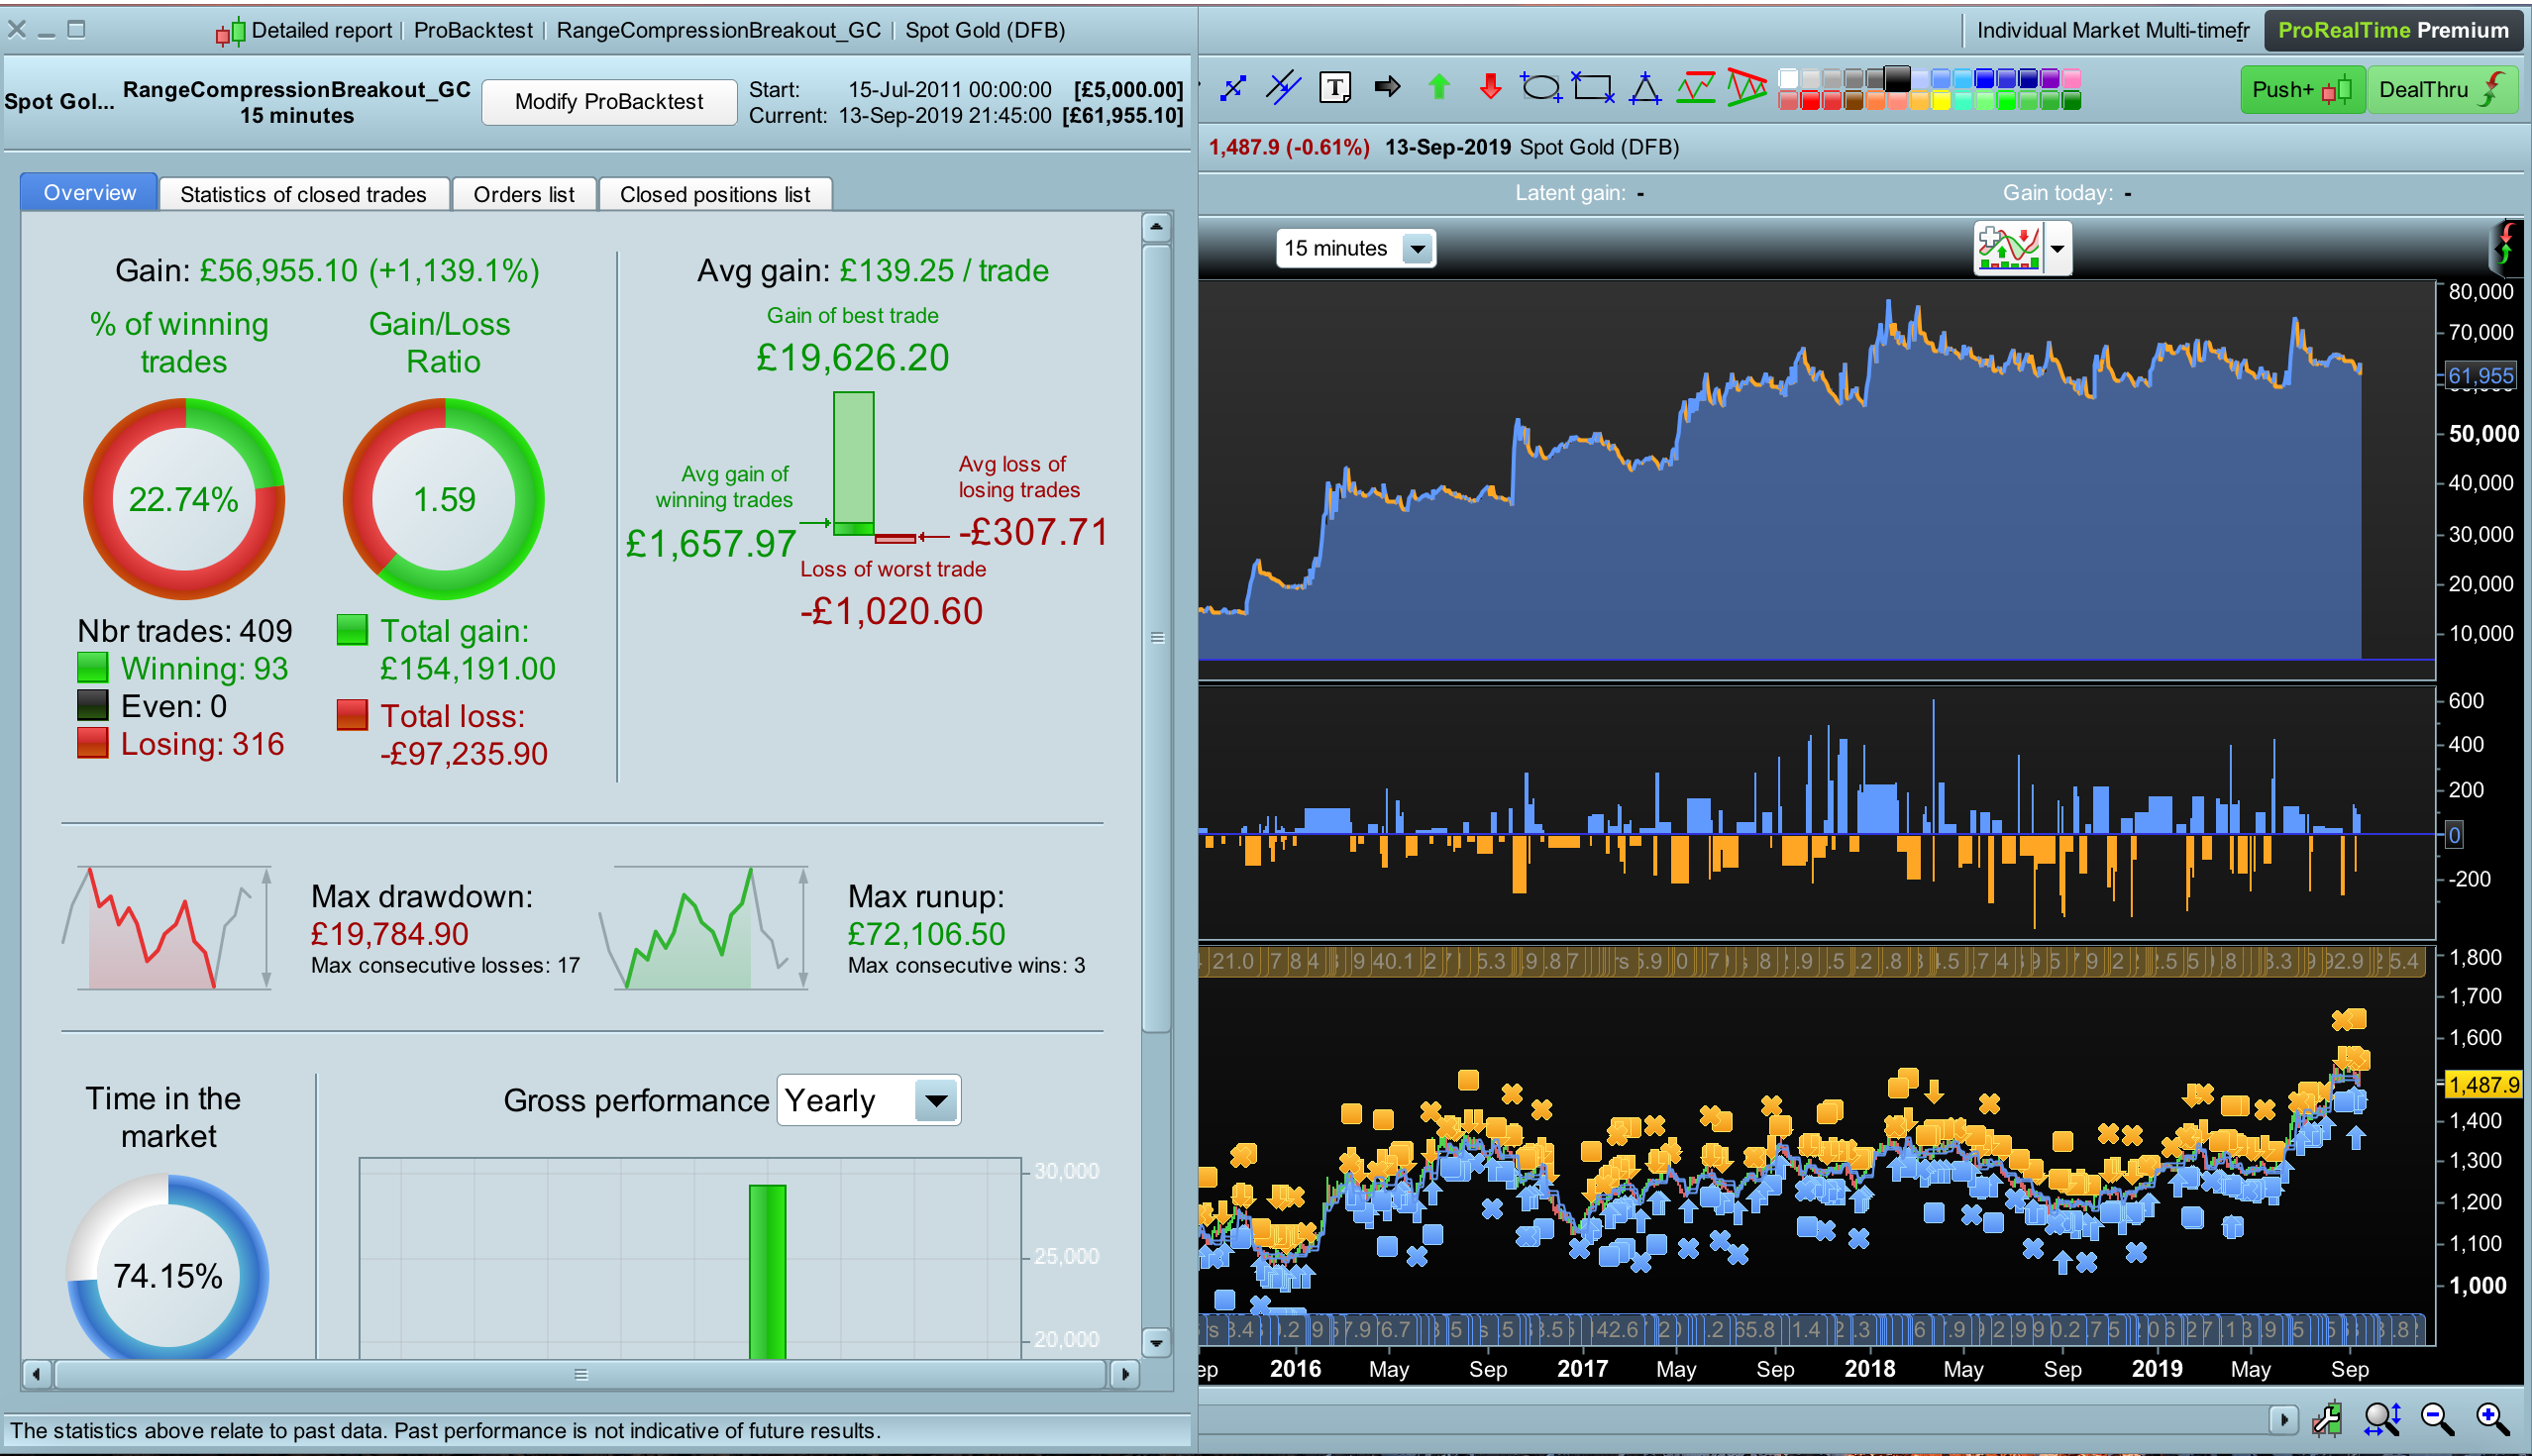
And here are the performance data for the average parameter
Finally here are the performance data for the system that uses higher timeframe price patterns and requires no optimisation. Clearly it performs worst, but still pretty good. I’d be interested in your thoughts as which is the best to trade. My gut feeling is that the system with no optimised parameters is the better system and have the best chance of continuing to perform into the future.
My gut feeling is that the system with no optimised parameters is the better system and have the best chance of continuing to perform into the future.
If you wanted me (or Vonasi) to test the System robustness then if you post the System on here I would gladly analyse for you.
Check out the Thread / link below … you may prefer to test it yourself?
. I think this tester might actually be the most important thing that I have coded so far
Thanks for promoting the robustness tester GraHal.
The only comment I would make is that the 15 minute time frame does give us a very limited data sample and the robustness tester can show us what randomising our entries on that sample would look like for a lot of random entries but it cannot tell us how robust it is on a much bigger sample of data. OOS testing is the only thing that can tell us that as that gives our strategy a chance to trade in different market structures. However starting a forward test with a proven robust strategy on an IS test is always better than starting a forward test with an unrobust strategy that also looks like it has peaks in the optimisation of variables.
Thanks both for your comments. I will have a look at Vonsai’s robustness tester.
As for the data with m15. Not much that can be done about that. I prefer to trade intraday strategies so I work on m1 to m15 and sadly the historical data on PRT are limited without switching platforms Im not sure what can be done about that other than to keep a close eye on the strategy and try to understand based on the system’s logic why/if it stops working given the new market regime.
I had heard that we’d have a lot more data when v11 comes out. Is that your understanding also? Any ETA on v11?
Congratulations on trading breakout of higher highs and lower lows. You are right of being concern by the lookback period of that HH and LL, because you are just following the price when it goes up and selling it when it goes down, but it depends mainly on the way you are deciding when it is the case (by adjusting donchian channel periods).
Dear Nicolas, I am pretty new to the algorithmic trading so forgive me if my systems and approach is naive or unsophisticated.
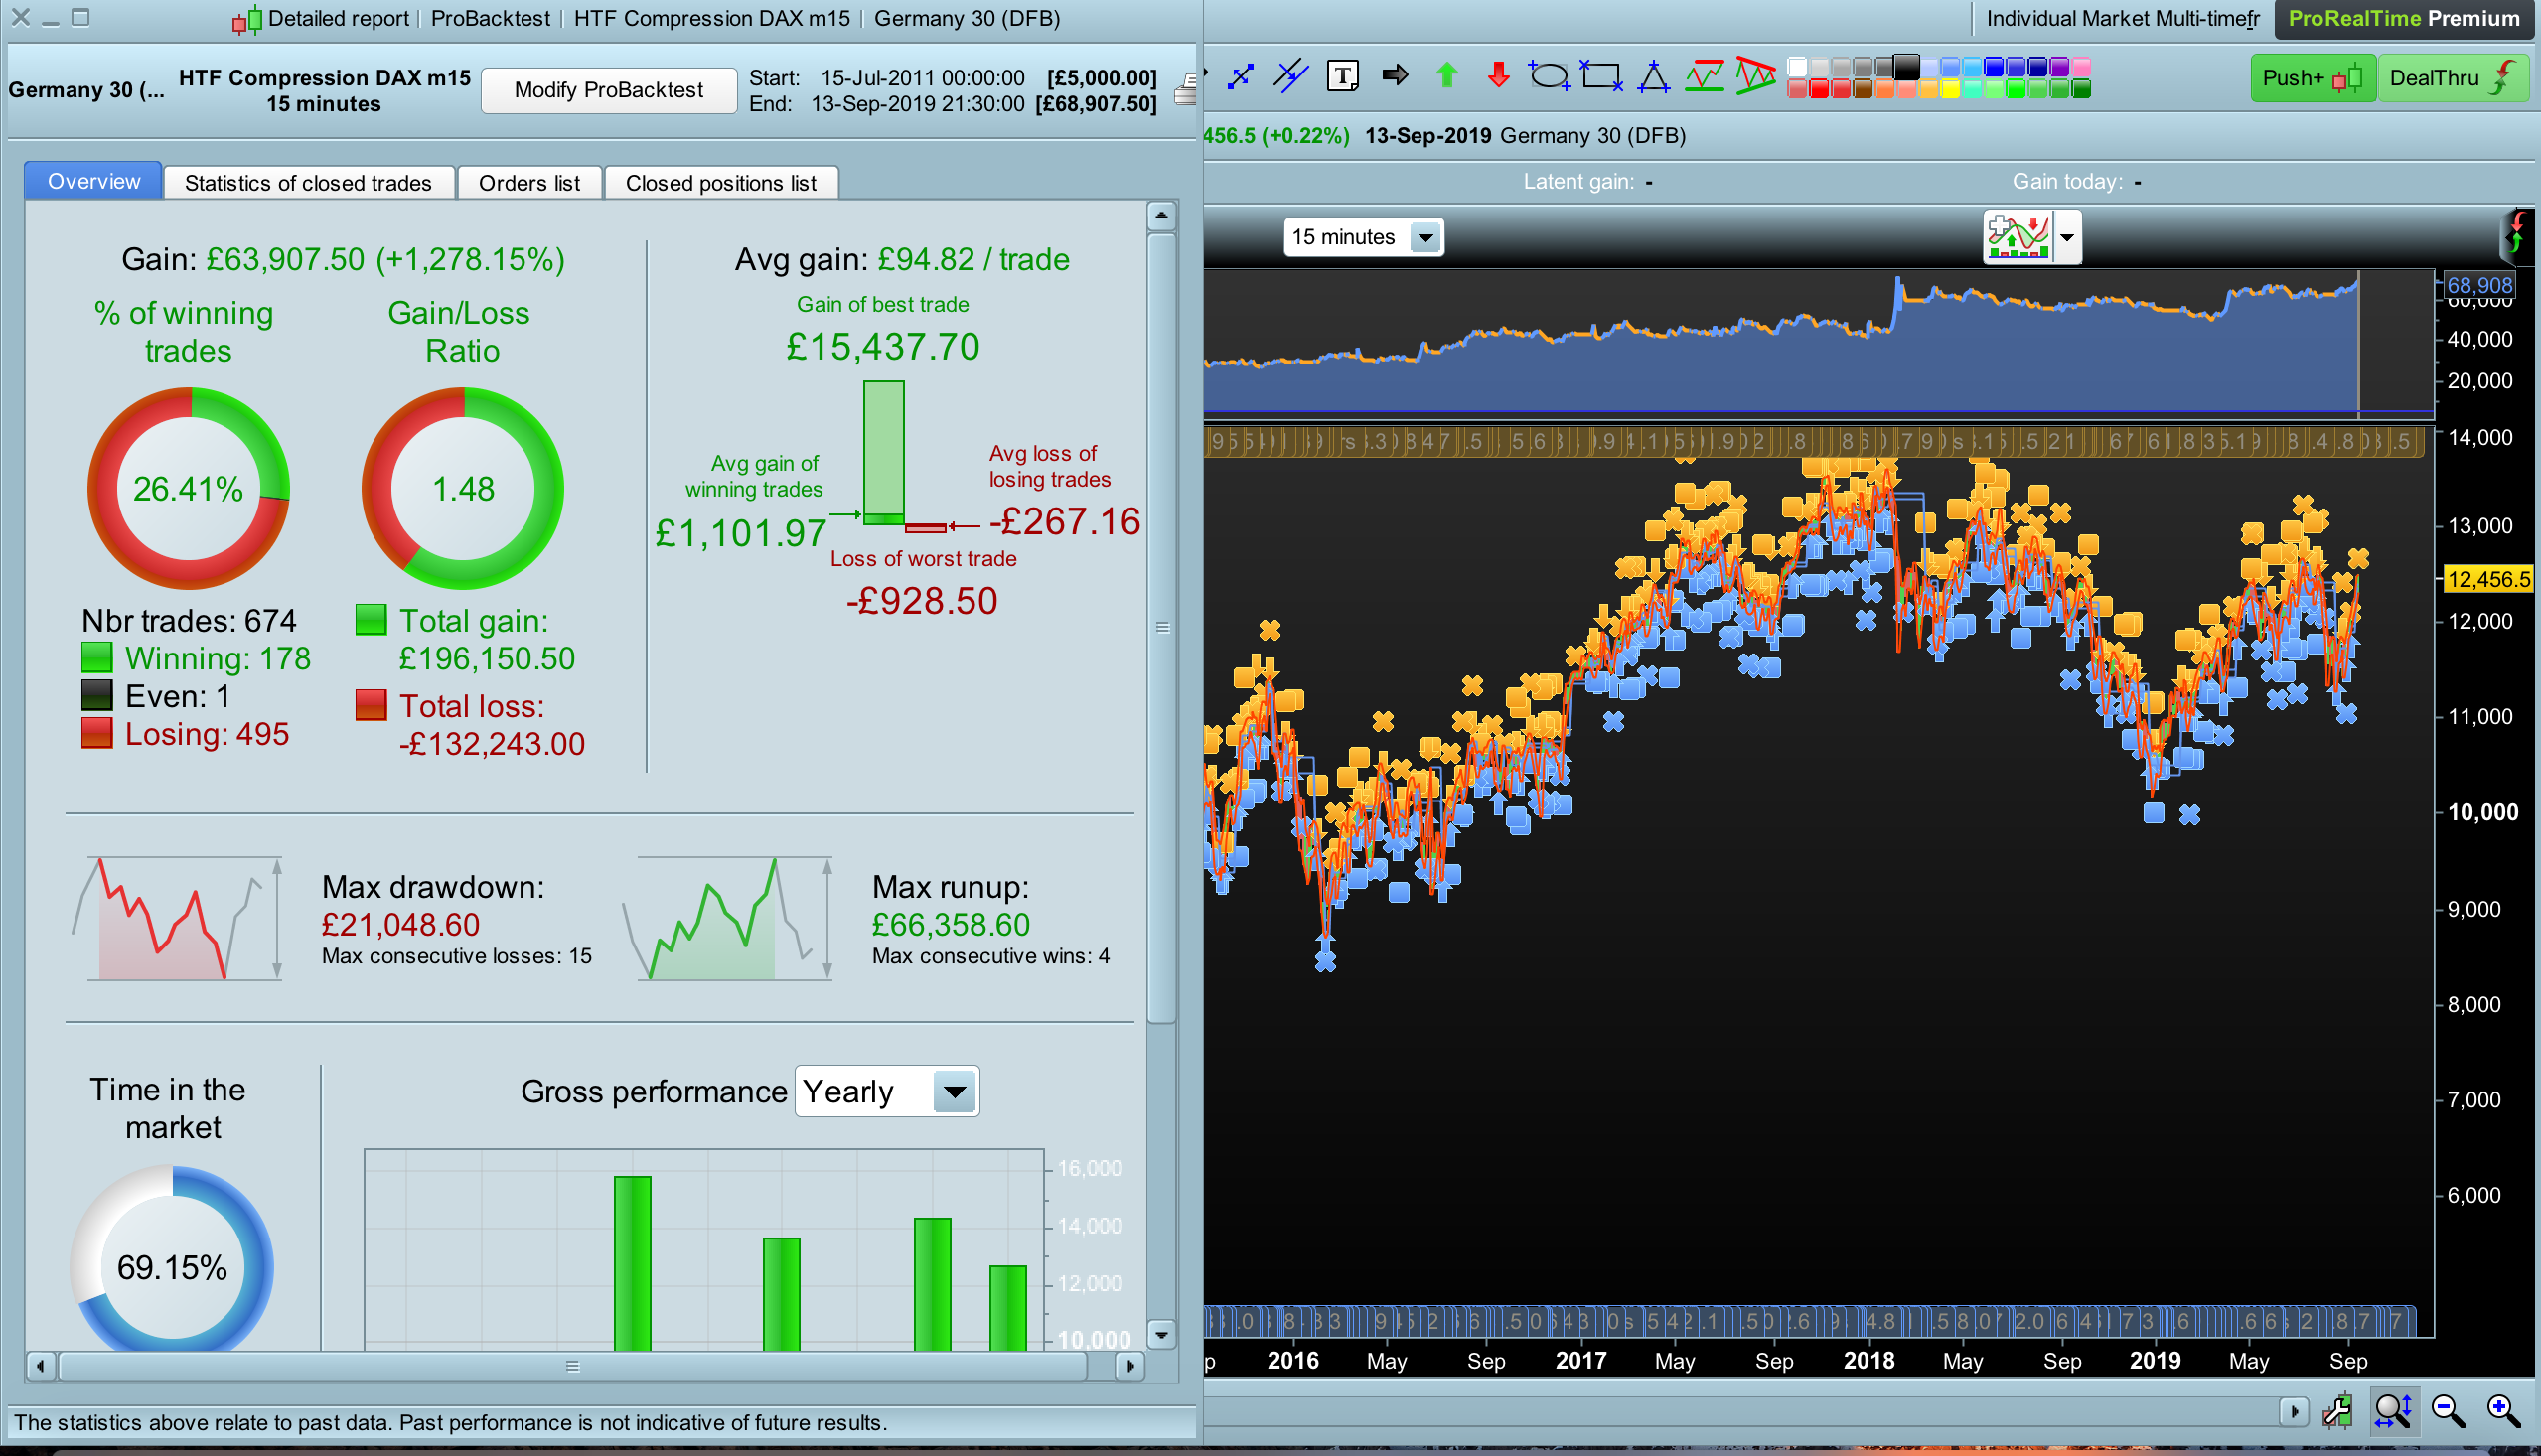
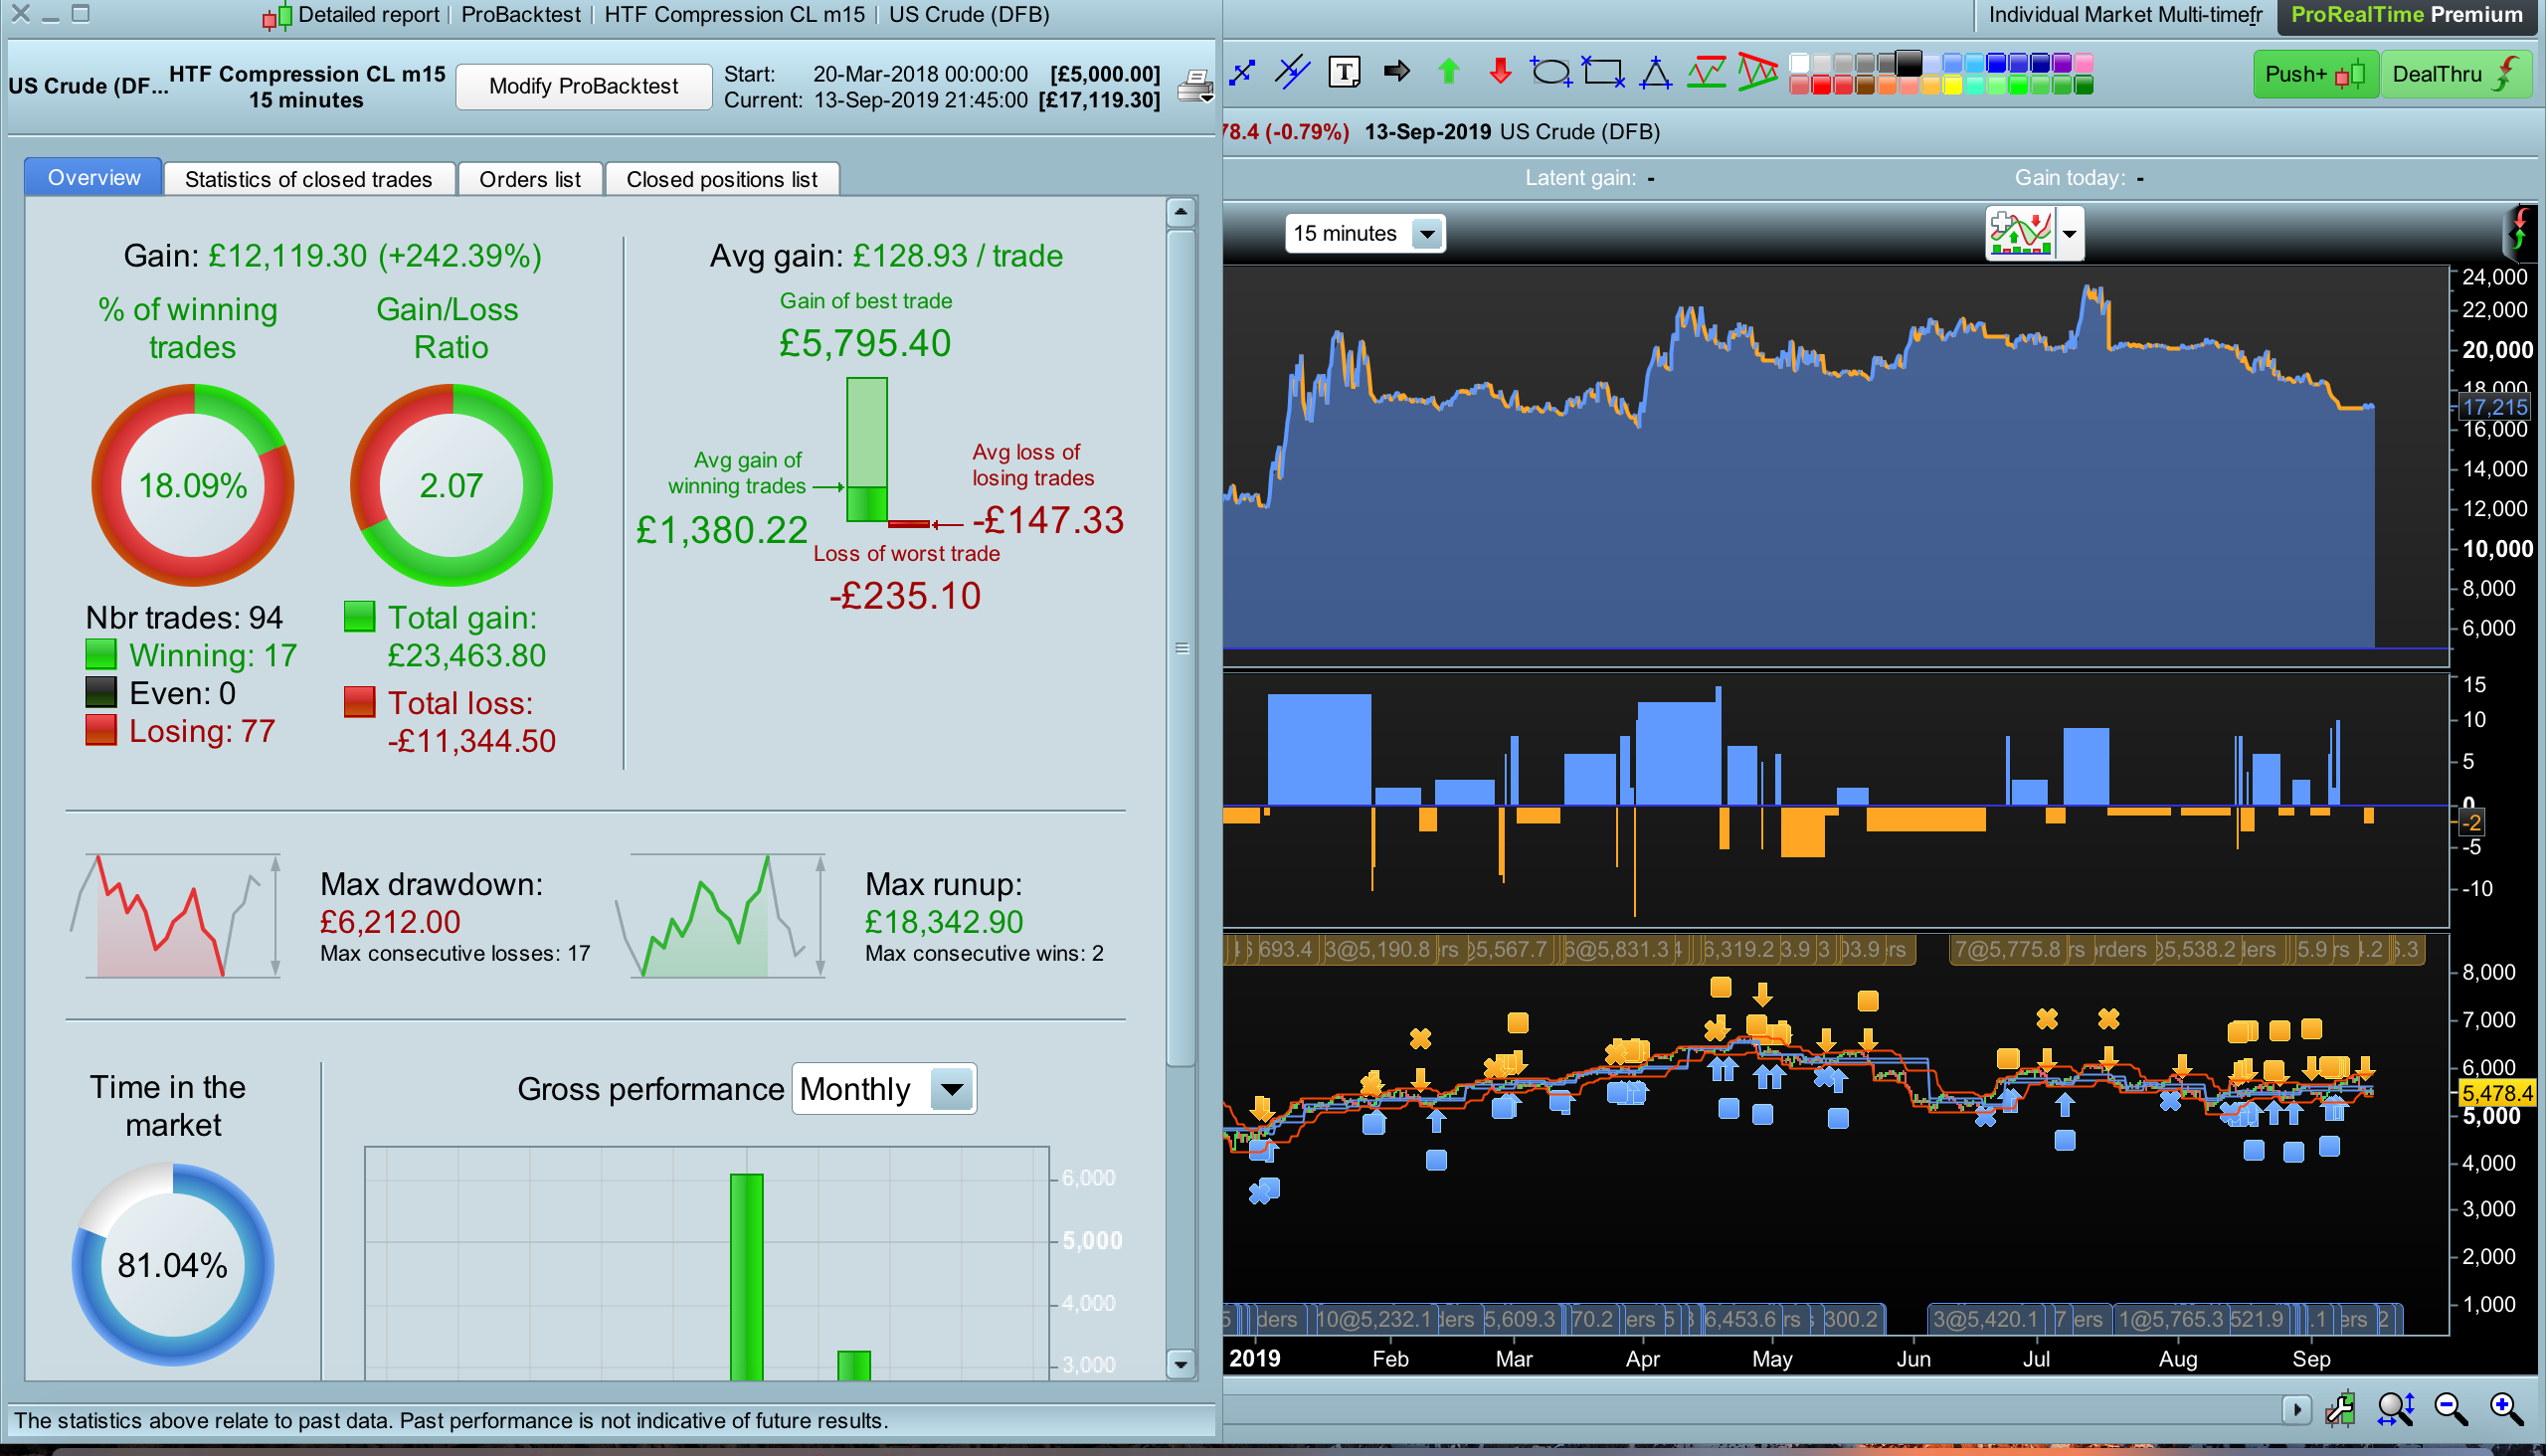
My system is not just as simple as the breakout of a Donchian (though as Im sure you know those kinds of systems have made money in the markets for years). Rather, it looks for regions of extreme price compression and then trades the breakout of those. The initial system used a Donchain channel and looked for zones of compression based on lookback windows. I have since discovered a way to replicate this system by using candle stick patterns on a higher timeframe to define the region of compression, negating the need to use Donchain channels and thus free of parameter optimisation. I shared the results of that system for Gold too. Attached here is the same system applied to DAX and Crude Oil. I find it encouraging that it delivers good results on these diverse markets, but really I will have to donate some money to the market to know for sure whether the system works.
Hello! I just wanna add my 2 cents with this:
Systems with 20-30% winrate where we can also clearly see where “the money is made” are usually (read: usually, not always) curvefit and ugly. These are the sort of systems that break when checking with monte carlo test.
The problem is that if you remove your top 10% winners, your system would break (im assuming).
When a system looks like this, you are 100% dependent on that these huge moves will happen again to make up for all the losses. But as we all know, the past trends and big moves, are unlikely to happen in the exact same way in the future.
Another big thing about these types of systems are the insane max loss in a row, and its not like the max loss in a row that we are seeing from your backtests are “few and far between”… its basicly every single time until theres a big winner.
Its risky and its going to feel extremly uncomfortable to be sitting through “yet another 20 loss streak” in the same year..
Sorry Thally if I sounded rude or too direct in my last post.. Monday morning, you know! 😉
Higher highs and lowers lows detection can take a lot of names, Donchian channels or not, there is always tops and bottoms of price that will be breached someday. Finding effective narrowing price channel is quite difficult and I salute the work done here.
May I ask why the contracts size change so much over time in the backtest? Are you using a risk adjustment size calculation?
Thanks for your input Jebus. I know where you’re coming from.
From the work Ive done so far, all I’ve read and the traders Ive interacted with, low win rates, lots of small losses and sporadic large winners are characteristic of all breakout/trend following systems. Conversely, high win rates, lots of small winners and the occasional large loser are charcteritics of counter trend systems (at least they are in the systems Ive built)
If I were to add a whole bunch of conditions to avoid the small losses while keeping hold of the winners (if thats even possible) then I’d almost certainly have to curve fit the system to data.
My feeling is that the above mentioned trade offs are a fact of life and there are no holy grail systems (at leat that I’ve found) which can keep the benefits of both trend and counter trend systems.
This is a swing system that tries to capture multiday trends, I have built several intraday (close at the end of the day) breakout systems in which I am able to use pattern filters to only trade on days that have a higher probability of trending – these deliver win rates closer to 50% for breakout systems. However, the longer term trends (which the present system is trying to catch) are much more erratic and harder to predict across all markets so pattern filters are less effective.
My overall strategy is to have a basket of trend and counter trend systems across a variety of markets that work on different timeframes that way the benefits of each type of system should (theoretically) compensate for the weaknesses of the others.
One more thing I will try with this system is to see if scaling up to H1 timeframe cuts down on the false signals.