Hi all, coming at you with this strategy using the latest indicator in the library by @IV Mcm with an added bonus: I added K= 1 for bull trends and k = -1 for bear trends, just so its easier to call. You then need to add a bollinger band on the MM3 line with the settings “Period: 10 + STD: 1”
Indicator here:
//
//============================== Indicateur

Trend1 = ADX[5]
Trend2 = ADX[10]
Trend3 = ADX[15]
Trend4 = ADX[20]
Trend5 = ADX[25]
Trend6 = ADX[30]
Trend7 = ADX[35]
Trend8 = ADX[40]
Trend9 = ADX[45]
Trend10 = ADX[50]

MM = average[20](close)
Bolup = MM+STD[20]*1.0
Boldw = MM-STD[20]*1.0
Bol1 = MM+STD[20]*1.0
Bol2 = MM-STD[20]*1.0
Bol3 = MM+STD[20]*2.0
Bol4 = MM-STD[20]*2.0

CMM1 = Bol1-MM
CMM2 = MM-Bol2
CMM3 = Bol3-MM
CMM4 = MM-Bol4

MM0 = average[1](close)-(close)
MM1 = average[1](MM0)+(CMM1)
MM2 = average[1](MM0)-(CMM2)
MM3 = average[1](MM0)+(CMM3)
MM4 = average[1](MM0)-(CMM4)

TrendT1 = Trend1 > Trend1[1]
TrendT2 = Trend2 > Trend2[1]
TrendT3 = Trend3 > Trend3[1]
TrendT4 = Trend4 > Trend4[1]
TrendT5 = Trend5 > Trend5[1]
TrendT6 = Trend6 > Trend6[1]
TrendT7 = Trend7 > Trend7[1]
TrendT8 = Trend8 > Trend8[1]
TrendT9 = Trend9 > Trend9[1]
TrendT10 = Trend10 > Trend10[1]
Trend = TrendT1 or TrendT2 or TrendT3 or TrendT4 or TrendT5 or TrendT6 or TrendT7 or TrendT8 or TrendT9 or TrendT10

//============================== Trend Bullsih


CA1 = close > MM and close > Bolup and Trend
Bullsih = CA1

if Bullsih then
A = 1
else
A = 0
endif
once k = 0
if A = 1 then
drawcandle(MM2,MM1,MM2,MM1)coloured(28,144,194,50)
R = 28
G = 144
B = 194
T = 250
k = 1
endif

//============================== Trend Bearish

CV1 = close < MM and close < Boldw and Trend
Bearish = CV1

if Bearish then
V = 1
else
V = 0
endif

if V = 1 then
drawcandle(MM1,MM2,MM1,MM2)coloured(100,100,100,50)
R = 100
G = 100
B = 100
T = 250
k = -1
endif

//============================== No Trend

if A = 0 and V = 0 then
drawcandle(MM2,MM1,MM2,MM1)coloured(158,158,158,50)
R = 158
G = 158
B = 158
T = 90
endif

//============================== Bande Bolliger

return MM0 coloured(R,G,B,T) style (line,2) as "Middle", MM1 coloured(R,G,B,T) style (line,2) as "MM1", MM2 coloured(R,G,B,T) style (line,2) as "MM2", MM3 coloured(R,G,B,T) style (line,2) as "MM3", MM4 coloured(R,G,B,T) style (line,2) as "MM4", k as "k"
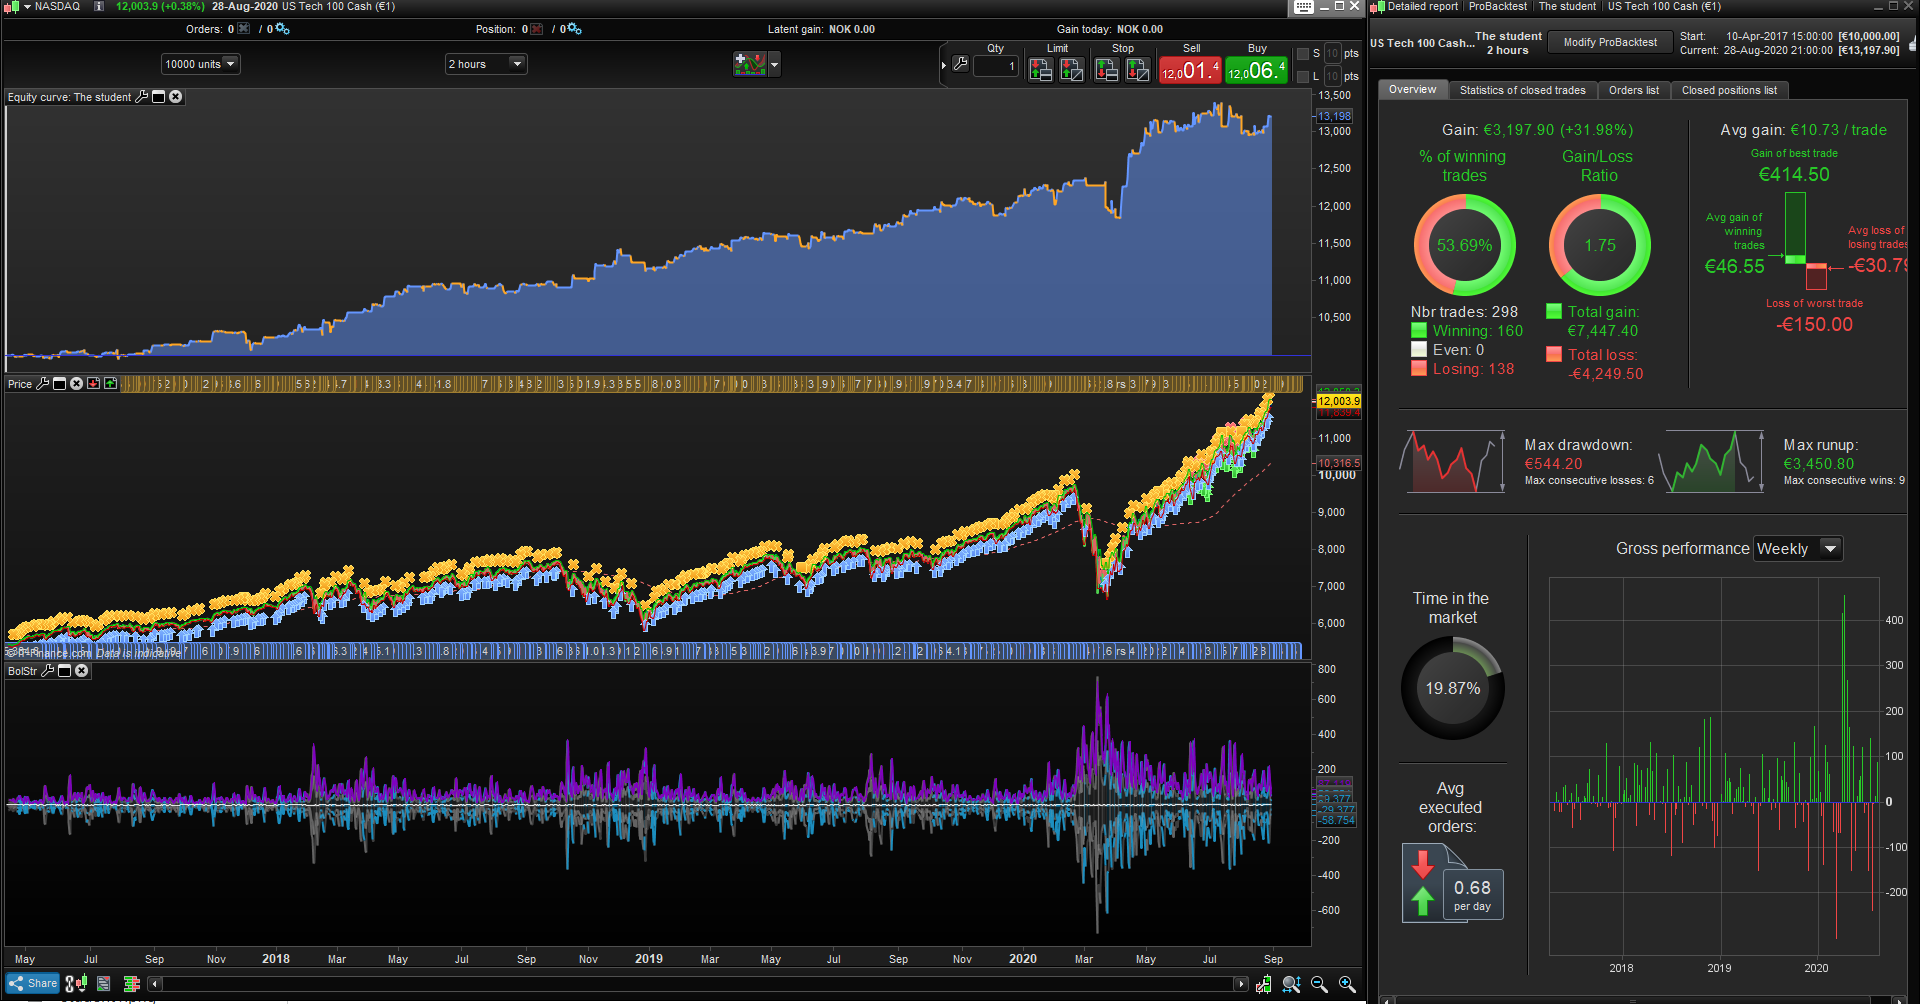
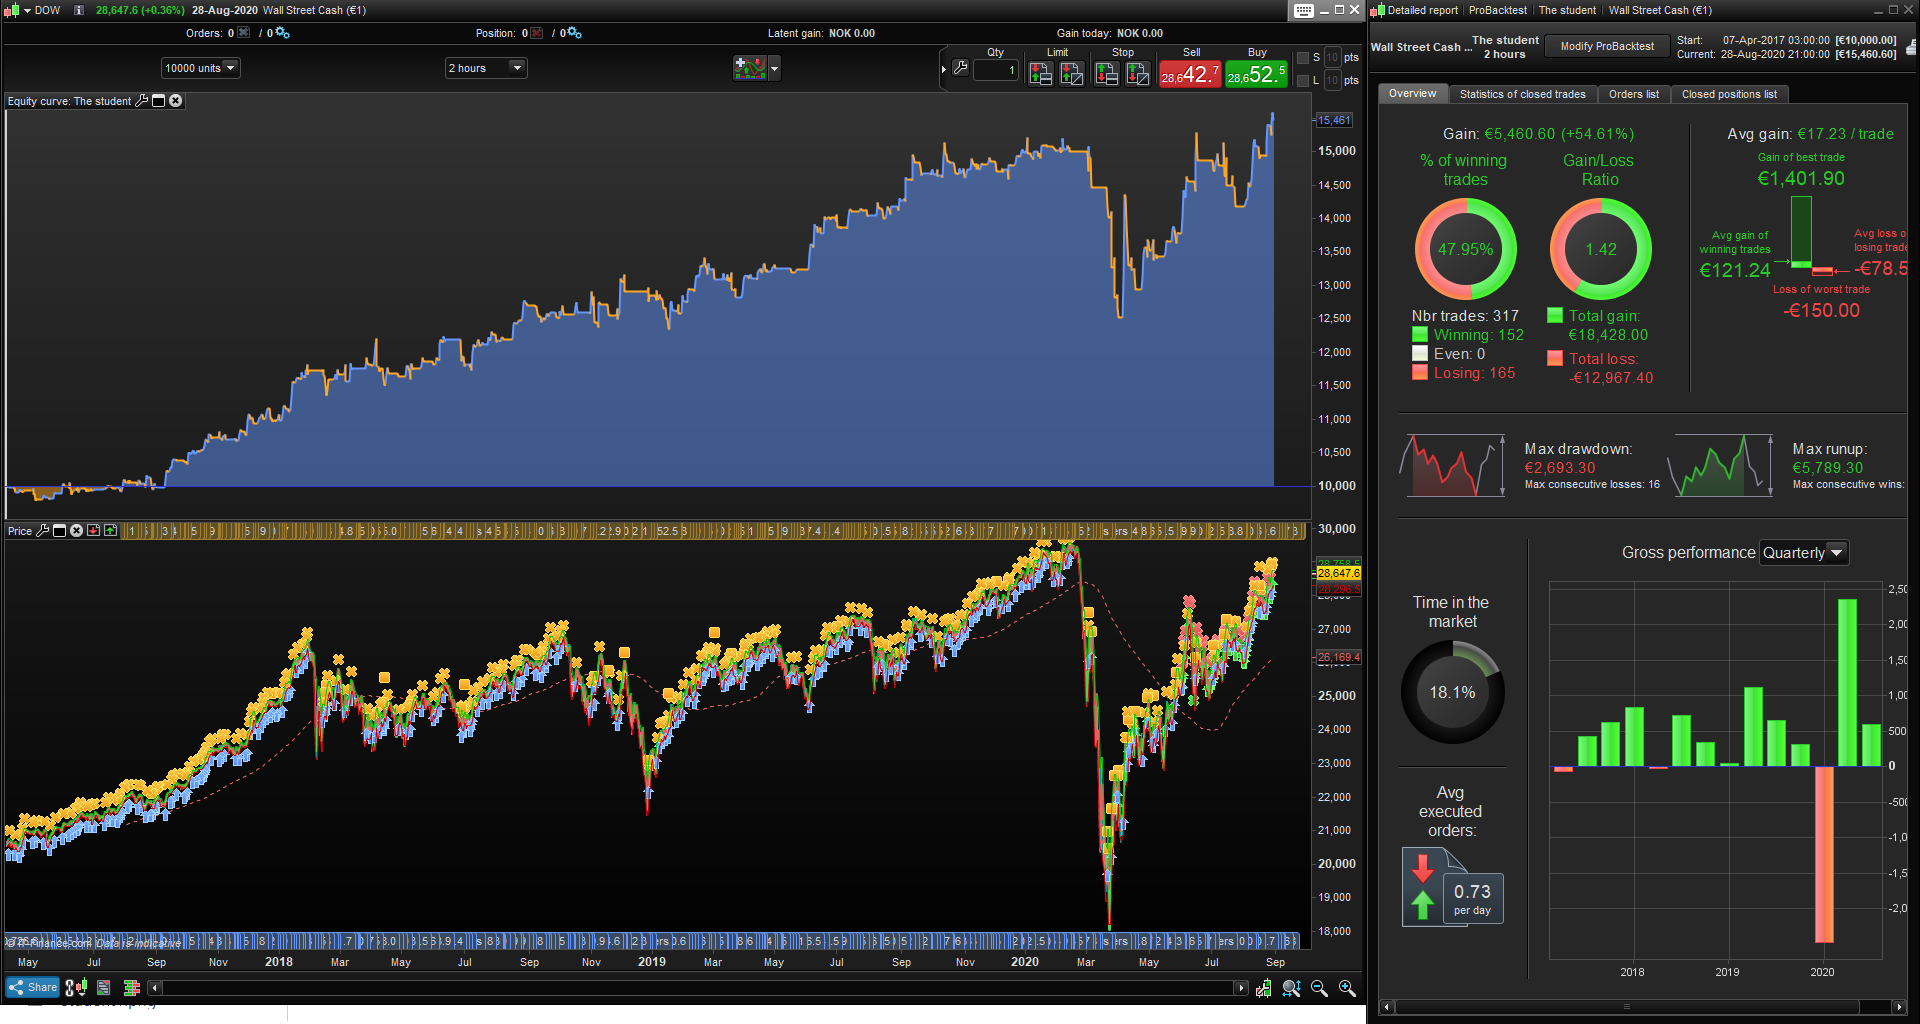
heres the code for the strategy, no optimizing done, it looks very nice in different markets on higher timeframes.
I just saw this tonight and seeing how its a community shared indicator i thought id share my findings using the bollinger bands.
Obviously if you check more candles its not nearly as good, but its still in the profitable area and i think that with some more work, (maybe better entries, more filters/conditions + maybe a better exit, some money management, maybe some time limitations etc..) things could be looking good for this 🙂
// Definition of code parameters
// Made by JEBUS89, PRC forum, indicator by IV Mcm
DEFPARAM CumulateOrders = False // Cumulating positions deactivated

// Conditions to enter long positions
ignored, ignored, ignored, indicator1, ignored, ignored = CALL BolStr(close)
ignored, ignored, ignored, userindic1, ignored, ignored = CALL BolStr(close)
indicator2 = Average[10](userindic1)+std[10](userindic1)
c1 = (indicator1 > indicator2)
ignored, ignored, ignored, ignored, ignored, indicator3 = CALL BolStr(close)
c2 = (indicator3 = 1)

IF c1 AND c2 THEN
BUY 1 CONTRACT AT MARKET
ENDIF

// Conditions to exit long positions
ignored, ignored, ignored, indicator4, ignored, ignored = CALL BolStr(close)
ignored, ignored, ignored, userindic2, ignored, ignored = CALL BolStr(close)
indicator5 = Average[10](userindic2)+std[10](userindic2)
c3 = (indicator4 CROSSES UNDER indicator5)

IF c3 THEN
SELL AT MARKET
ENDIF

// Stops and targets
SET STOP pLOSS 150