Paul
PaulParticipant
Master
Hi,
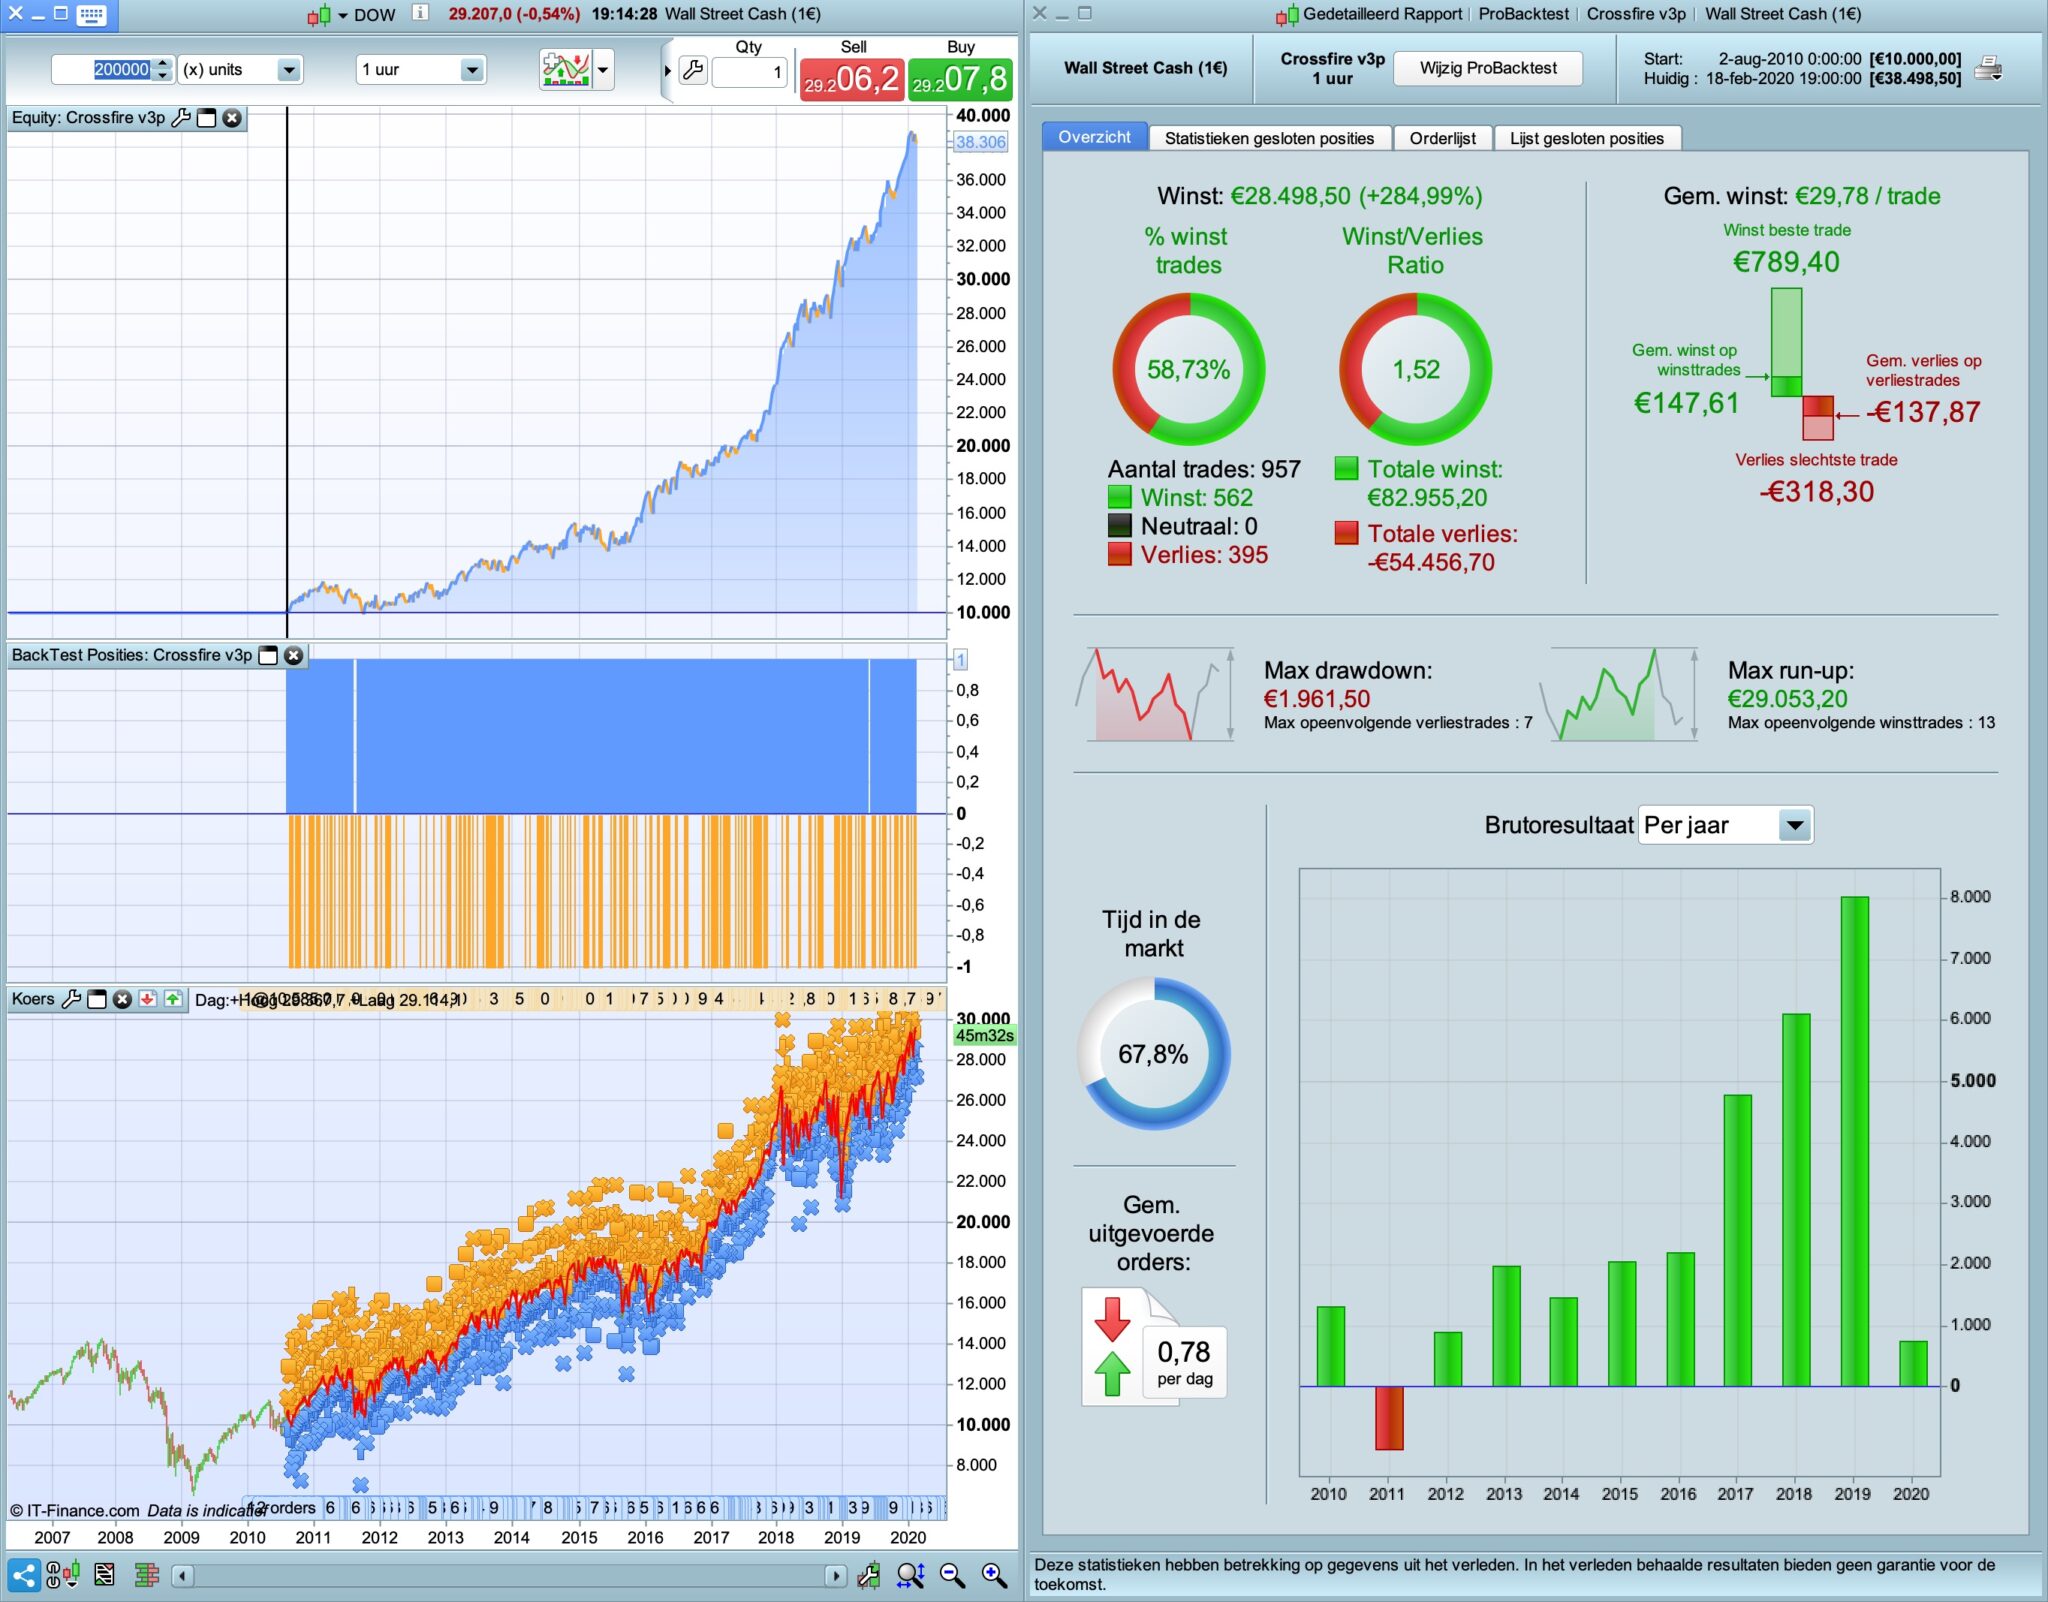
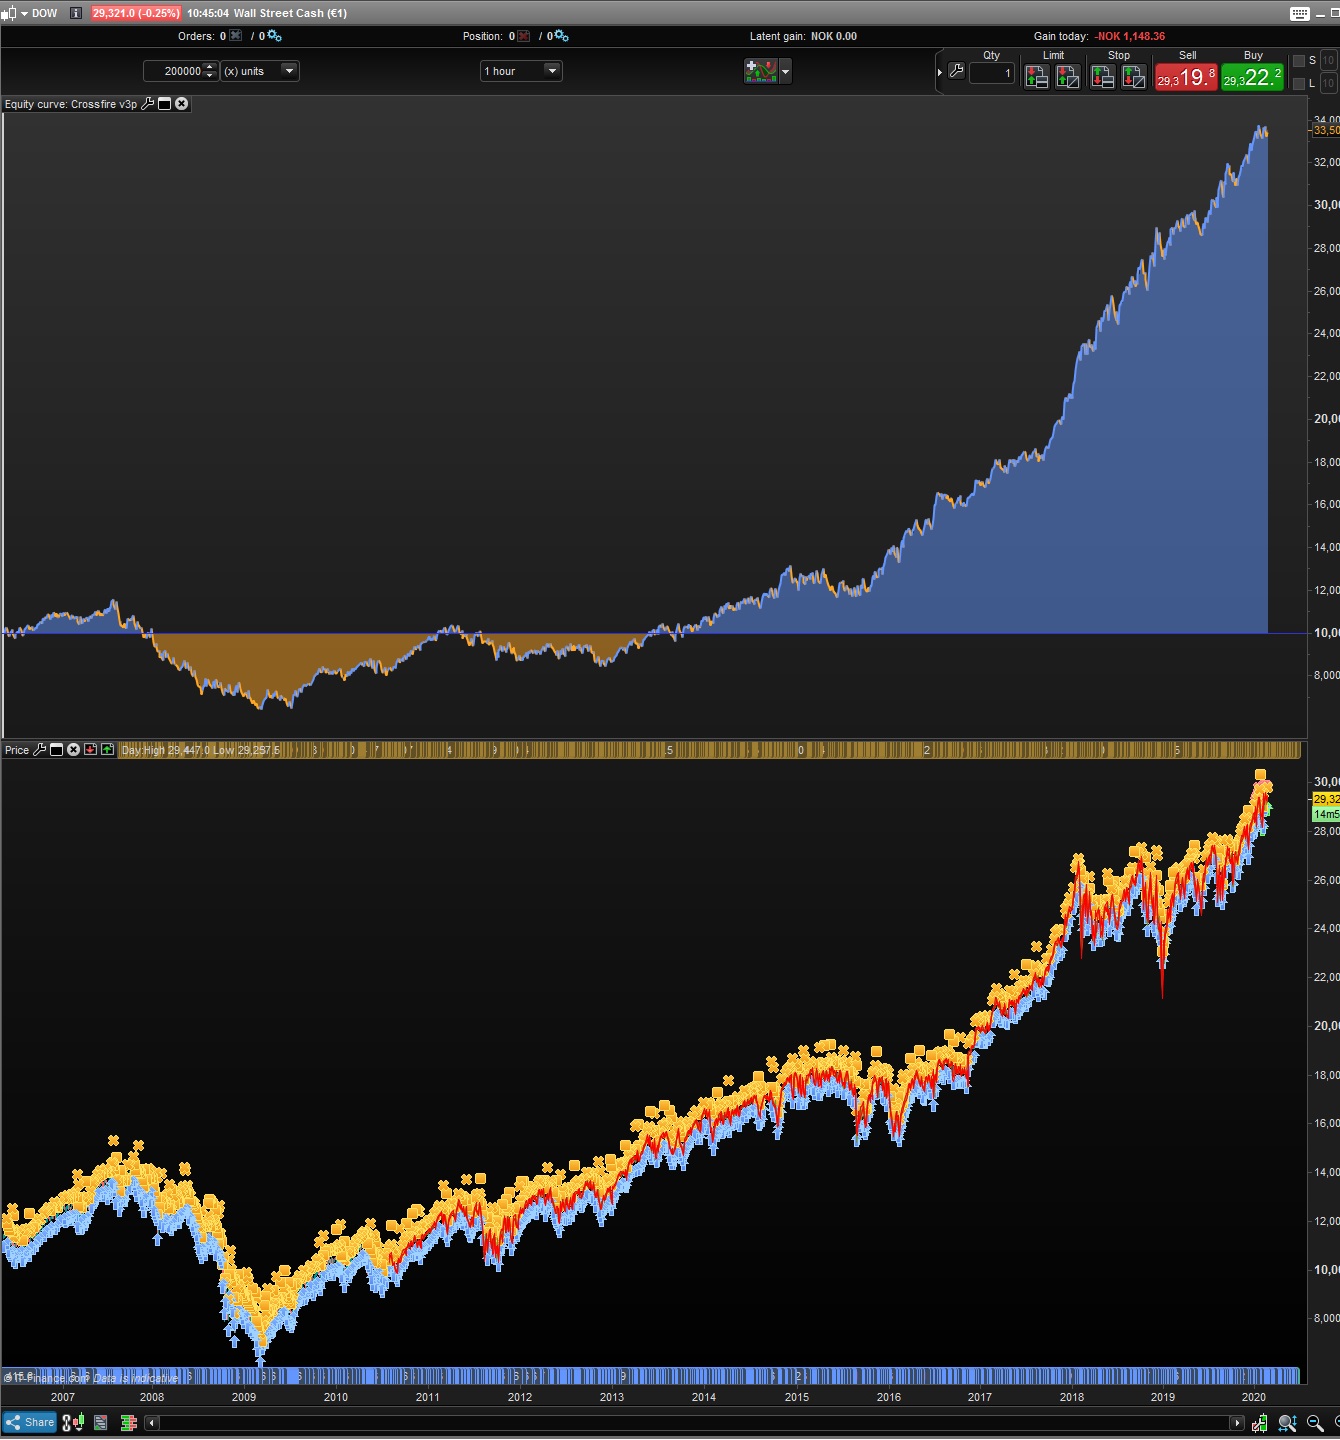
I’ve been trying out combinations of donchian- and bollingerbands and found this interesting combination.
dow, 1 hour, spread 3,1, market orders, stoploss 1% & trailing stop.
4 parameters, each period optimised in range from 5 to 25 with interval of 5.
if trading long only, optional it can be closed op opposite signal. Same for short.
can trade long/short only or both
For robustness check, it’s possible to close & re-entry in same direction.
the question is, can it be improved?
Interesting strategy, thanks for sharing that.
As Donchian and Bollinger are both just channel indicators I wouldn’t have thought there was much significant relationship between them, but what you’ve produced is a sort of double confirmation of any breakout/breakdown, very effective.
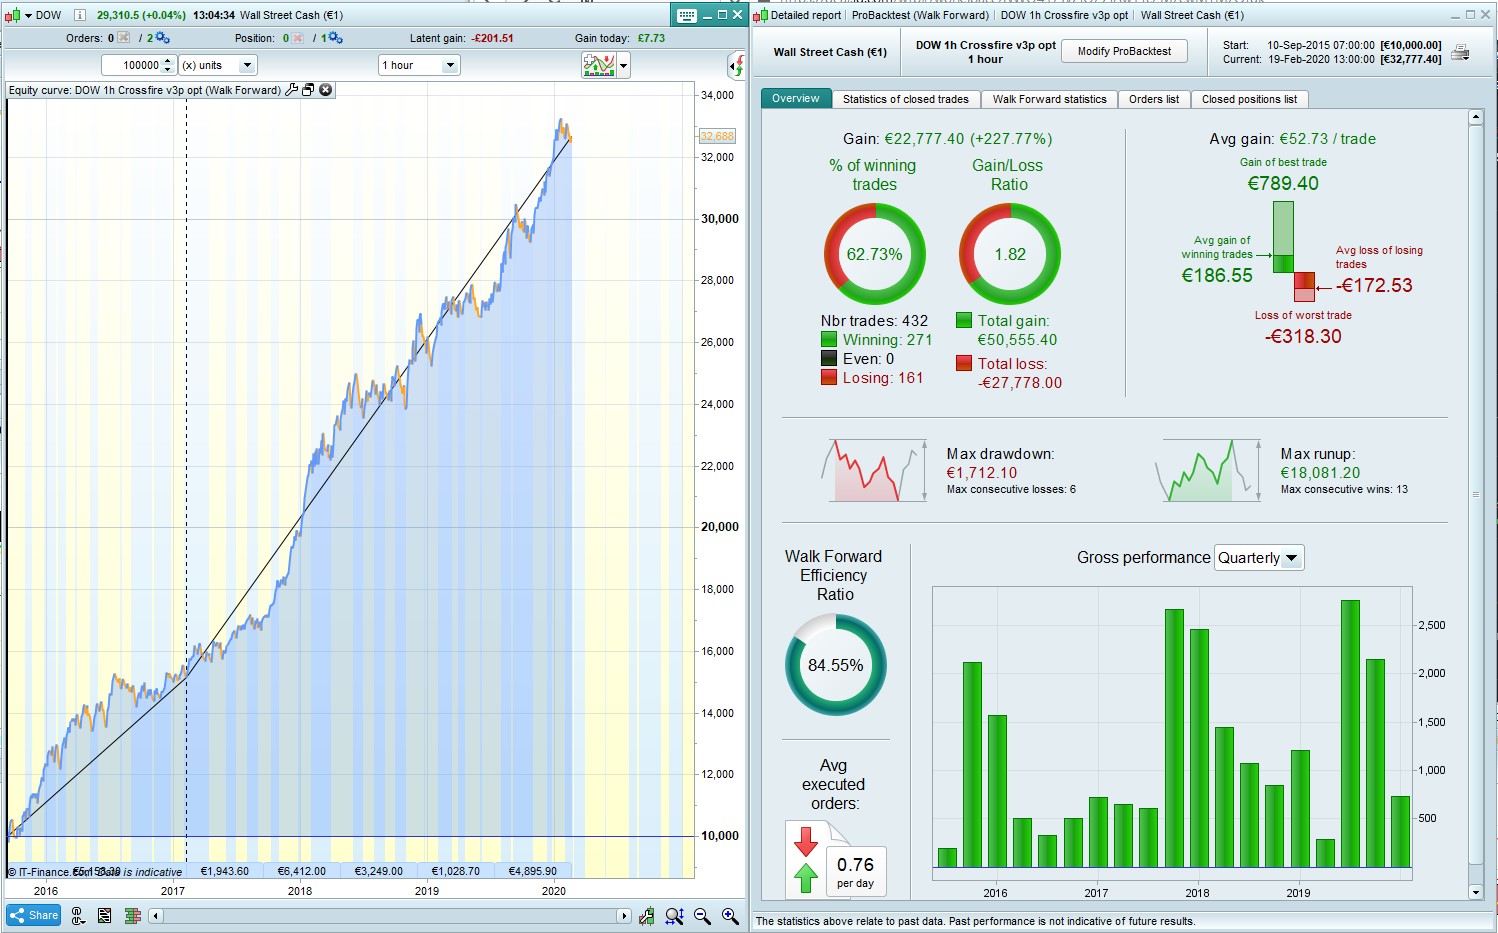
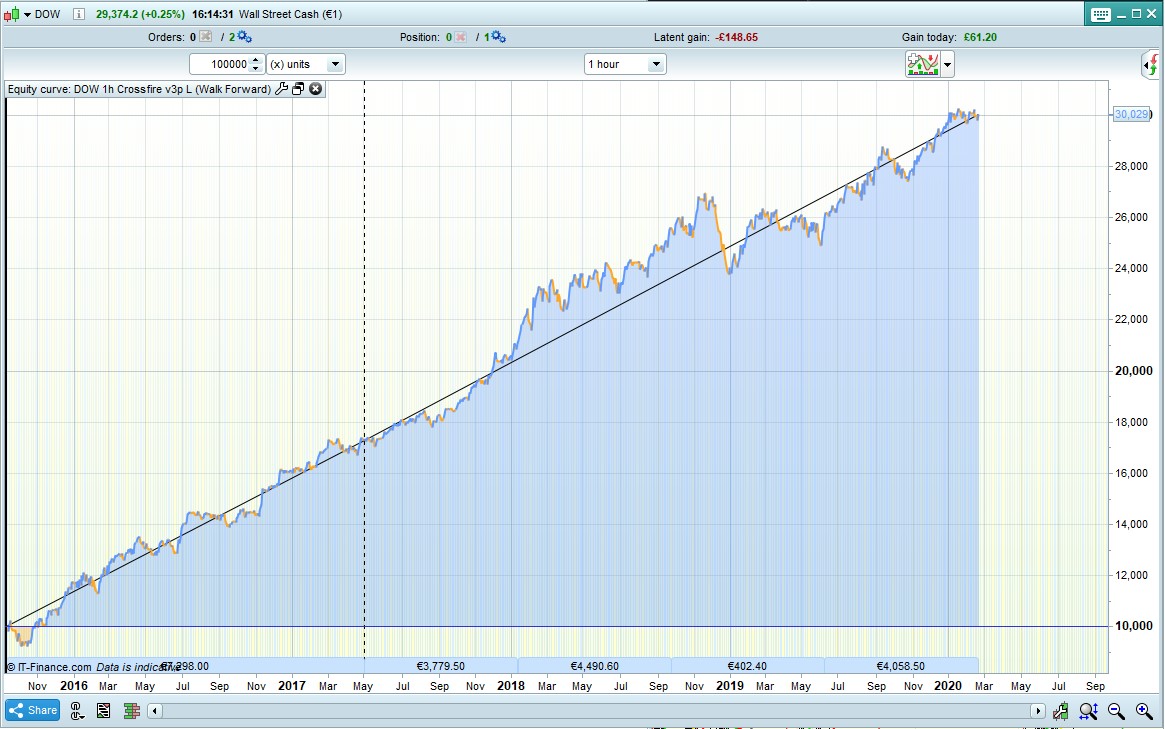
Attached is a 100k 70-30 WF varying the settings 2 period values and stoploss. In every WF sector it chose the lowest possible values for each period: 2, 7, 2, 5 every time. I actually ran it twice and it did the same thing both times. First run returned 6, 11, 3, 15 so I lowered the range. Strange, no? Did you optimize over the full 200k?
Ignore my last post – I had the variables under settings=2 but settings=1 selected – doh! No wonder the weird result. This is better.
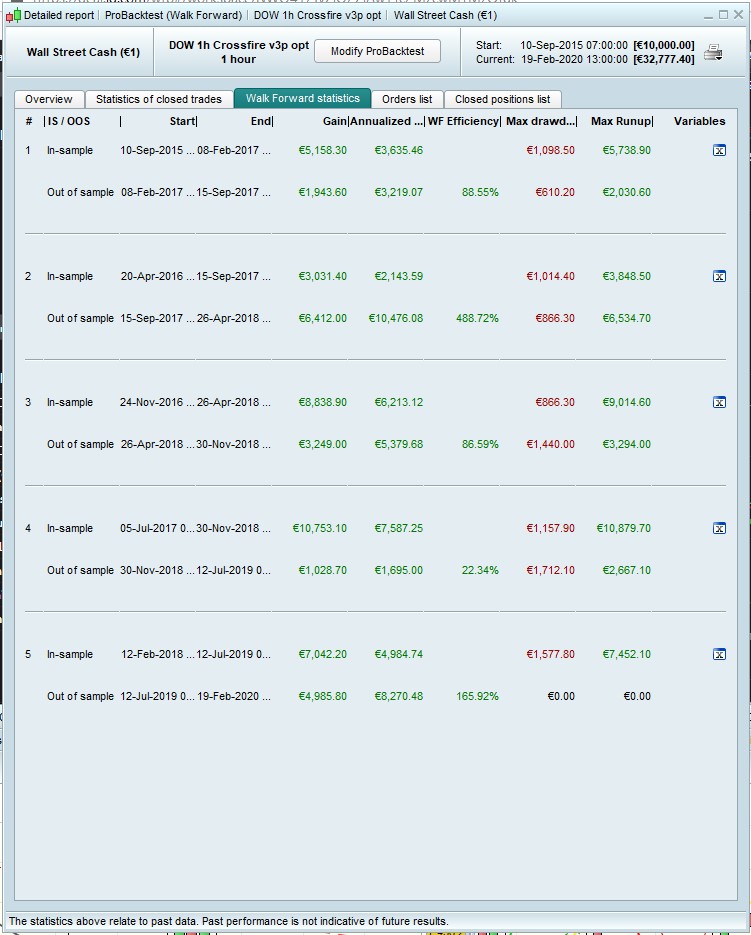
Values for the 4 WF periods were:
8,17,5,25
6,15,5,35
6,11,5,35
12,11,5,25
PaulParticipant
Master
@nonetheless Thanks for picking this up. Nice description of the strategy btw!
It’s indeed optimised for 200k bars. Never ran WF myself so it’s interesting to see those results. Even with re-entry on the strategy doesn’t break down, looking at 100k bars a.t.m. Maybe it would be the best to have re-entry activated when optimising/WF?
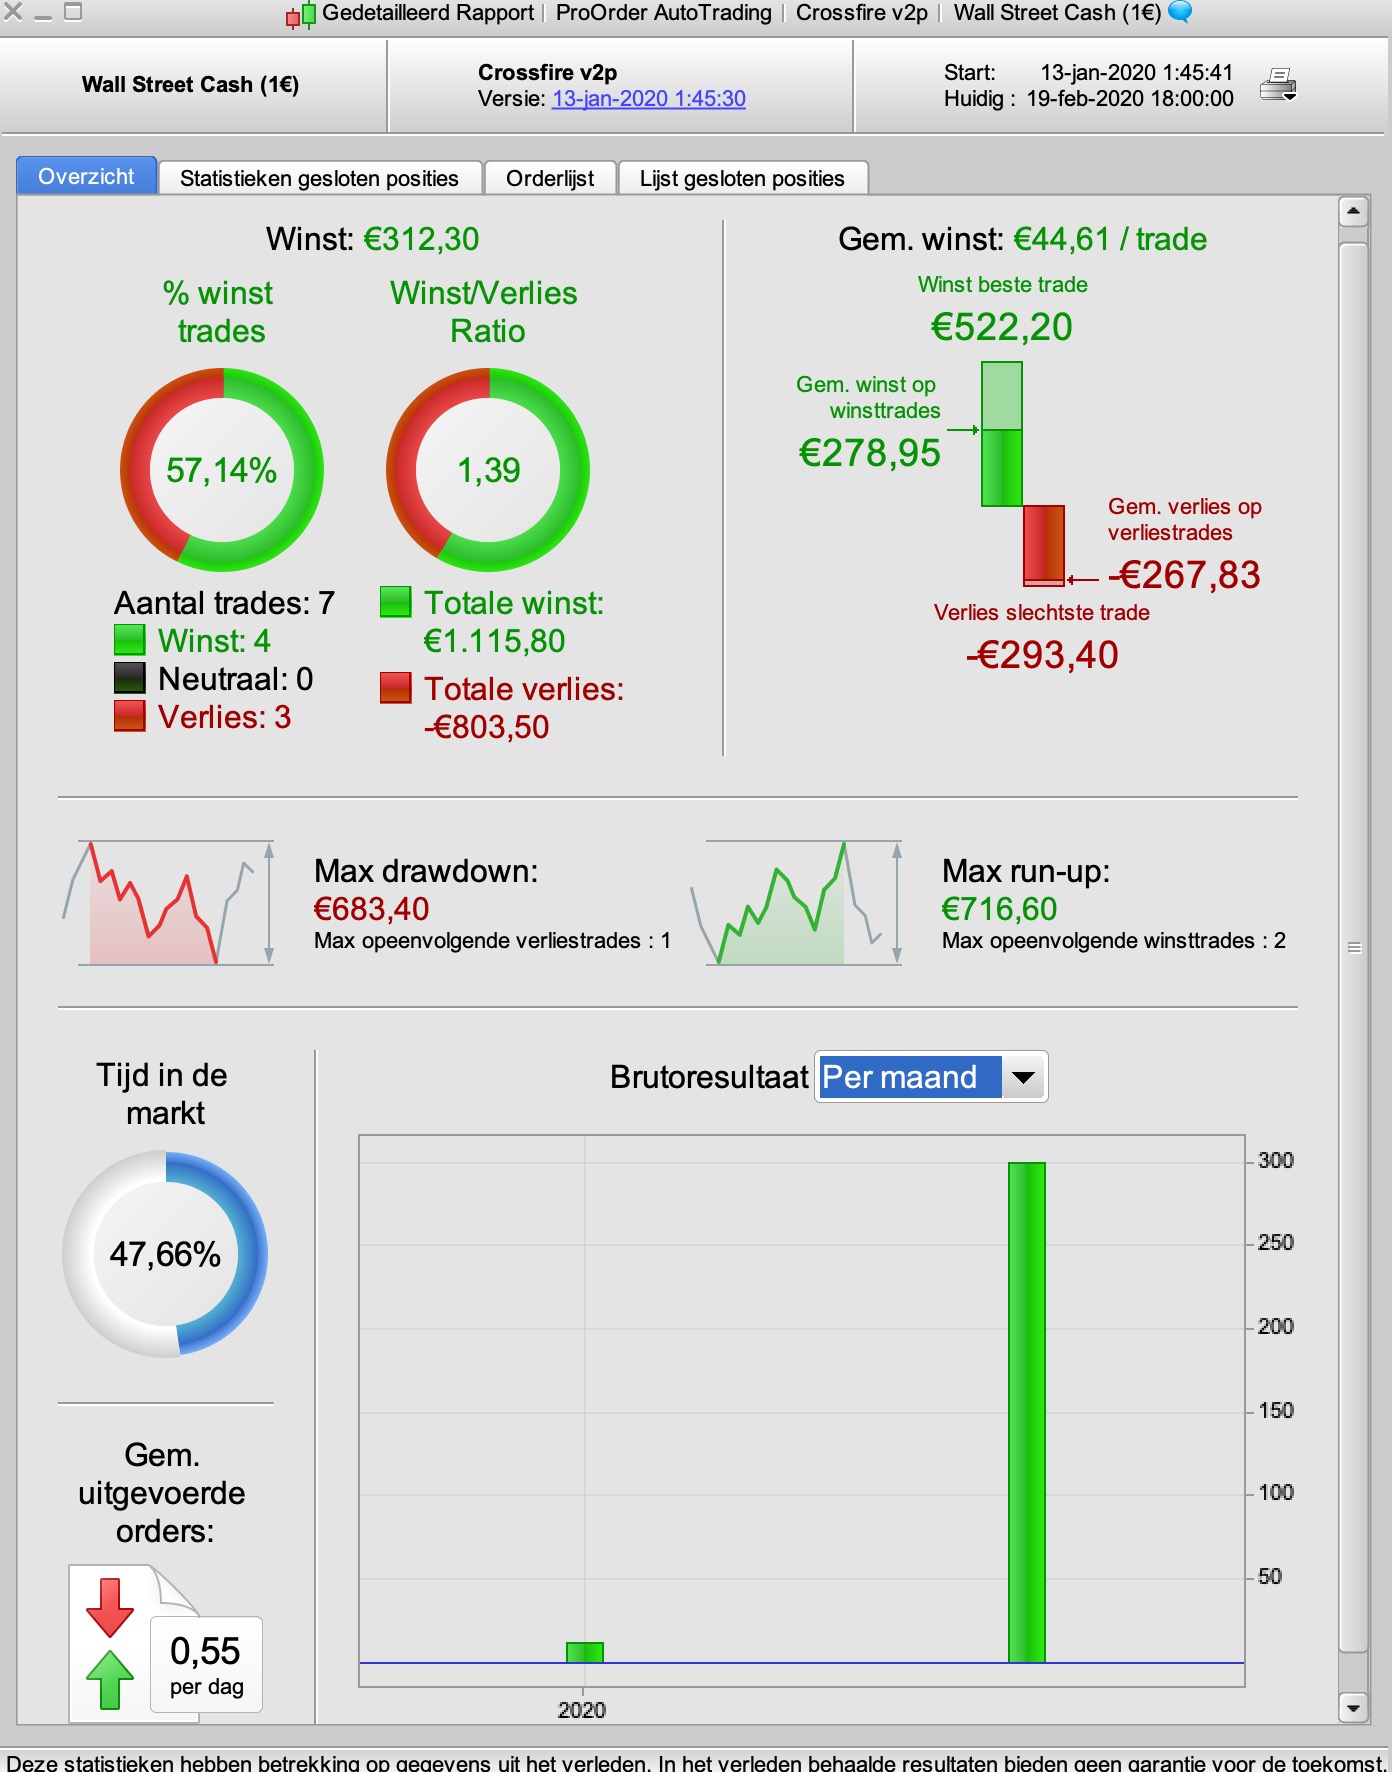
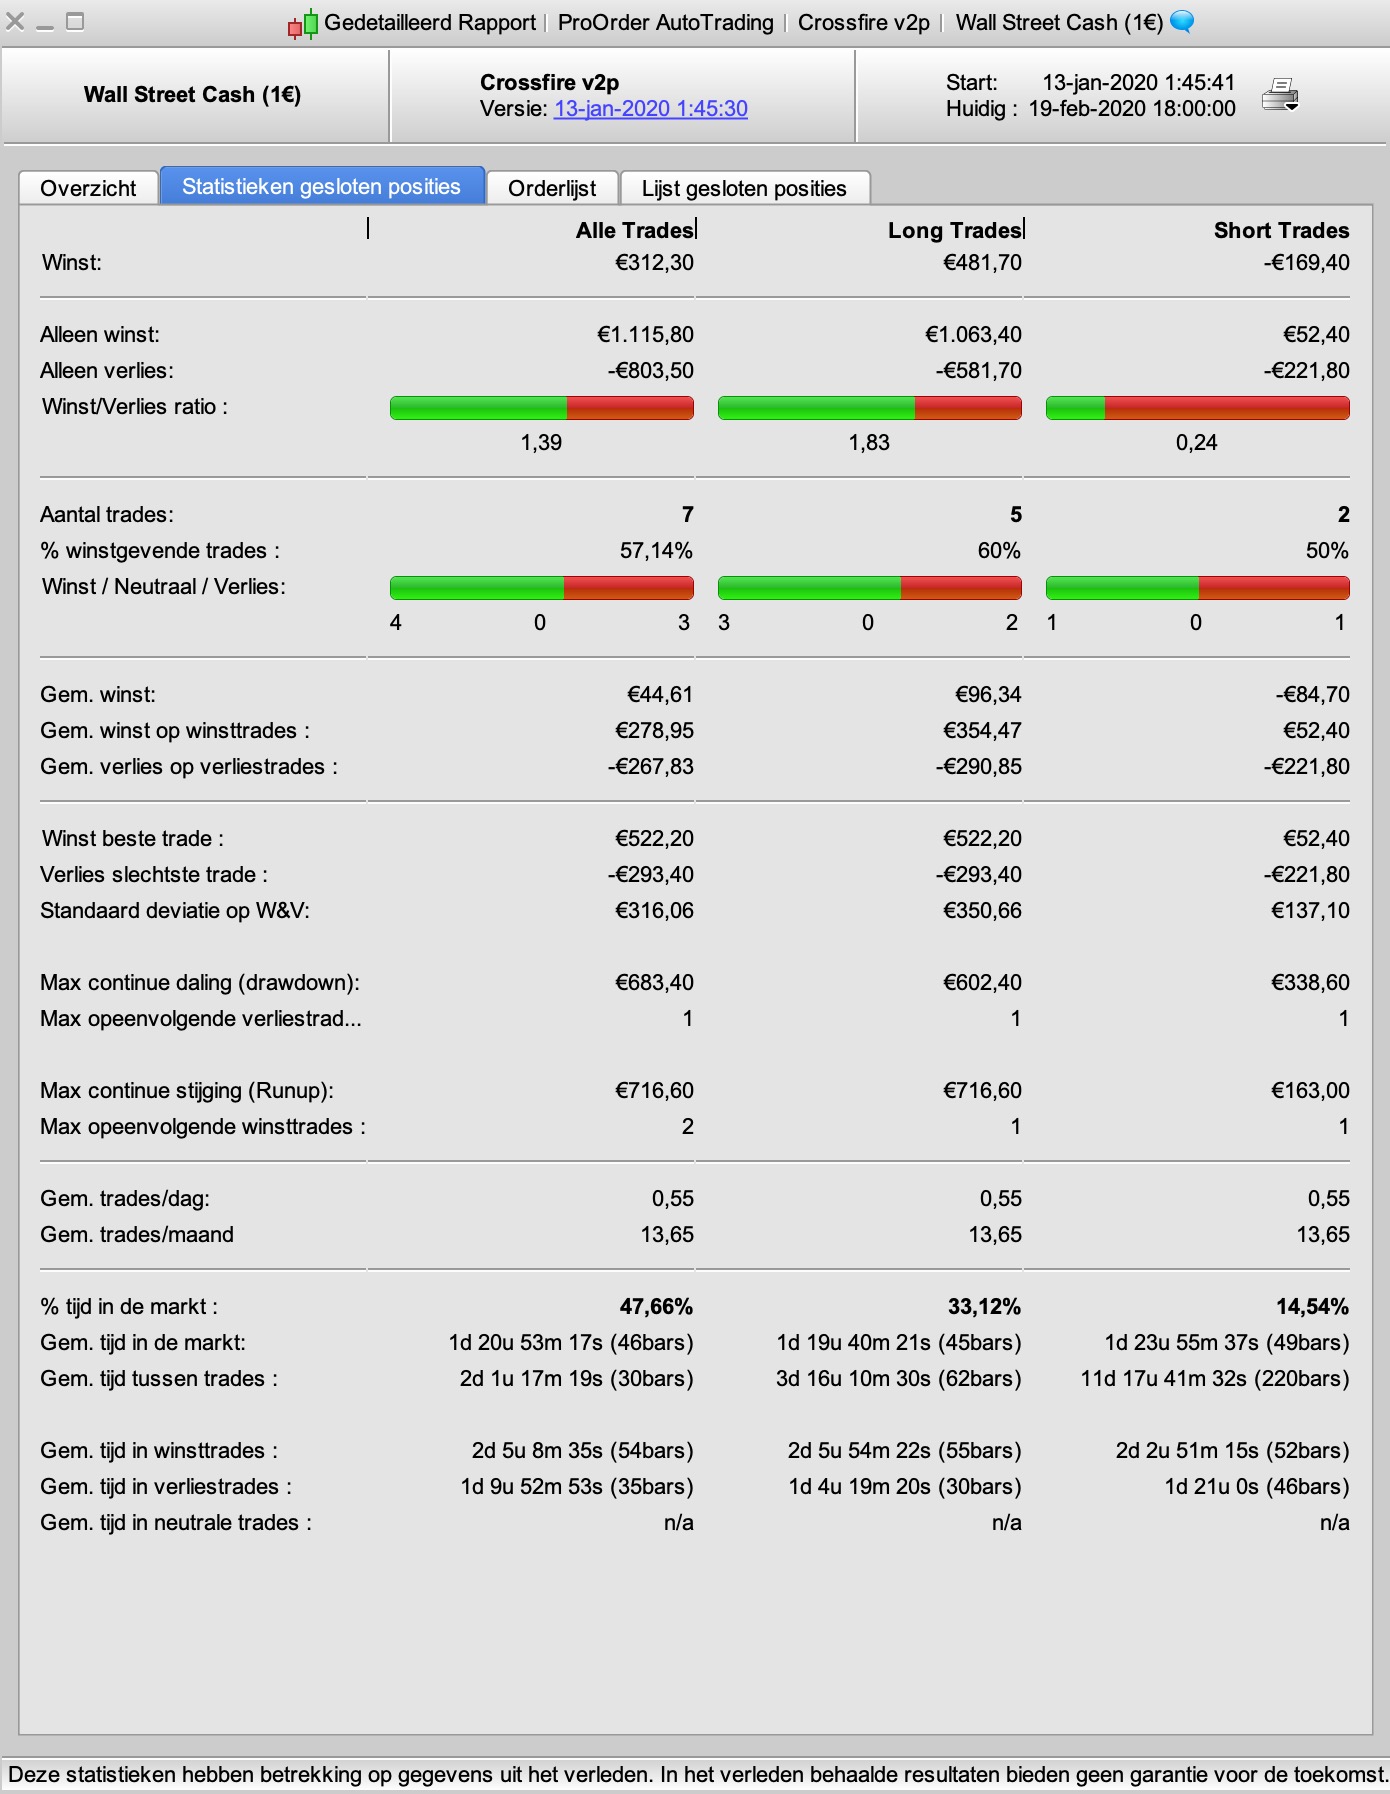
I’ve been running this in demo sinds 13th january, long & short on settings 1. While not fantastic for such short period, it’s positive, even as it missed the first 2 weeks which where good in hindsight.
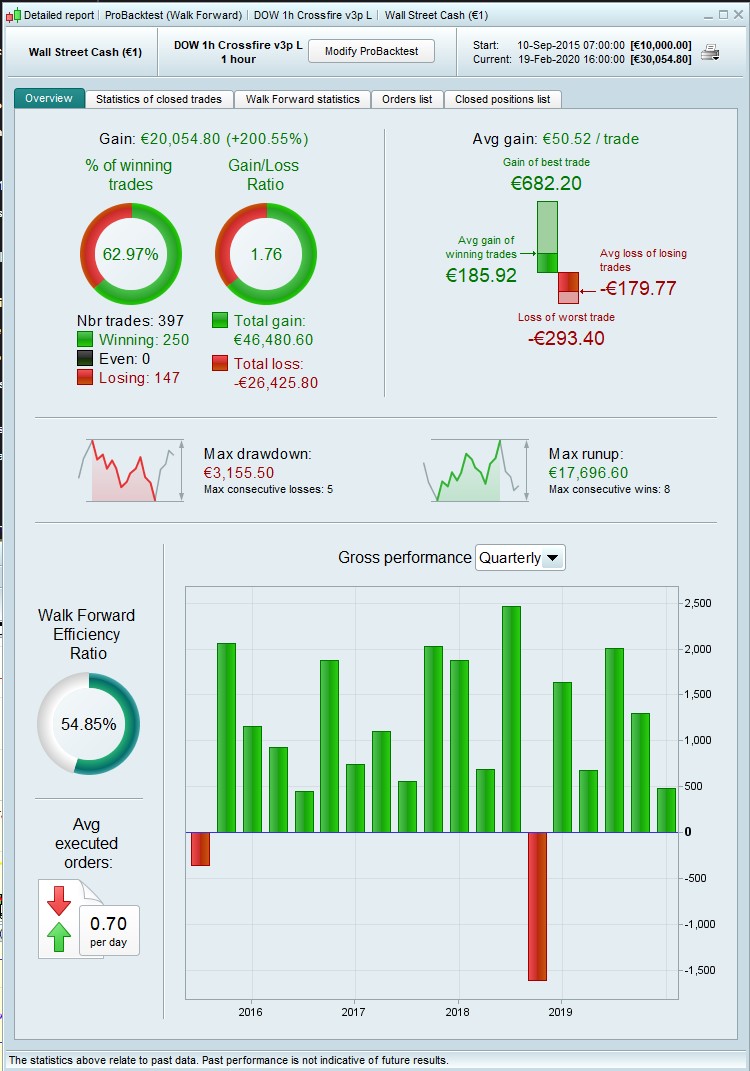
nonetheless – Your image has just highlighted something to me about the way PRT presents the results of its walk forward tests. Your image shows a WF line that is at an almost identical angle to that of the in sample tests and yet the WF efficiency is only 54.85%. I had always assumed that if a OOS test was as good as a IS test then it would be 100% efficiency. If it was twice as good it would be 200% efficiency and if it was half as good it would be 50% efficiency but it appears that I have been thinking incorrectly (not for the first time and I very much expect not for the last time!)
What we really need now is a 200K back test with some decent OOS.
Your image shows a WF line that is at an almost identical angle to that of the in sample tests and yet the WF efficiency is only 54.85%. I had always assumed that if a OOS test was as good as a IS test then it would be 100% efficiency.
Yes, I had noticed that too. I had assumed it was something to do with the fact that the graph shows 70-30 IS/OOS whereas the efficiency is annualized? 30 being 43% of 70, and that was why the desired result is said to be 40-60% ??? This is just how I get around it in my head … not at all sure if it makes sense!
Even with re-entry on the strategy doesn’t break down, looking at 100k bars
should have said, the WF I posted is for long-only, so re-entry doesn’t come into it. Running long and short separately does seem to give better results than the reversing option, so I would probably run it as two strategies. Ingenious the way you separated them out though in the one code!
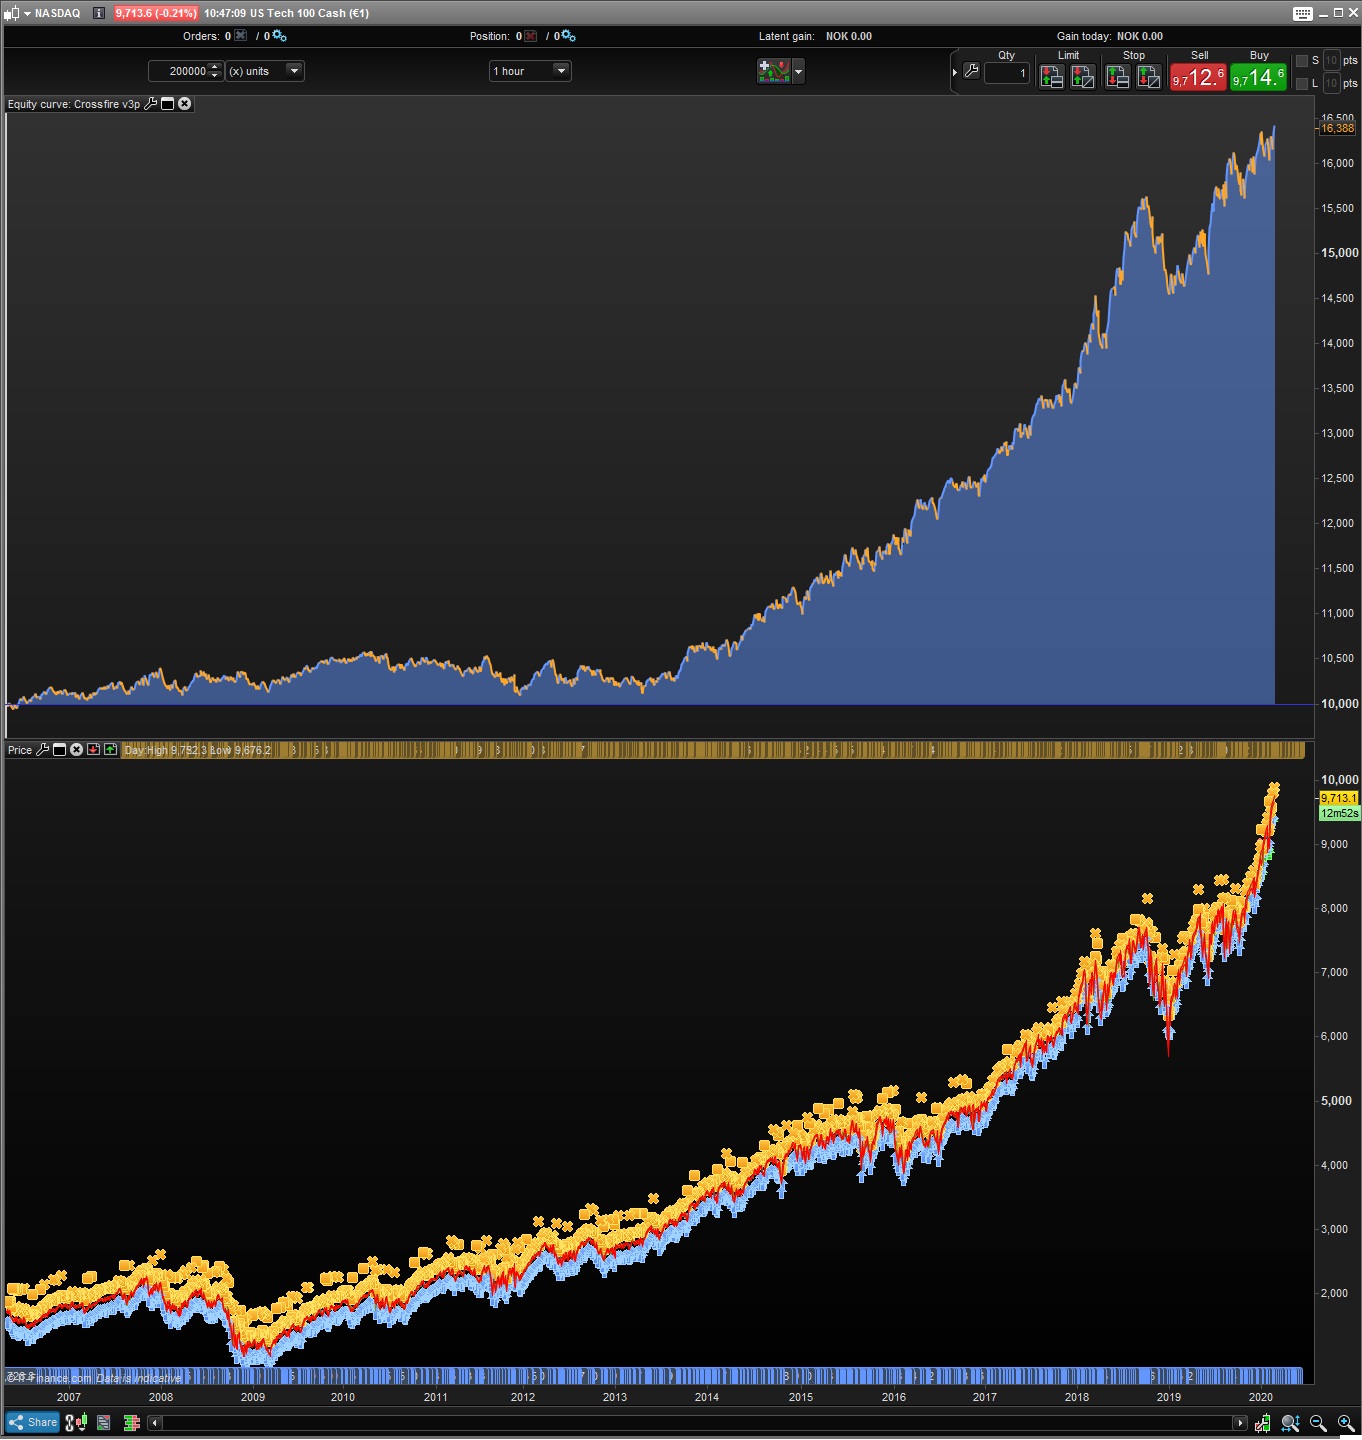
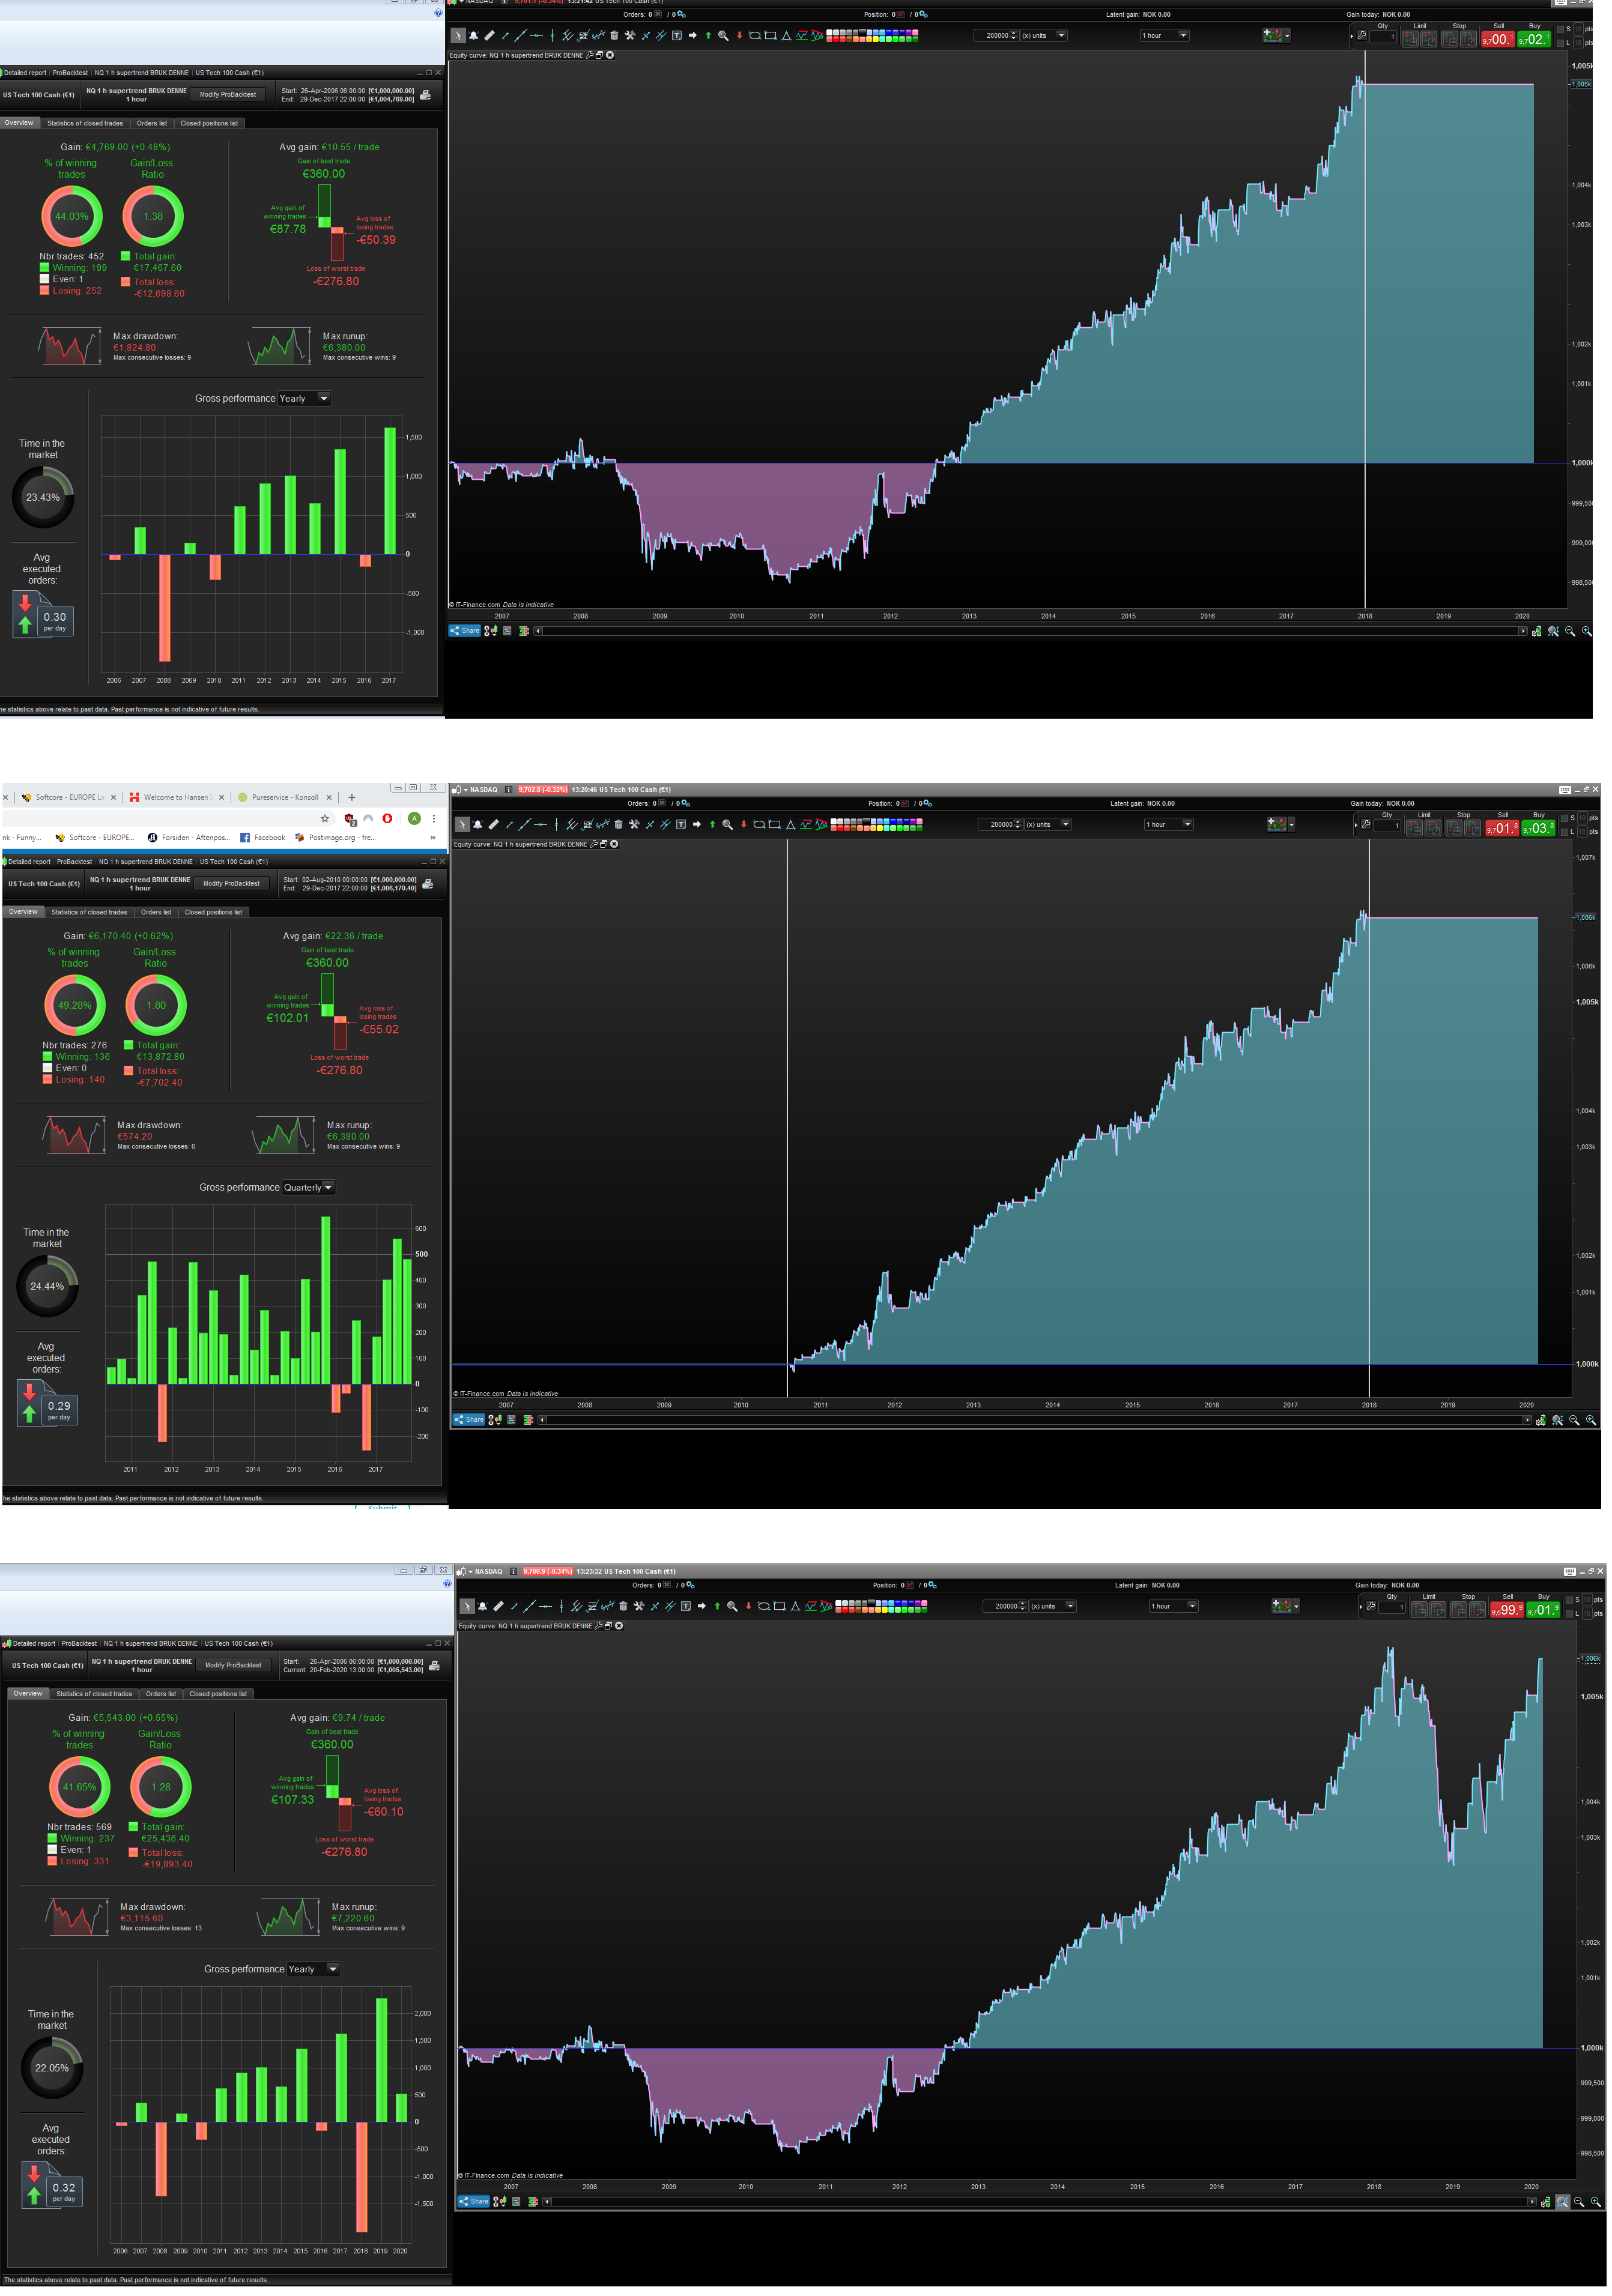
heres a picture of the 200K test.
I dont like how its flat and ugly until it takes off.
but it looks good in NQ from 2013 (see photo – removed spread!). Might just mean its “tuned in” to the past 6-7 years of “market regimes” but as soon as you go outside that, ur fucked it seems like.
Dosnt look good in ftse, spain, france, US 500 ++ which i wouldnt expect to see fantastic results, but these results look bad and account breaking to be honest..
Thanks for that @jebus … but realistically, does any algo ever work for 10 years without some re-tuning?
That would be ideal, obviously, but for my money 4 years of healthy OOS performance looks worth a punt…
Well at least for me, i dont run anything thats not looking OK on the whole backtest.
If you got like 40-60% looking good but rest is shit, thats not valid for me, that screams overoptimization (obviously, i would say!) and the risk of that system breaking is way higher.
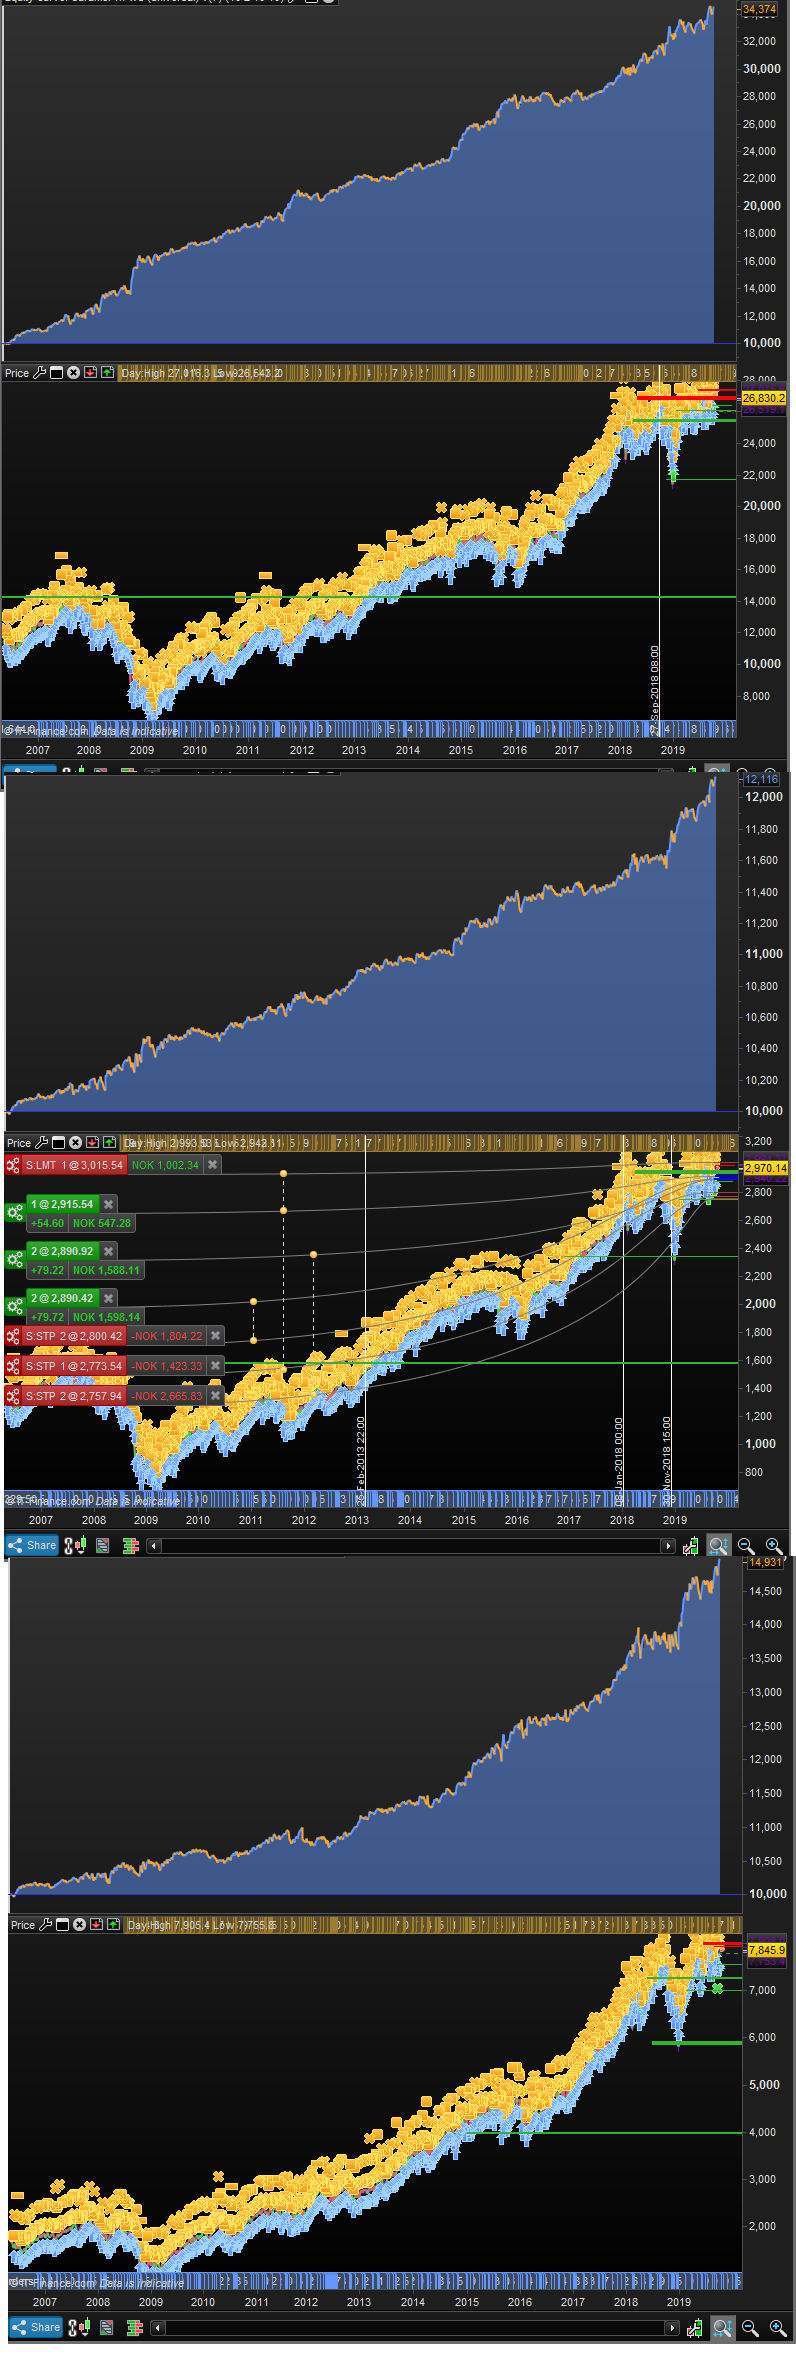
Ive posted several screenshots of my systems (again, just me and my opinions as usual), heres one strategy tested in Wall st, US tech, Us 500
Edit: I really wanna put emphasis on the fact that even though a system has 40% bad and 60% good periods in the backtest, it might continue to work going forward! BUT and theres a big buttt here.. From my own experience, and from what ive read and listened to, The longer “Good backtest” you got, the more chance there is that the system will keep on living and performing.
I guess one could argue that Wings is looking good even tho the first years looks like ****! Take a look (code is last edited (according to code itself) Nov 2016.
If you backtest it from january 2017 -> 2020 today, it has 50% winrate and 1.25 profit factor, avg gain is 11€ (it has a bit more max DD than i would like so i dont run it. Just thought of it as an example of a code i wouldnt trust, but that has performed well OOS!
Edit i remembered my own that looked very similar to this when it comes to :
1. Having a bad few first years
2. Having an amazing middle part
3. Cracking as soon as it went “live” (also markets dropped like **** when it hit “live” so yea..
Look at that crazy drawdown which the system had never seen before.
I didnt run this live because i was sceptical to it because of the first years looking so bad + when looking at a different market (this is NQ 1h) it would look ****ty.
i dont run anything thats not looking OK on the whole backtest.
Probably if I had 200k to work with I’d say exactly the same!
i dont run anything thats not looking OK on the whole backtest.
Probably if I had 200k to work with I’d say exactly the same!
And maybe when i get the 1m bars to work with (PRT 11) ill say the same as u when i realize my algos are shit in the years pre 2007 haha
Btw u know u can get 200K (premium) for free if u just do like 2 trades per month?
@jebus89
Please don’t use bad words! Thanks! 😉
PaulParticipant
Master
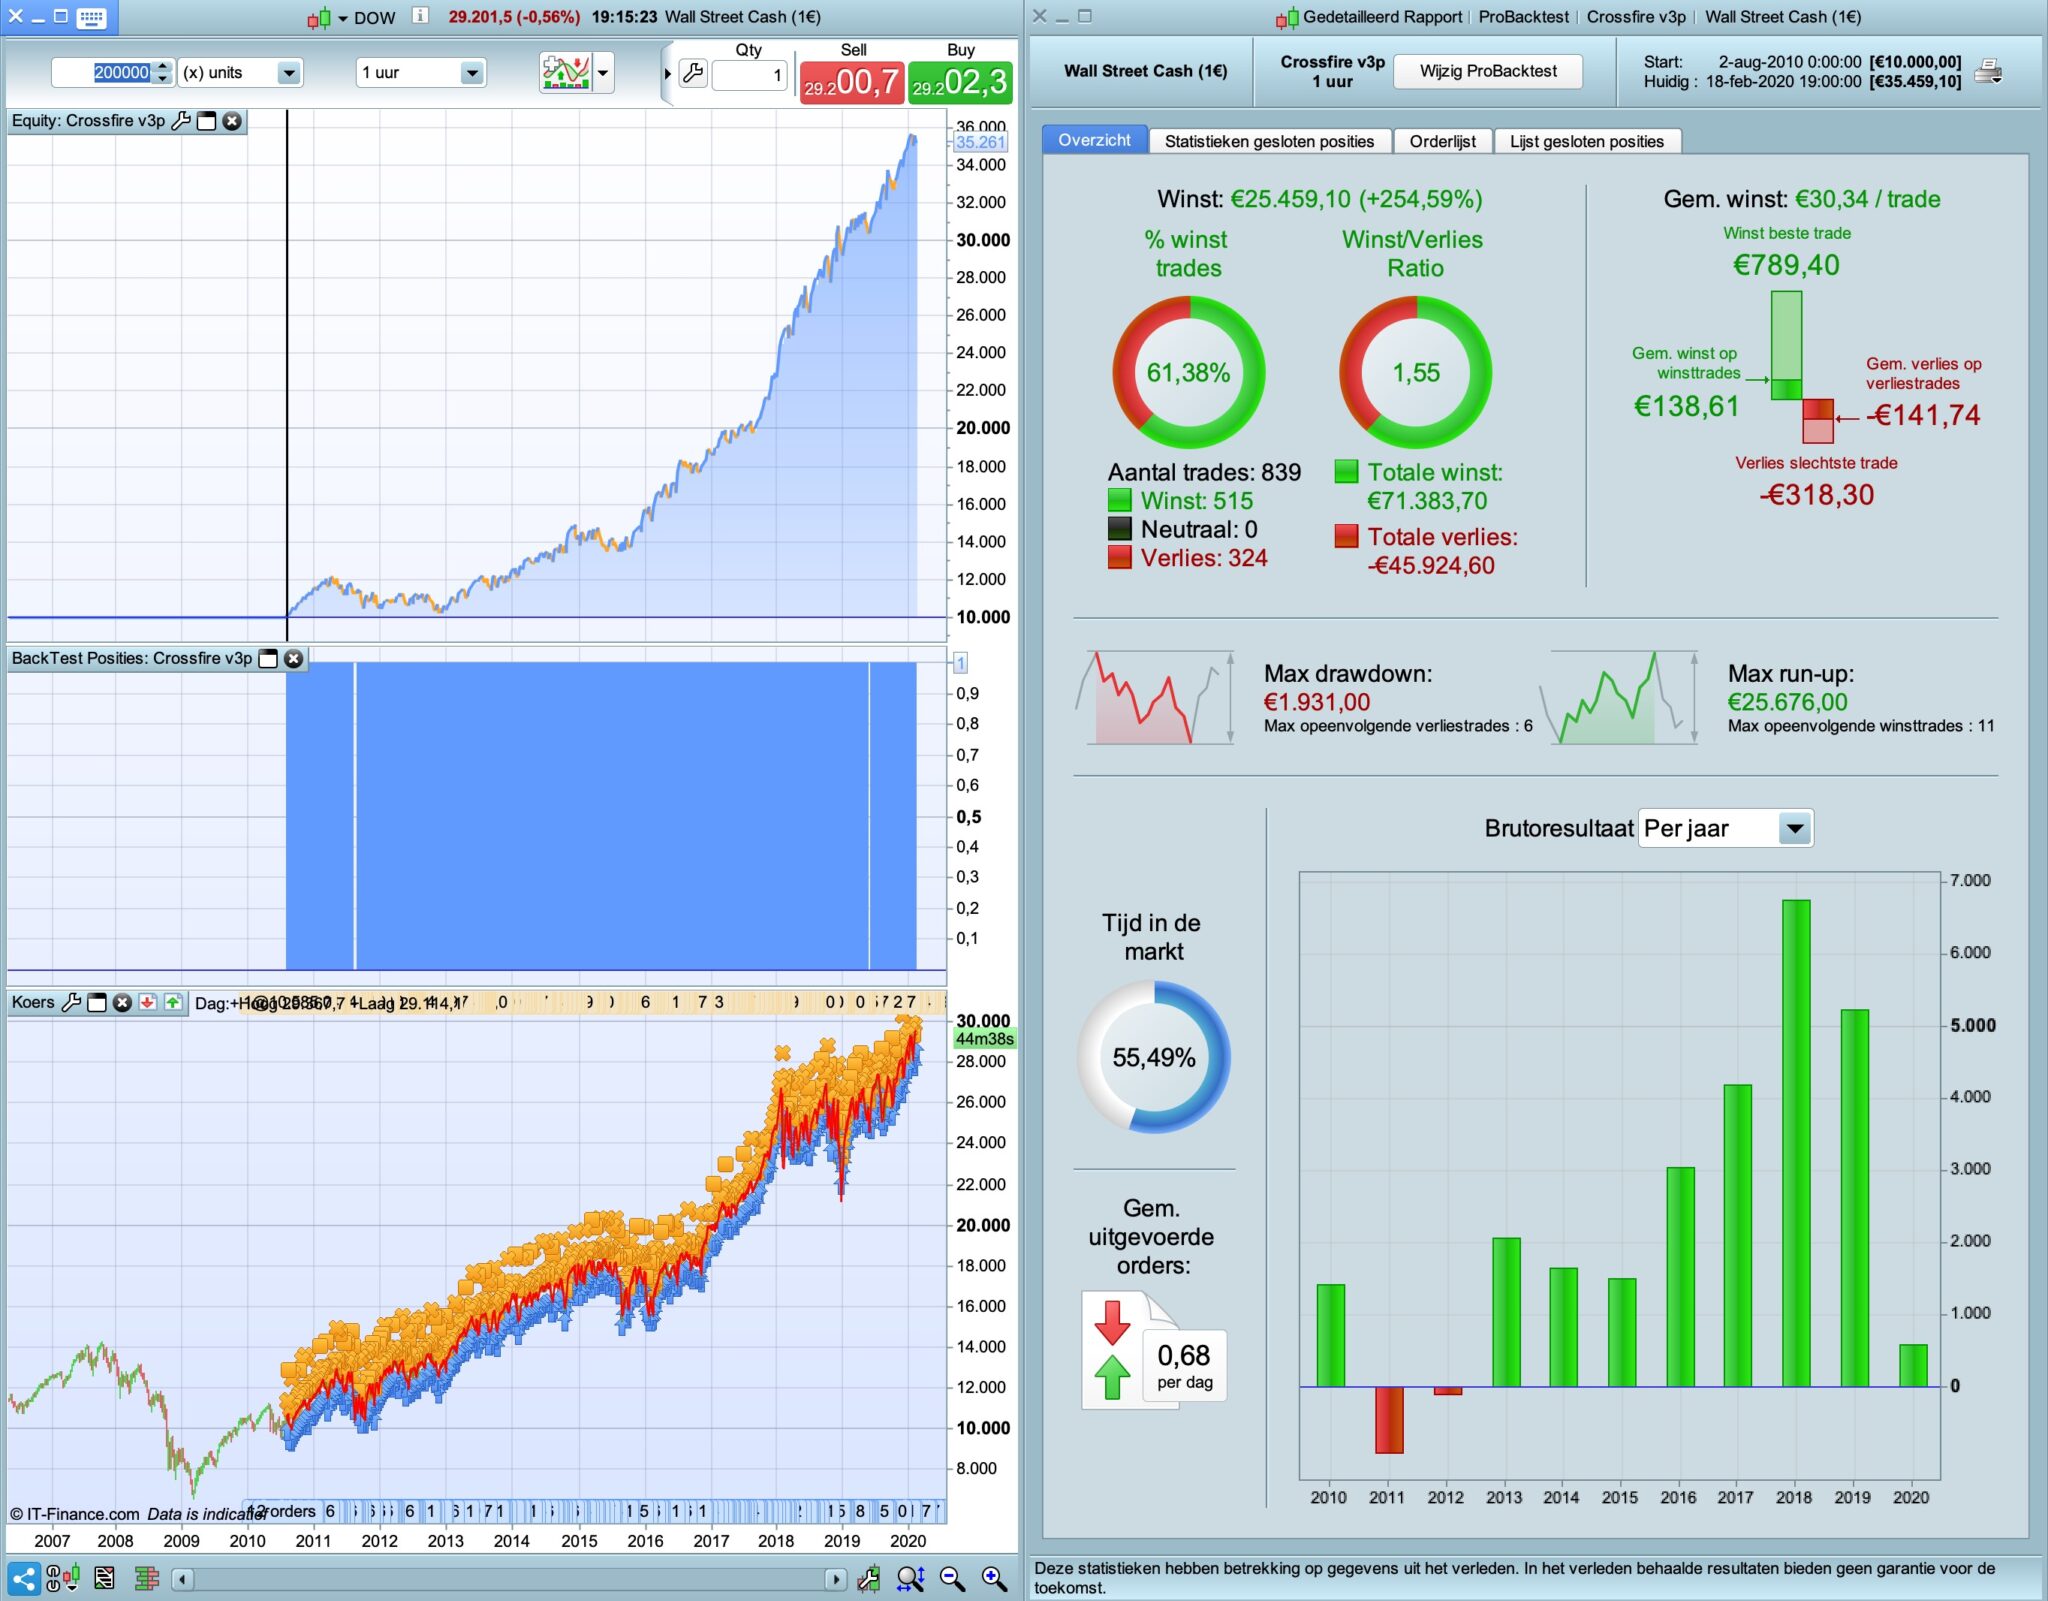
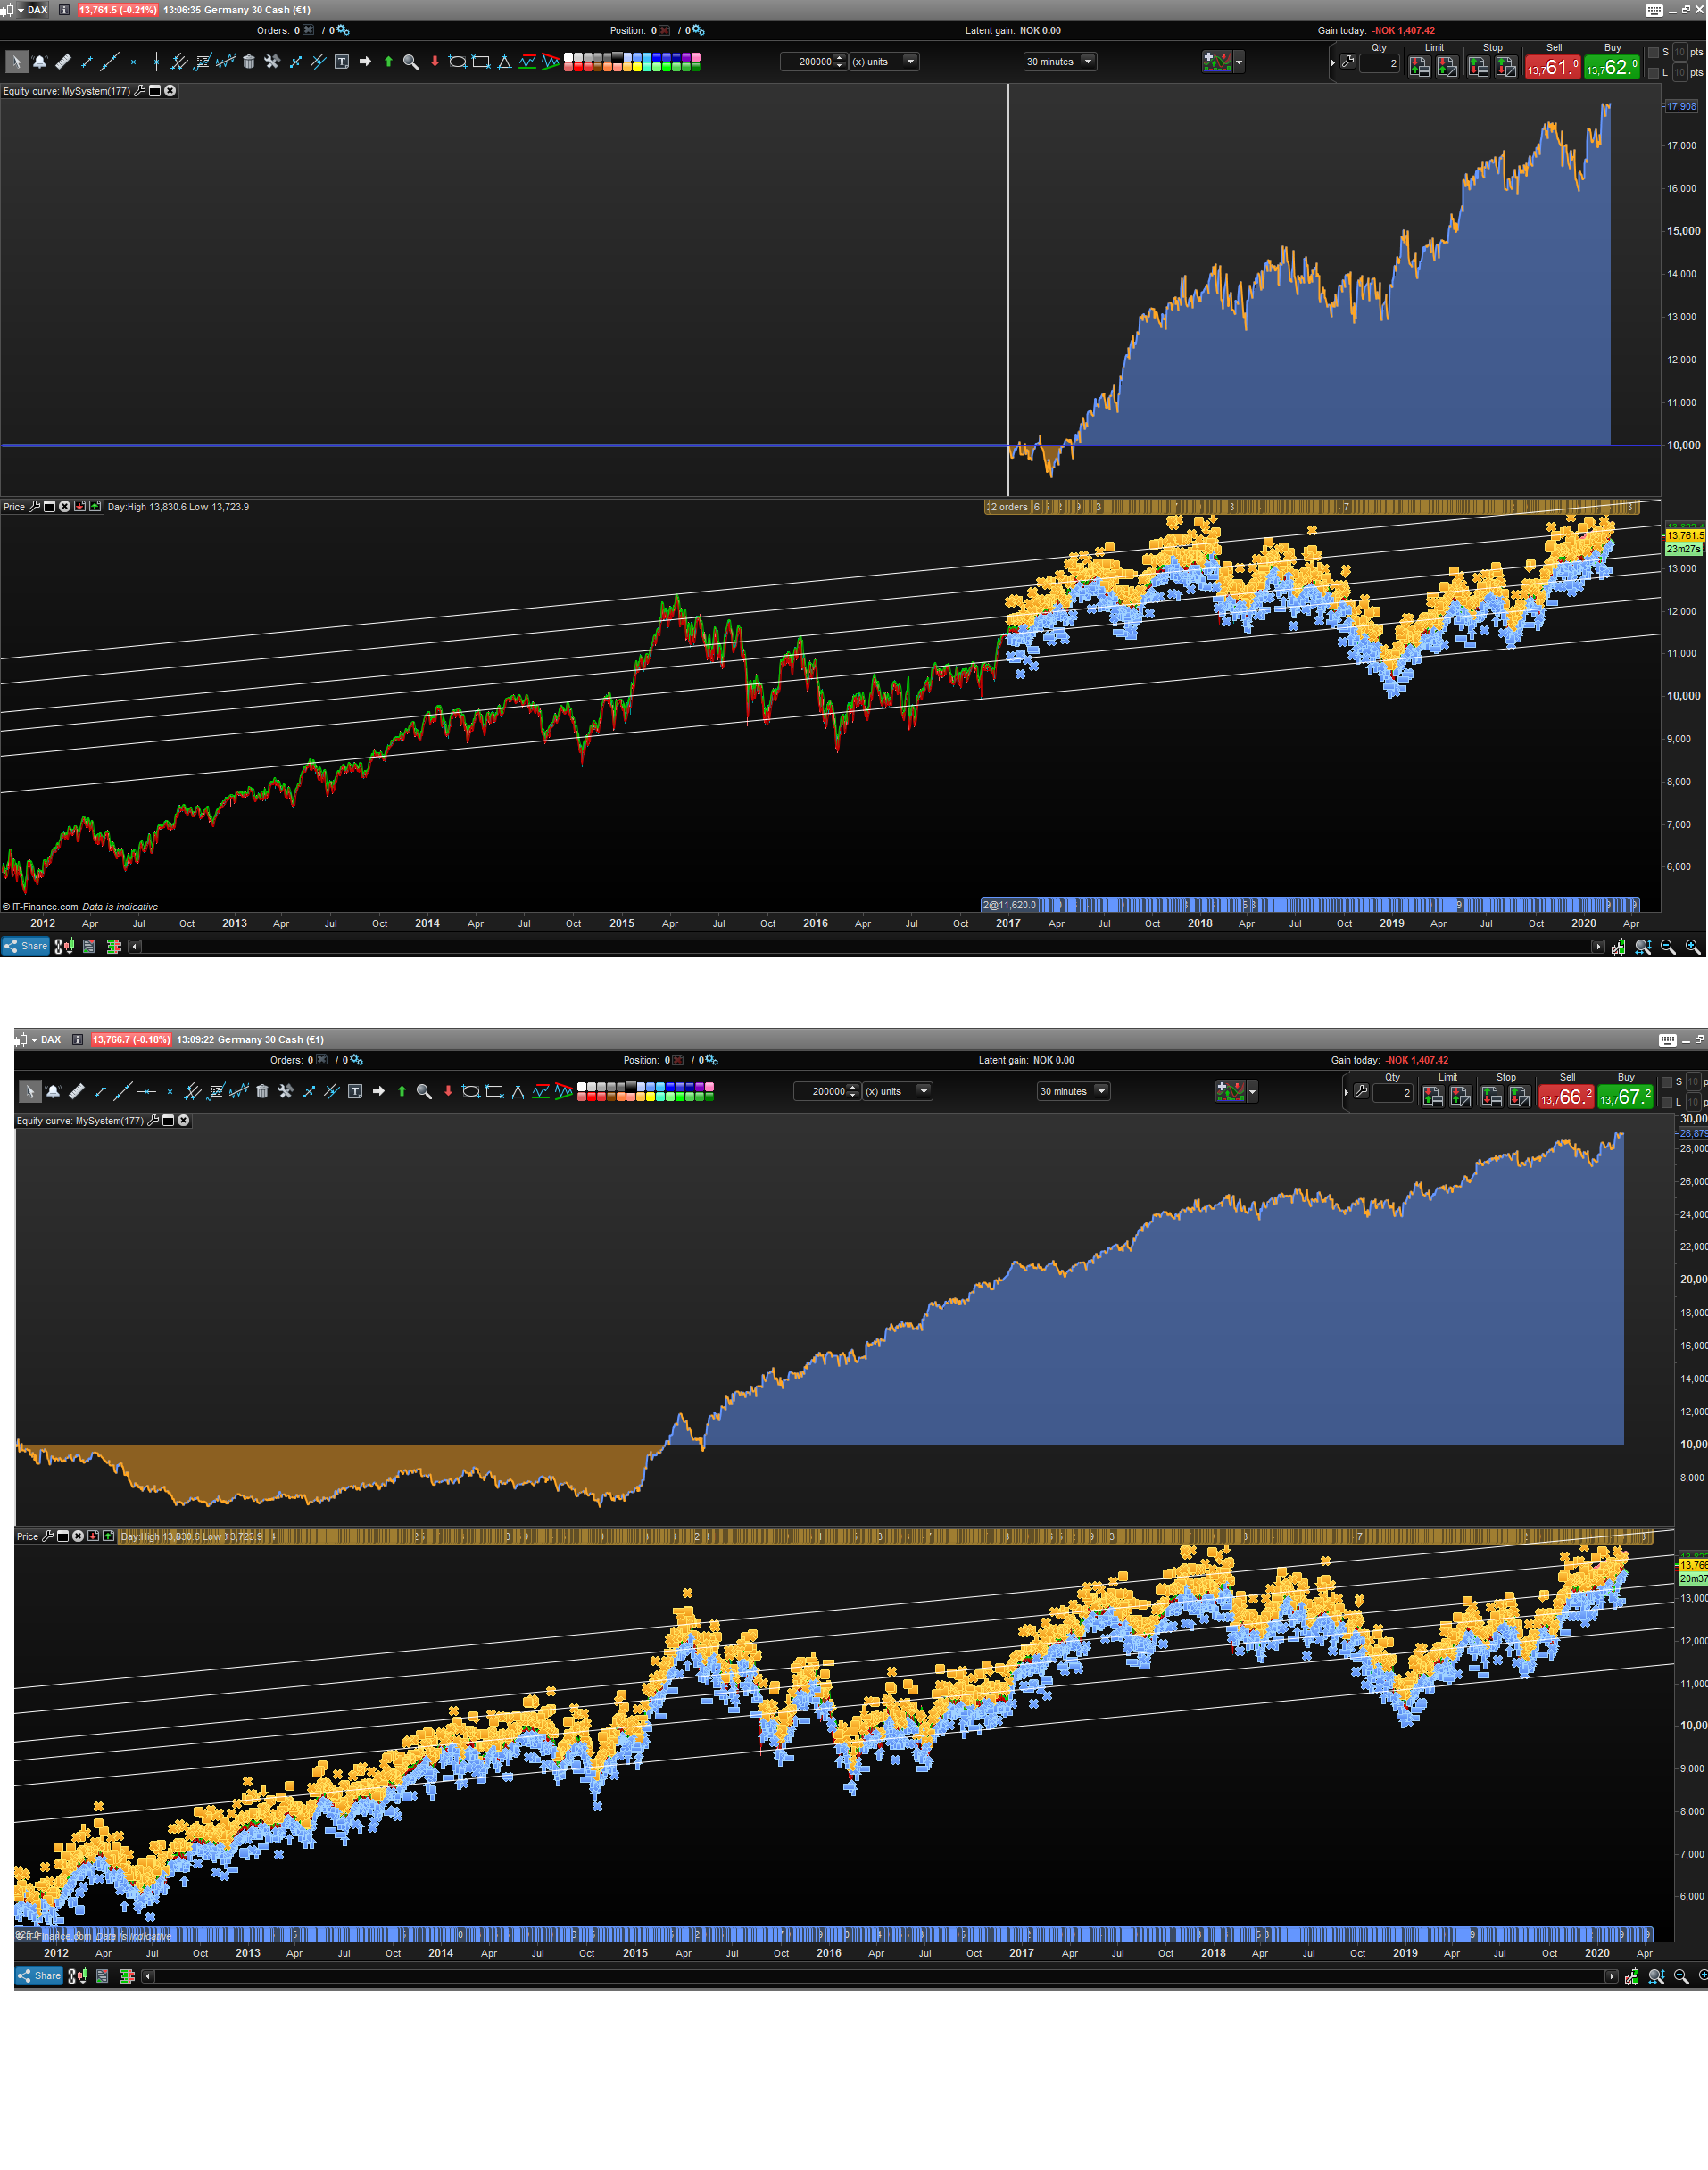
@jebus89 I use 200k bars, but in range with tick-by-tick is enabled. (=10 years of data), Is a habit to have it always on.
But there isn’t actually tick-by-tick data used on such timeframe so it doesn’t need to be on.
I would’ve like as defence bring up the dow difference 8000 to 30000 and the spread used. I remember a topic of vonasi in which spread can influences charts going way back. That doesn’t fly here though! Because with or without spread the charts look in general the same.
So what to make of this. Better to optimise on higher timeframe without tick-by-tick and perhaps with no spread and go from there.