Paul
PaulParticipant
Master
Hi Folks!
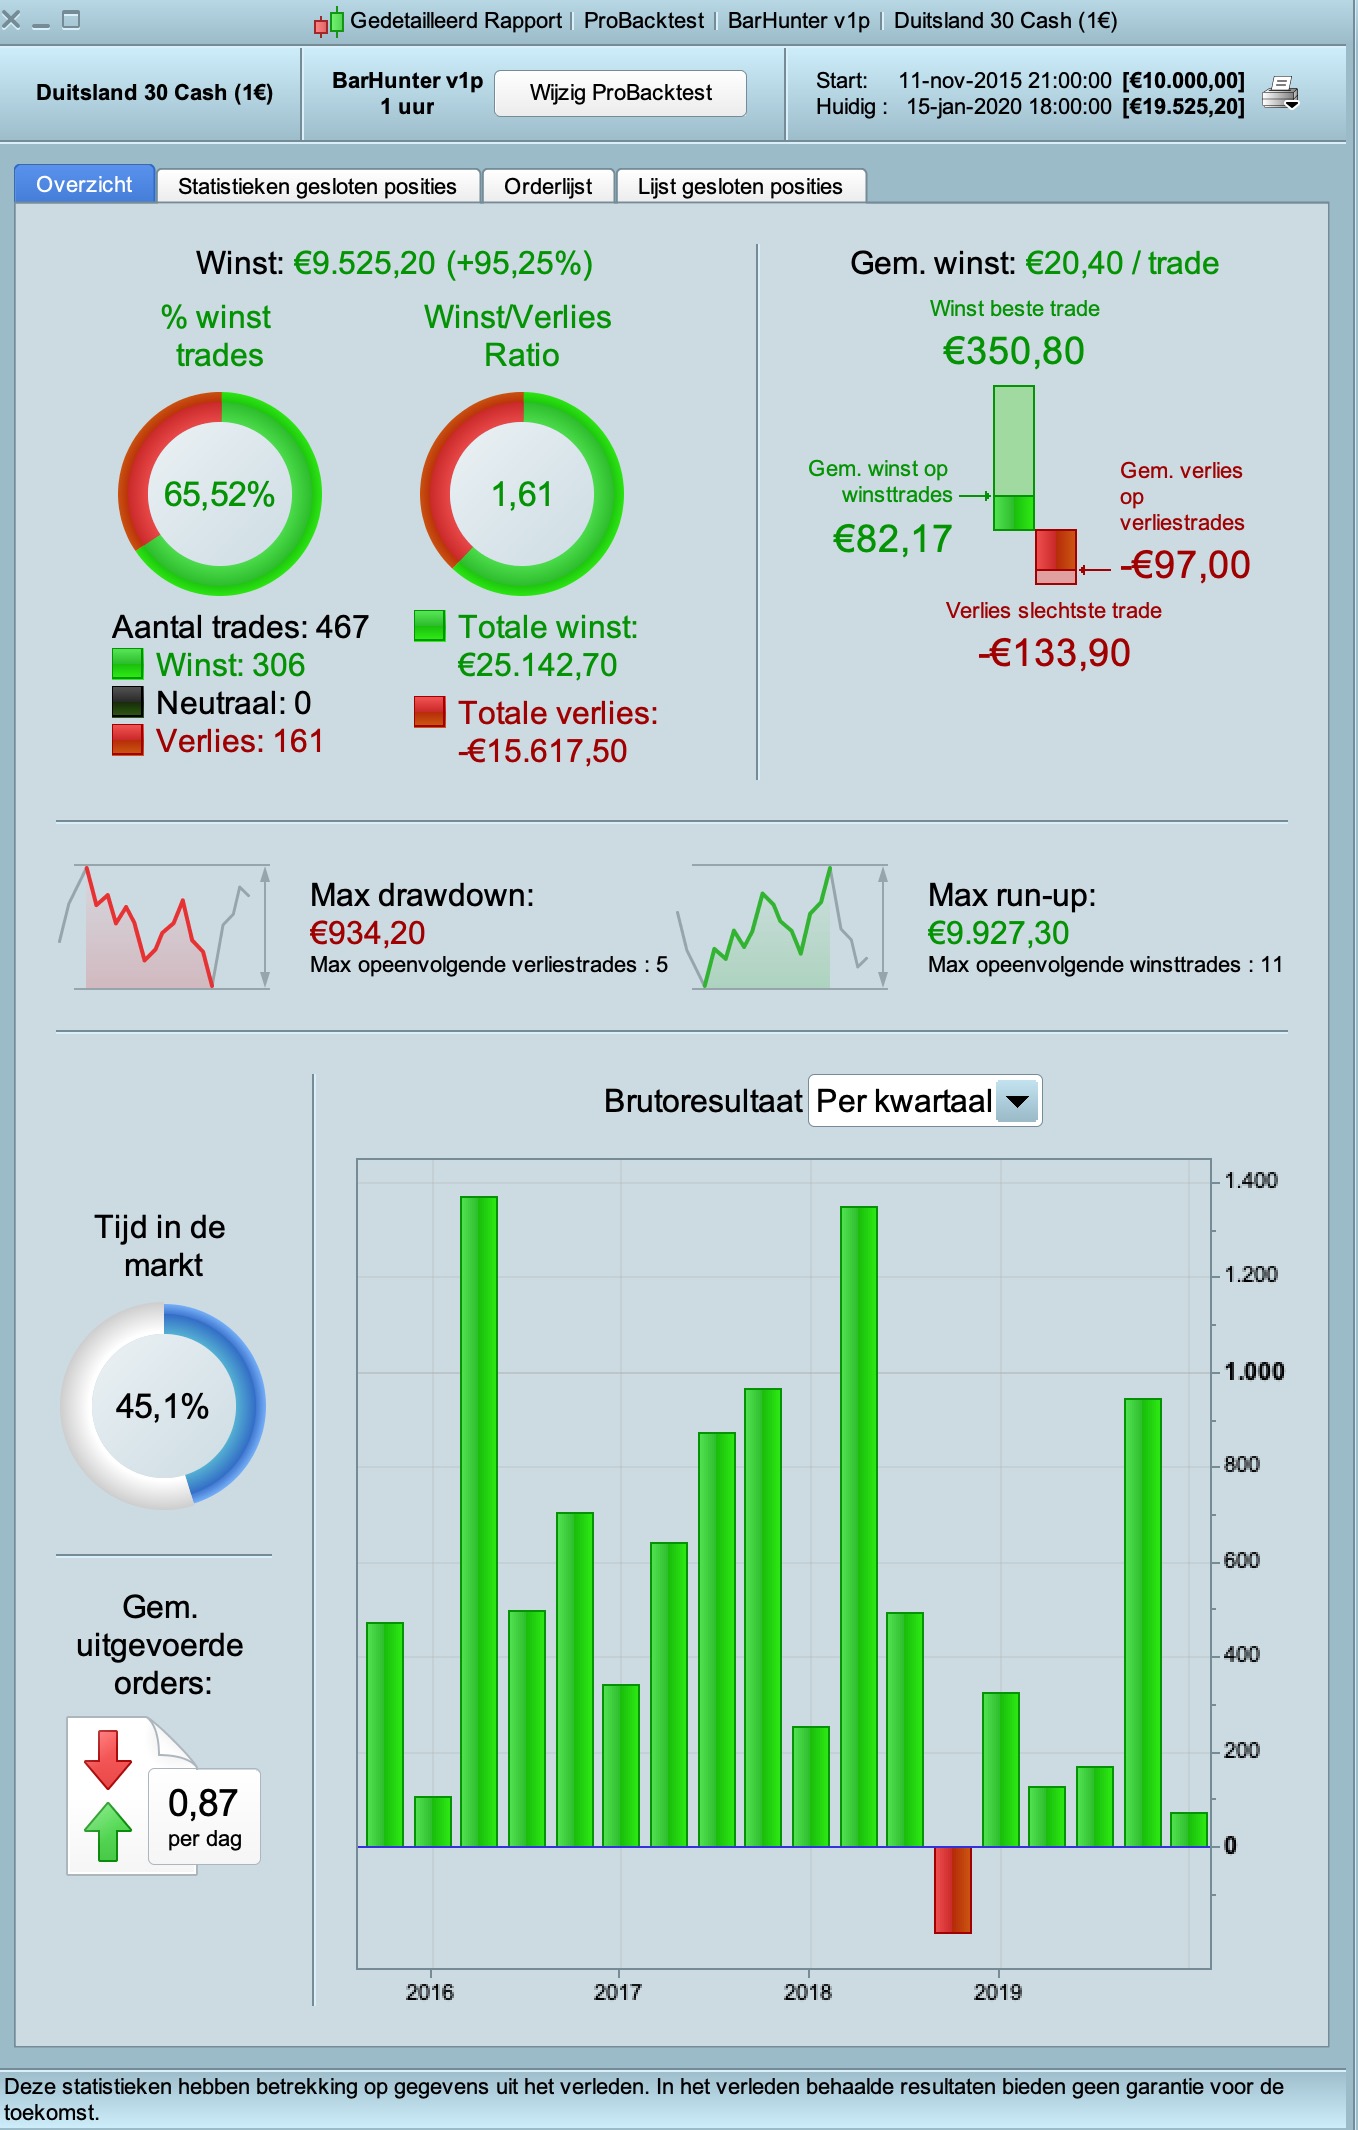
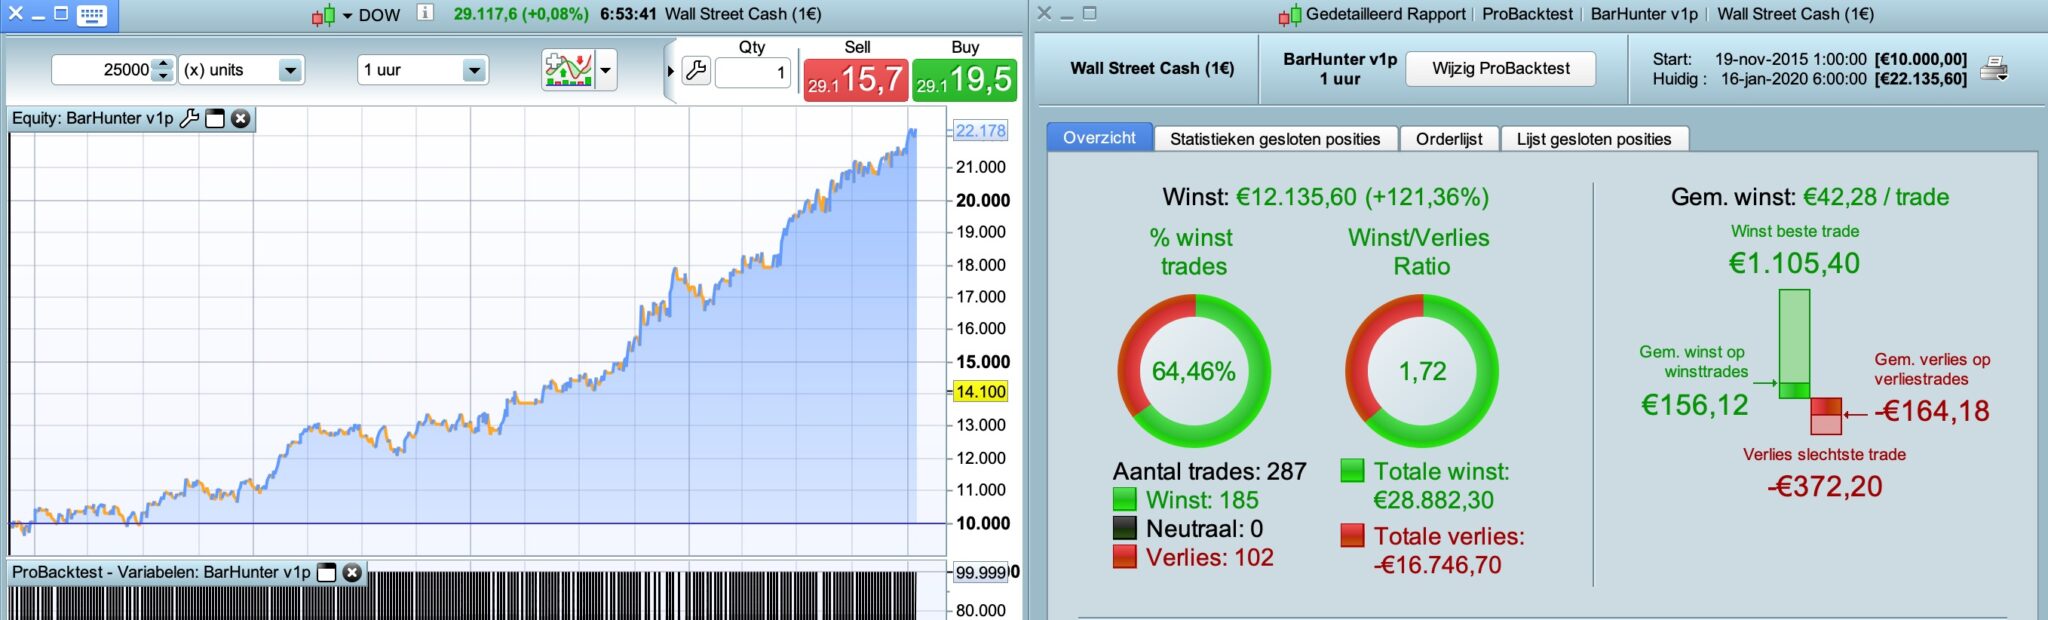
Here’s a new strategy BarHunter v1p, which searches for the best intradaybar on any timeframe and enter on a defined break.
The goal is many trades on higher timeframes. It had to work with 1% stoploss and a trailing stop.
Then if there is a reasonable good equity-curve with minimal curve-fitting it’s possible to enable & optimise trend-detection and perhaps limit the hour of entry.
Happy Hunting!
Looks pretty good as always!
Thanks for your contribution 😀
PaulParticipant
Master
Glad you like it! Wanted to prove a point in the day openstraddle so I create this 🙂 Many trades!
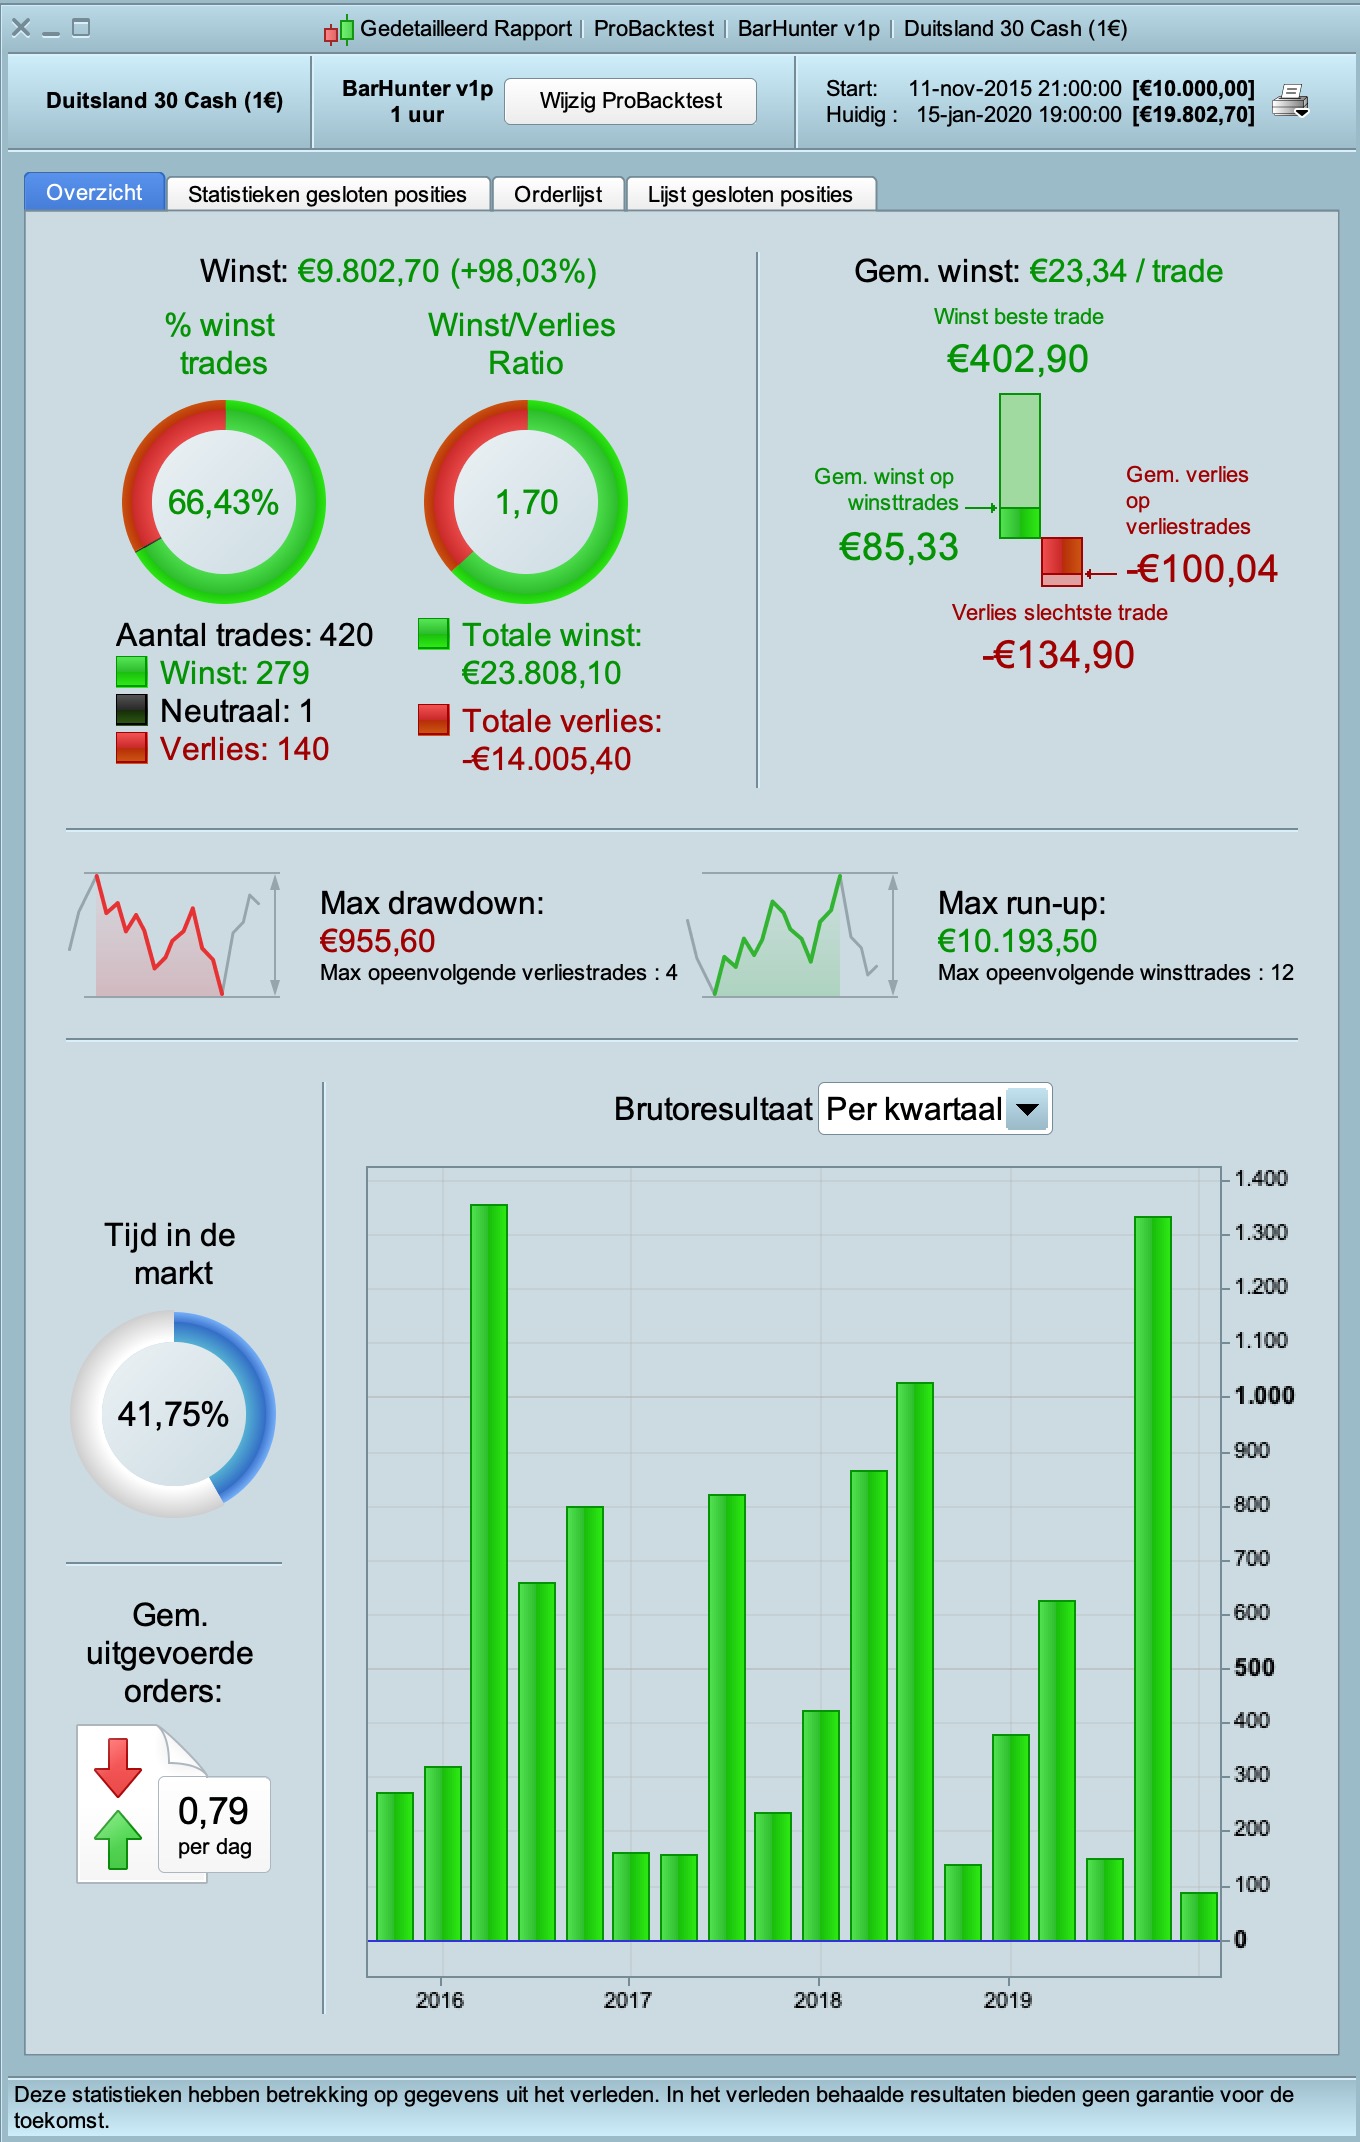
Also use
once barnumberlong =3 //long
once barnumbershort=2 //short
and it is even better!
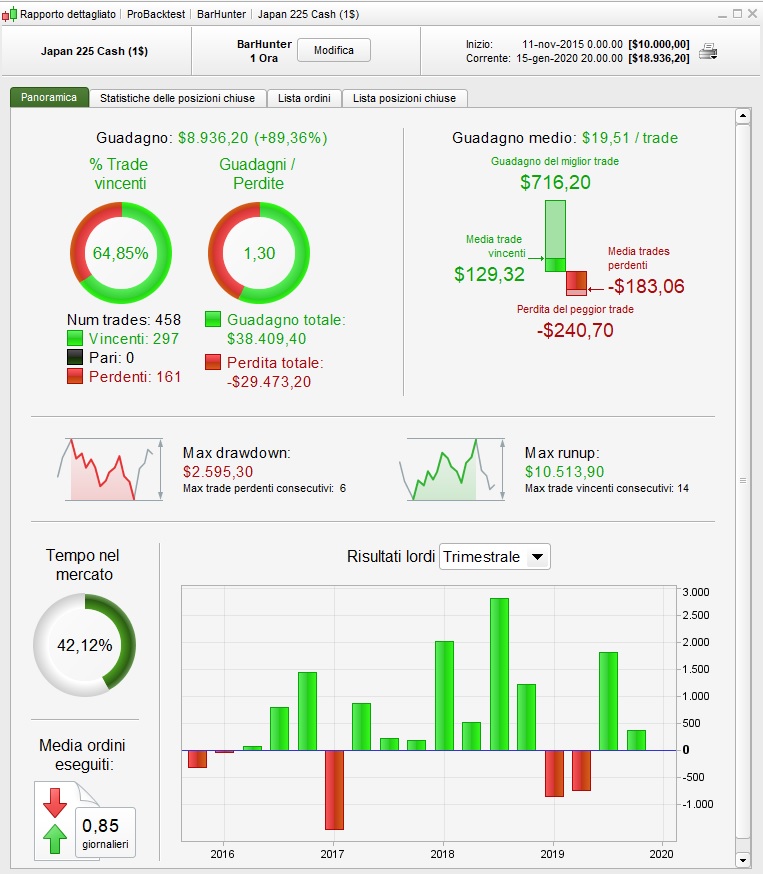
Ok i made a very fast test, and i noticed that on nikkei 225 that’s a percentage of gain similar to the dax (89.36%) but with a gain loss ratio much more lower.
Do you think could be worth trying to optimize on nikkei? Not because I’m saying your code isn’t good, but in order to diversify assets 😀
PaulParticipant
Master
Ofcourse! Other markets is my next step.Take care of the spread and I would optimise between 15-min – 1 hour timeframe. That should go quick, not many bars in a day. That with tds off.
But it’s always the details! The trailingstop is suited for the dax, but maybe not for the nikkei or s&p or forex.
So you have to turn on the graph of the trailing stop and need to see that it kick’s in.
i.e. for forex use
atrtrail=averagetruerange[atrtrailingperiod]((close/1)*pipsize)
dax
atrtrail=averagetruerange[atrtrailingperiod]((close/10)*pipsize)/1000
s&p is different too.
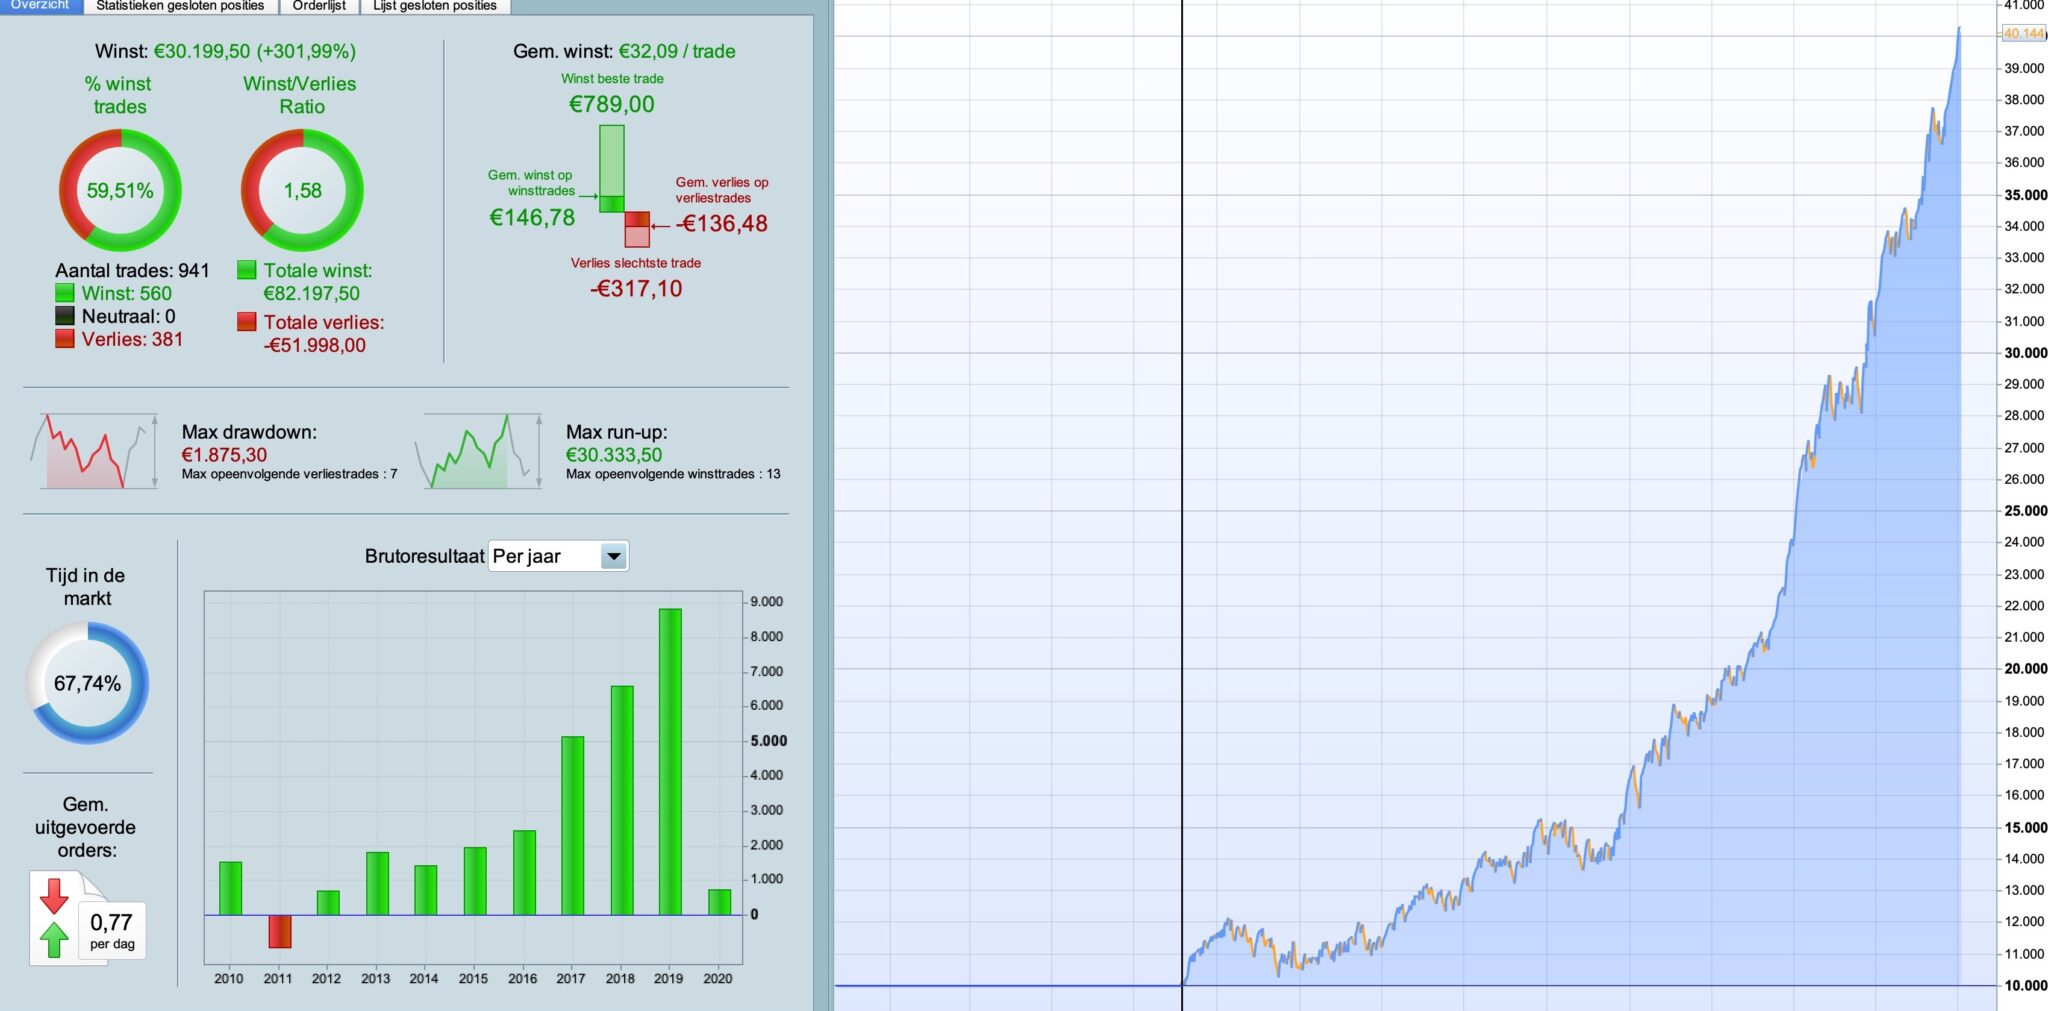
Optimized for nikkei. Huge gain percentage but huge drawdown.
Sorry does not appear in the screen, the dradown is over 2k
PaulParticipant
Master
Would love to have it working on the nikkei! Drawdown is big but equity-curve is oke.
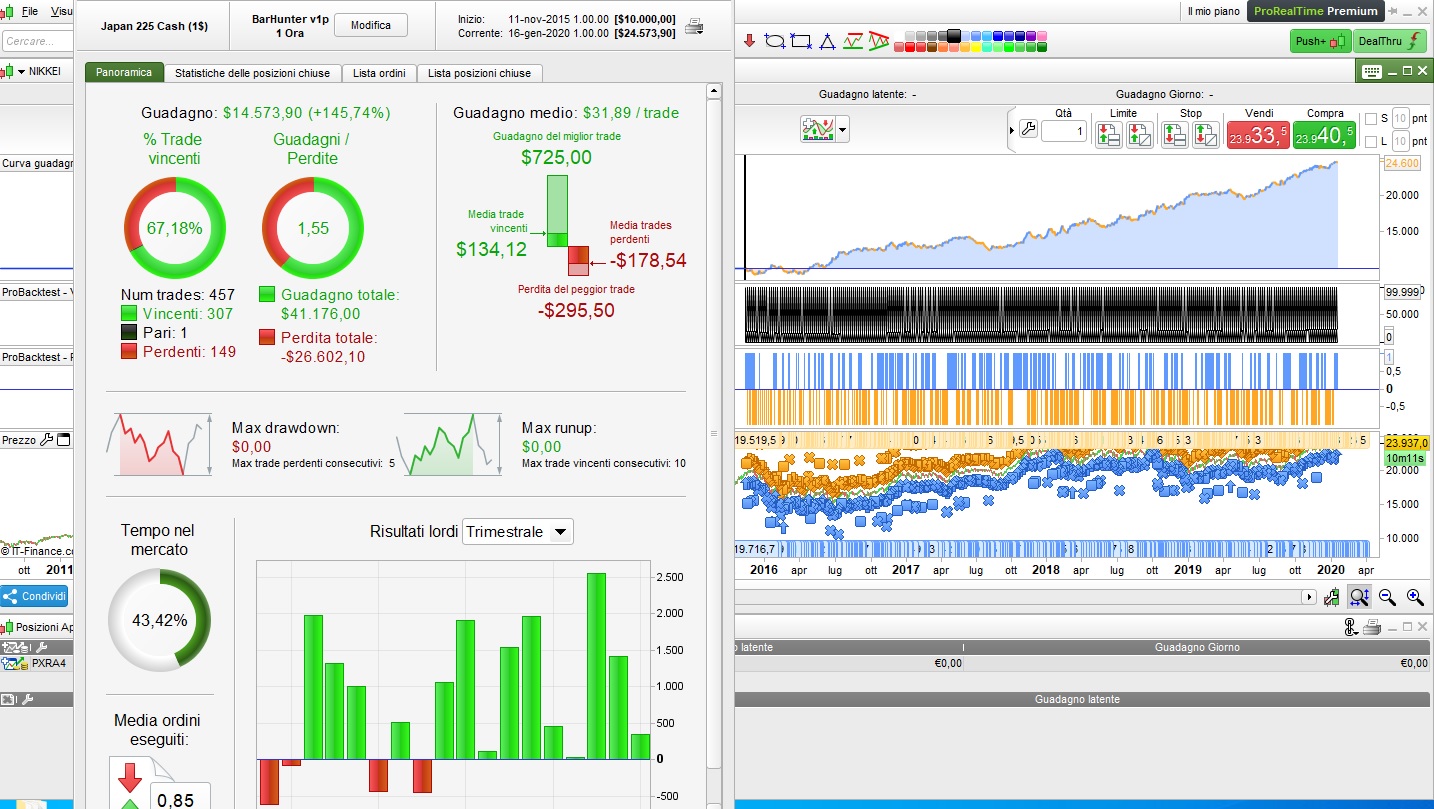
Here another one….optimise 0-23 and set break to 20 (not optimised), no tds and spread 15.
Such equity-curve created in less then 5 minutes.
PaulParticipant
Master
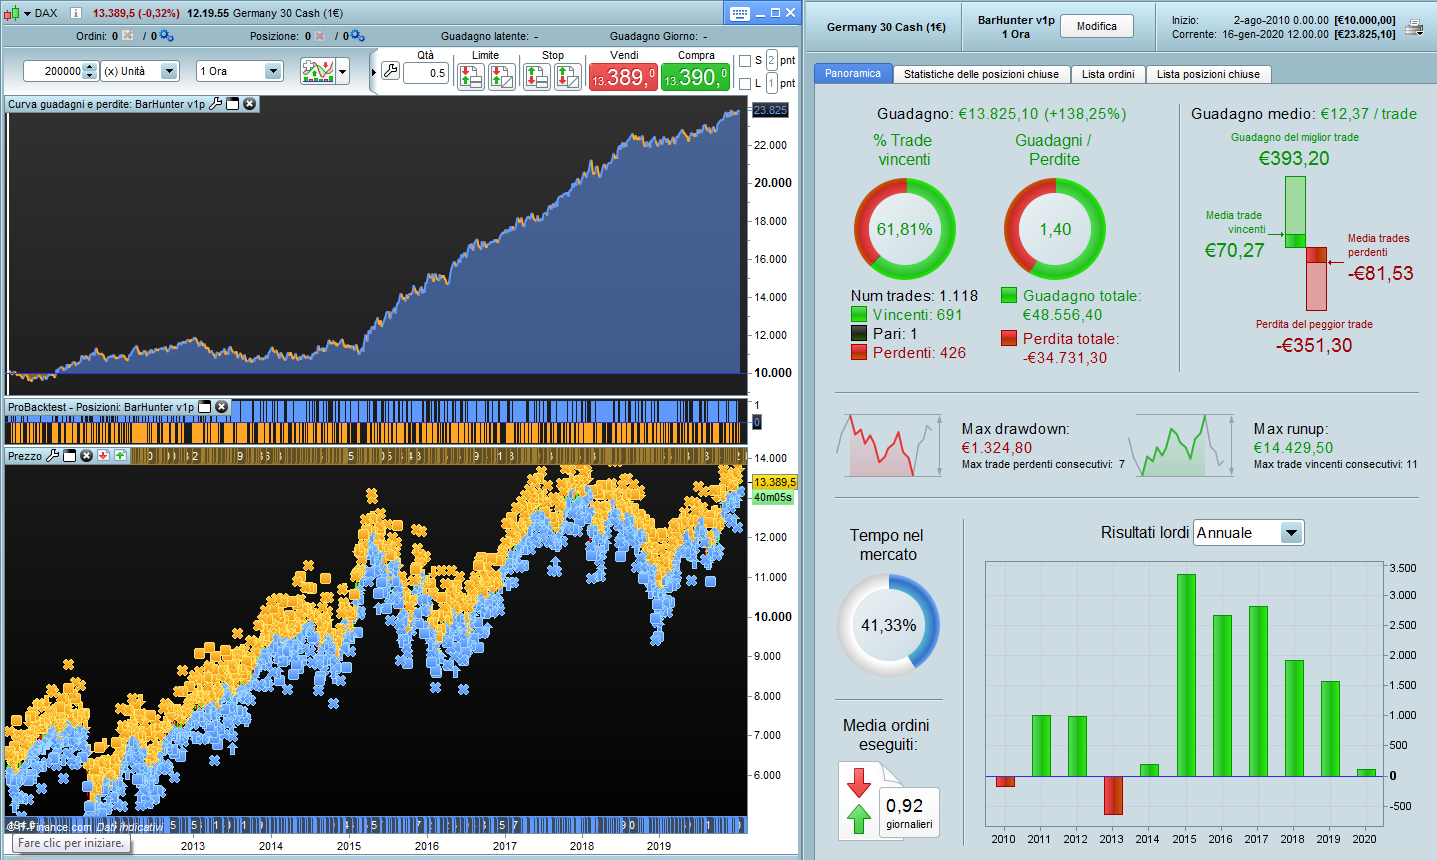
wrong pic, here’s the good one
Paul – I see that you are back testing on only 25k units. How does it look on 100k (or 200k if you have it) with the optimised settings fixed?
@Paul love it! This system is surprisingly versatile! Can you share the version for the South Africa?
There’s no way to “upgrade” the number of trades? Could be perfect for all day trading
@Vonasi Don’t you think a backtest beyond 5 years is useless?
If it can be useful, done with 200K
PaulParticipant
Master
In theory it should be possible I guess to make 100k bars of 15 min the same as 25k bars of 1 hour. (without atr but with % profit target)
if longtrading or (longtrading and shorttrading) then
if intradaybarindex=barnumberlong then
breakvaluelong=highest[4](high) //experiment!
endif
endif
if shorttrading or (longtrading and shorttrading) then
if intradaybarindex=barnumbershort then
breakvalueshort=lowest[4](low) //experiment!
endif
endif
Lines are the same on both timeframes.
And repeat the entry to check four bars with buy/sellshort on stop instead of one
If that’s the cause it would take a bit the worry away from only 2500 bars.
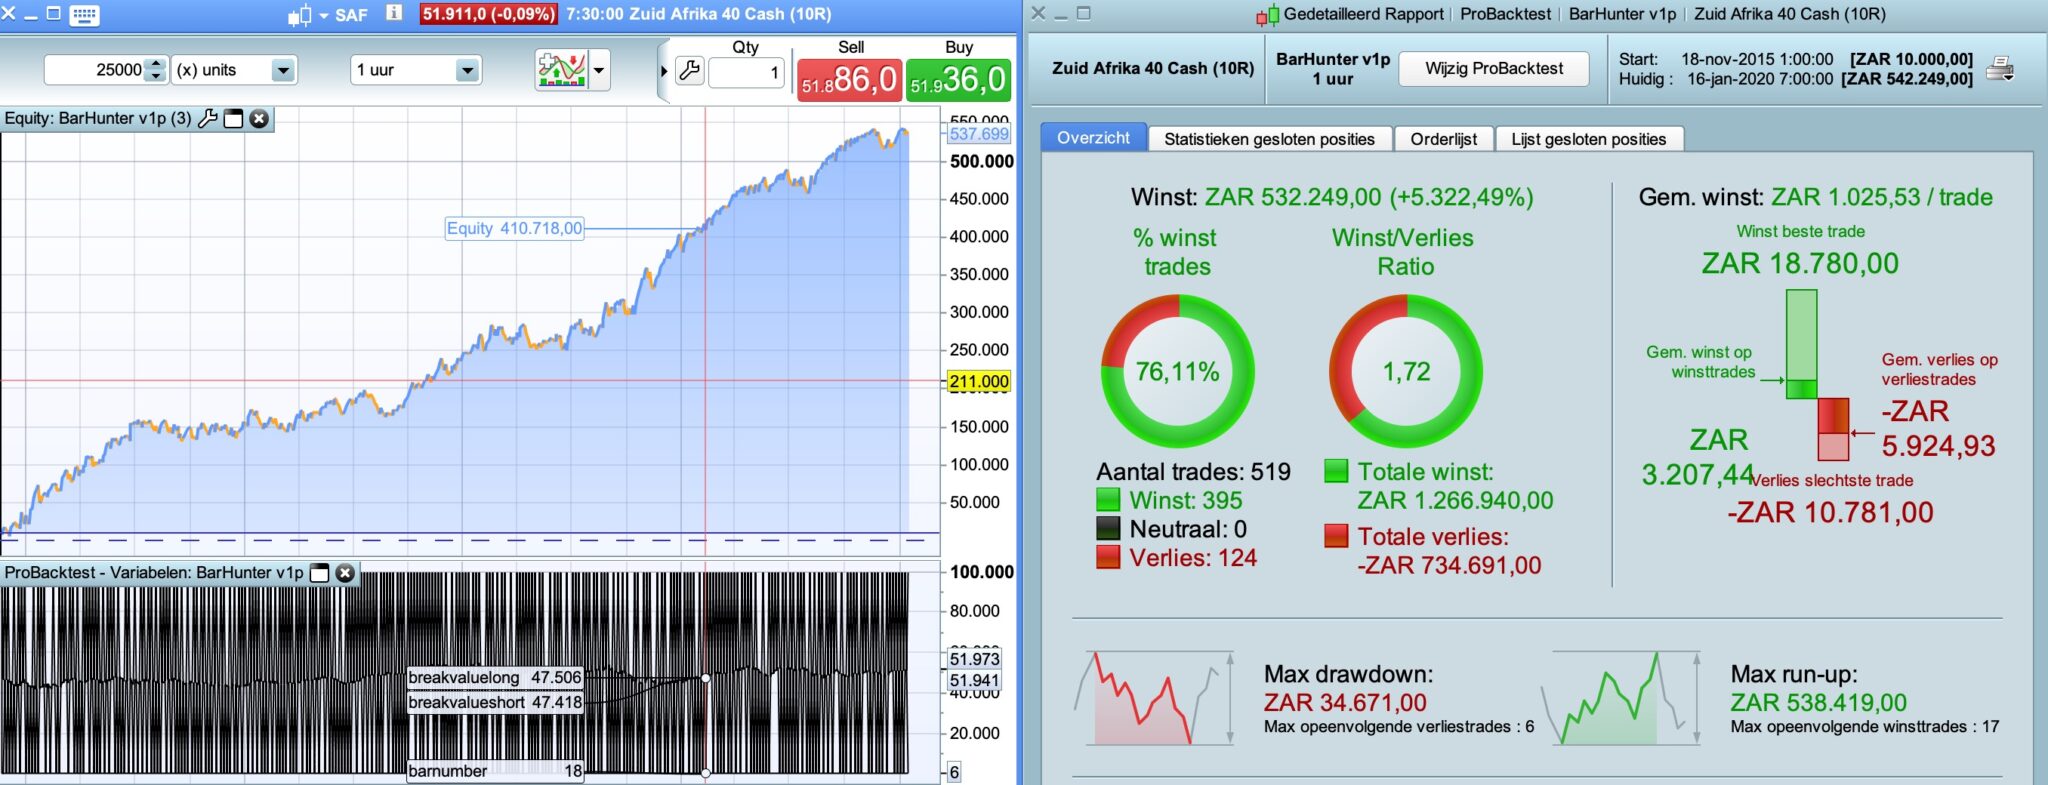
@Francesco The South Africa version
Don’t you think a backtest beyond 5 years is useless?
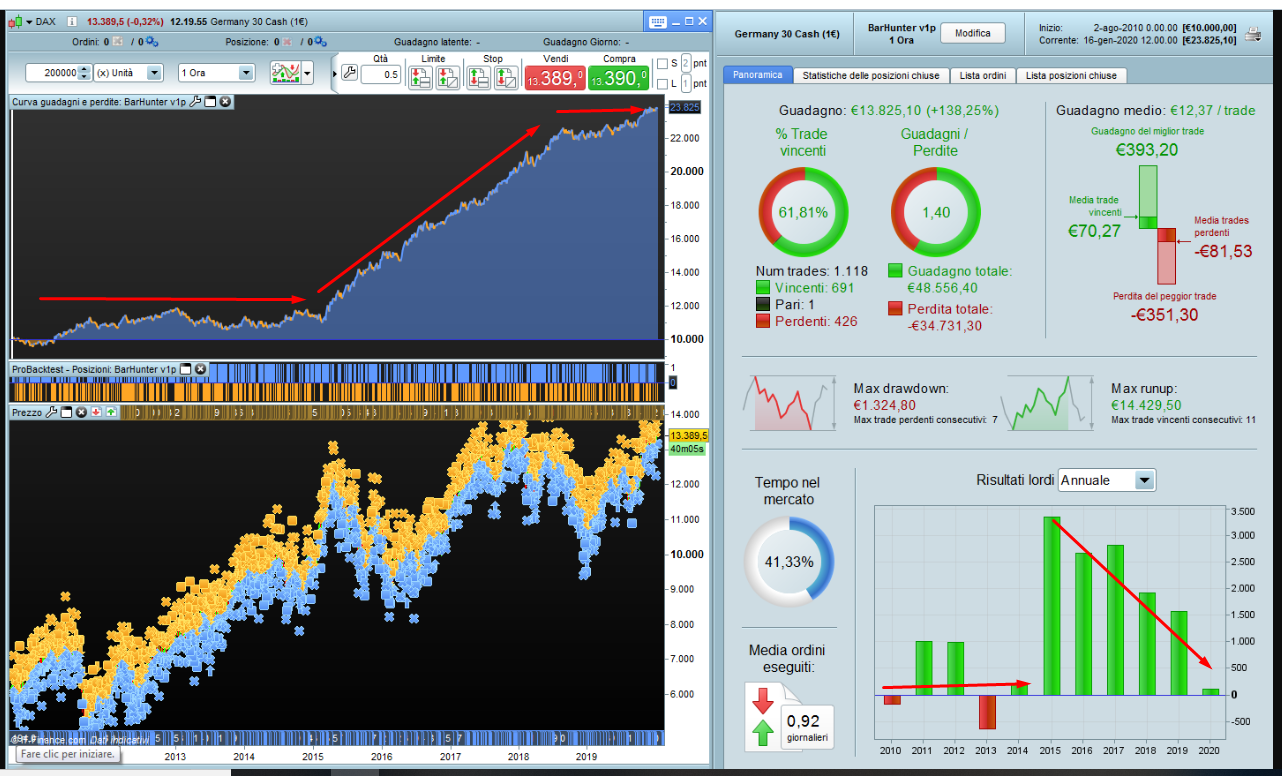
Far from useless as Mauro’s 200k back test shows us. Basically the strategy is a fit to a certain amount of data and it goes sideways before that and virtually sideways on recent data. The probability of it performing well going forward is unlikely.
PaulParticipant
Master
@Vonasi you’re right. If a certain hour was suitable for a certain period, it could be shifted. Perhaps a quick forward test with many OOS data with would make it clear.
In any case this posted pic above is the opposite of my other strategy 1 hour TF to show your point,