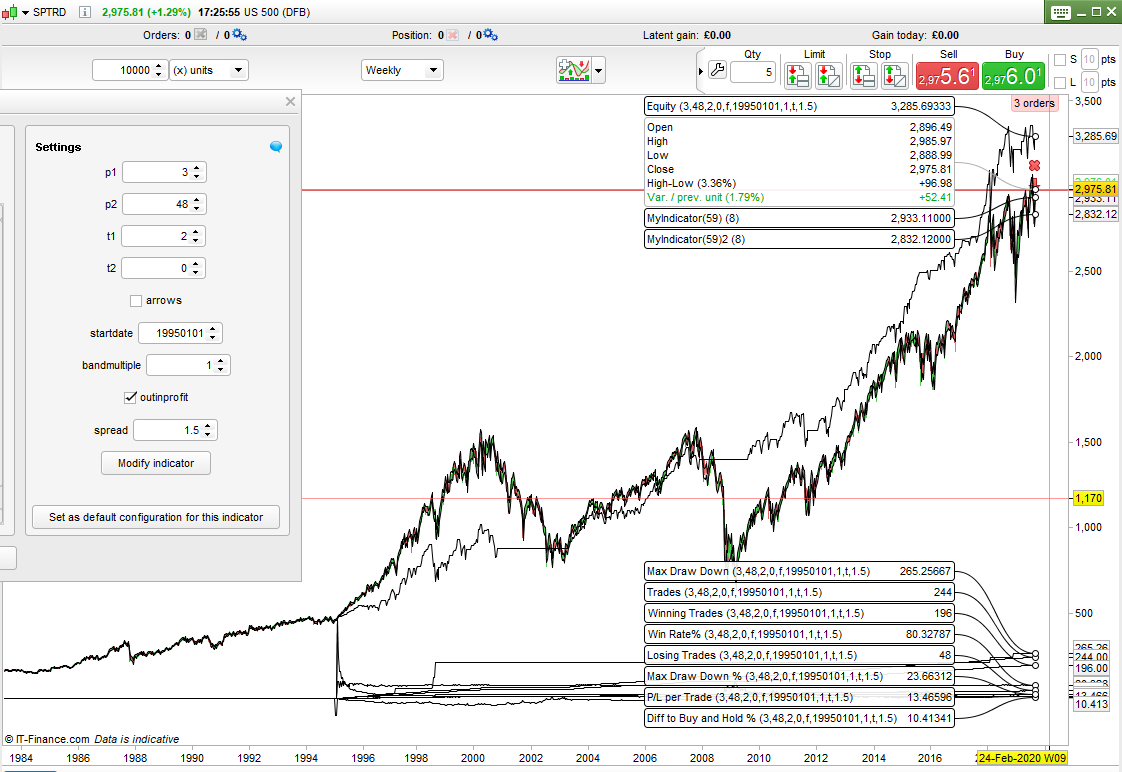
I made some further changes to my simulated tick by tick with one pending order simulator.
It now also shows lines for:
- trade quantity
- quantity of winning trades
- quantity of losing trades
- average gain/loss per trade,
- win rate%
- gain/loss percentage compared to buy and hold
- biggest draw down
- maximum draw down % from the maximum equity prior to the draw down
There is also now a band width multiplier to allow testing of slightly narrower or wider bands for the entry and exit points.
Also there is the option to turn on or off the exit condition to exit any time that you are in profit at the close of a candle.
I’ve added spread into the equity calculation.
I’ve also added some comments to the code.
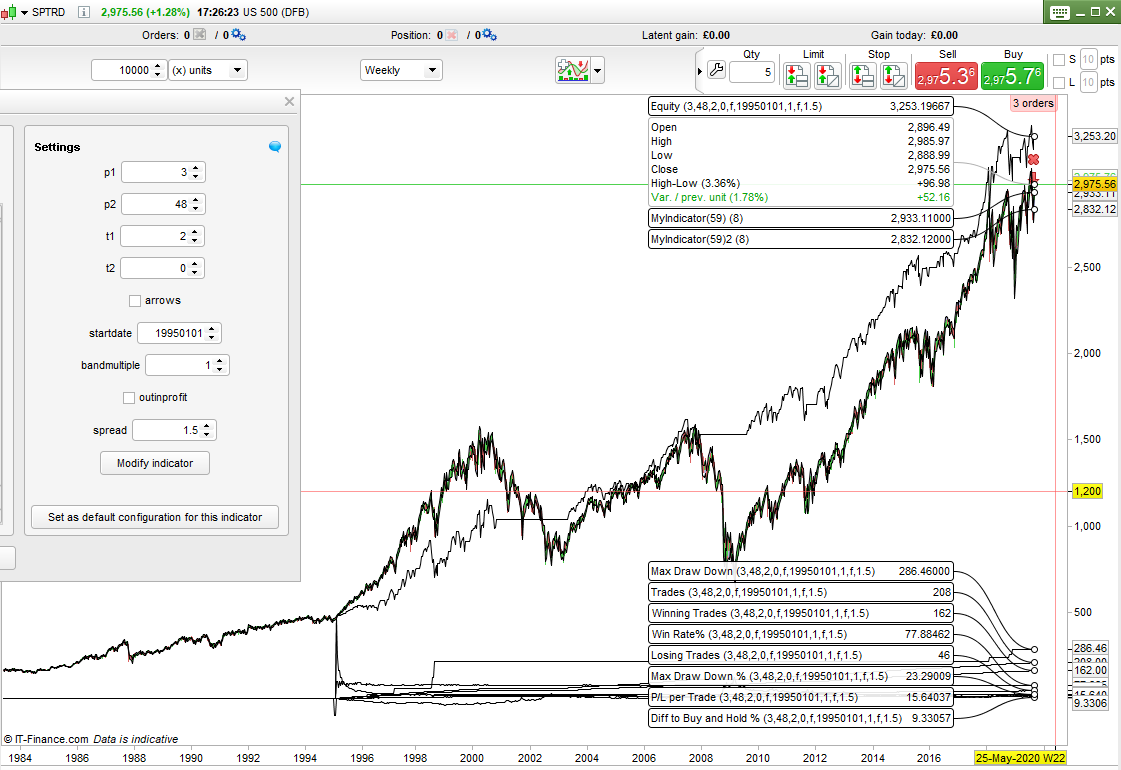
The images show the strategy on the weekly SP500 with and without the ‘get out if in profit’ turned on and with a 1.5 spread. With the settings as shown it beats buy and hold by 9% and 10% with a biggest draw down of 23% and 24% and a win rate of 78% and 80%. Perhaps it isn’t such a bad strategy idea after all – well it would have been a good one at least if I’d started trading it in 1995!
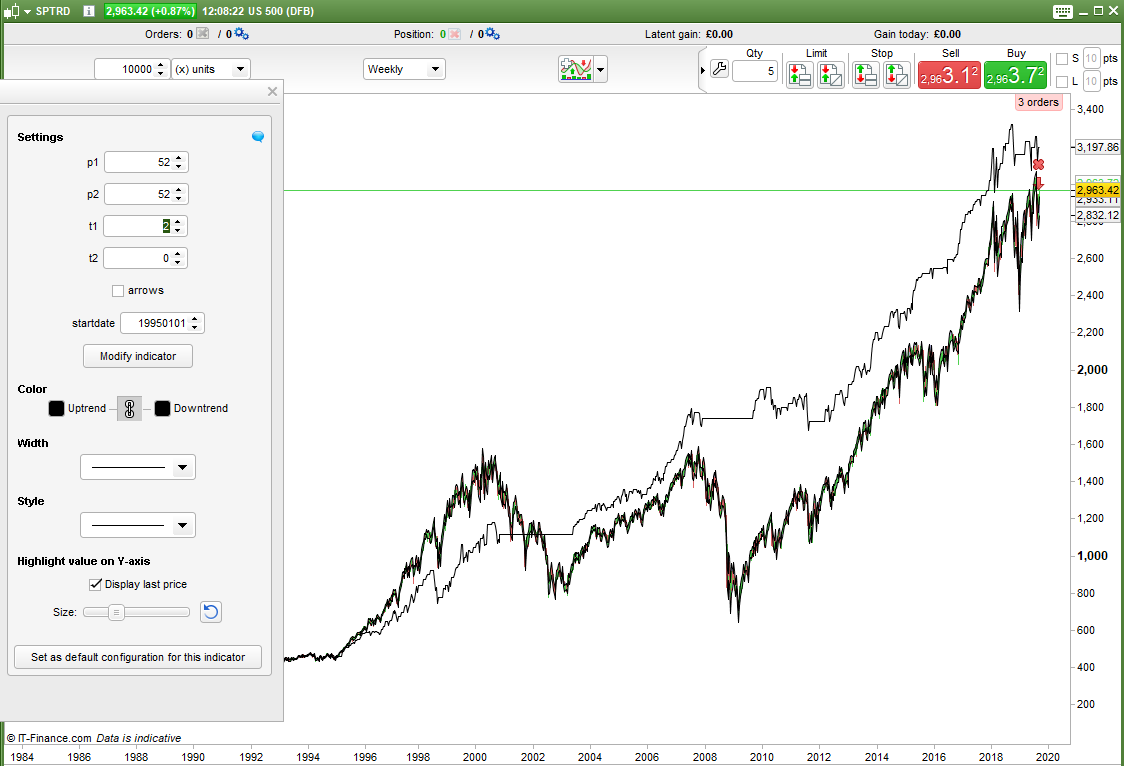
//p1 = 52 // band average period
//p2 = 52 // filter average period
//t1 = 0 // band average type
//t2 = 0 // filter average type
//arrows = 1 //turn arrows on/off
//startdate = 19950101 //date to start test from
//bandmultiple = 1 // band multiplier
//spread = 1.5

//make sure average types are between 0 and 6
t1 = max(0, min(t1,6))
t2 = max(0, min(t2,6))

//calculate mae and mfe bands
upper = close[1] + average[p1,t1](high[2]-open[1])
lower = (average[p1,t1](close[2]-low[1])) * bandmultiple

//check date is ok to trade
if opendate >= startdate then

//simulated long entry
if (not flag) and (low < (close[1] - lower[1])) and (low[1] > average[p2,t2](close[1])) then
//draw buy arrow if on.
if arrows then
drawarrowup(barindex, low) coloured(0,128,0)
endif

entryprice = close[1] - lower[1]// simulated entry price
tradecount = tradecount + 1 // add one to trade count
startequity = equity
flag = 1 // we are on the market

//on the first trade set starting point for equity curve
if not eqflag then
startequity = entryprice
equity = entryprice
eqflag = 1 // make sure we don't do this again
endif
endif

//if on the market calculate the floating equity, max drawdown and max drawdown %
if flag[1] then
floatingequity = startequity + (close - entryprice)

maxequity = max(maxequity, floatingequity)
biggestdd = max(maxequity - floatingequity, biggestdd)
if biggestdd = maxequity - floatingequity then
ddperc = max((biggestdd/maxequity)*100, ddperc)
endif
endif

//simulated long exit including if in profit
if outinprofit and (flag[1] = 1) and (entryprice <> 0) and ((close > upper) or (close > entryprice)) then
equity = equity + (close - entryprice) - spread // calculate profit/loss
flag = 0 //we are not on market

//check if it was a win
if equity > equity[1] then
win = win + 1
endif

//draw sell arrow if on
if arrows then
drawarrowdown(barindex, high) coloured(128,0,0)
endif
endif

//simulated long exit not including if in profit
if not outinprofit and (flag[1] = 1) and (entryprice <> 0) and (close > upper) then
equity = equity + (close - entryprice) - spread// calculate profit/loss
flag = 0//we are not on market

//check if it was a win
if equity > equity[1] then
win = win + 1
endif

//draw sell arrow if on
if arrows then
drawarrowdown(barindex, high) coloured(128,0,0)
endif
endif

//calculate average gain, win rate and difference to buy and hold %
avggain = floatingequity/tradecount
winrate = (win/tradecount)*100
buyholddiff = ((floatingequity - close)/close)*100
endif

//calculate quantity of losing trades
losses = tradecount - win

return floatingequity as "Equity", tradecount as "Trades", avggain as "P/L per Trade", winrate as "Win Rate%", win as "Winning Trades", losses as "Losing Trades", buyholddiff as "Diff to Buy and Hold %", biggestdd as "Max Draw Down", ddperc as "Max Draw Down %"//,maxequity as "Max Equity"