Hello,
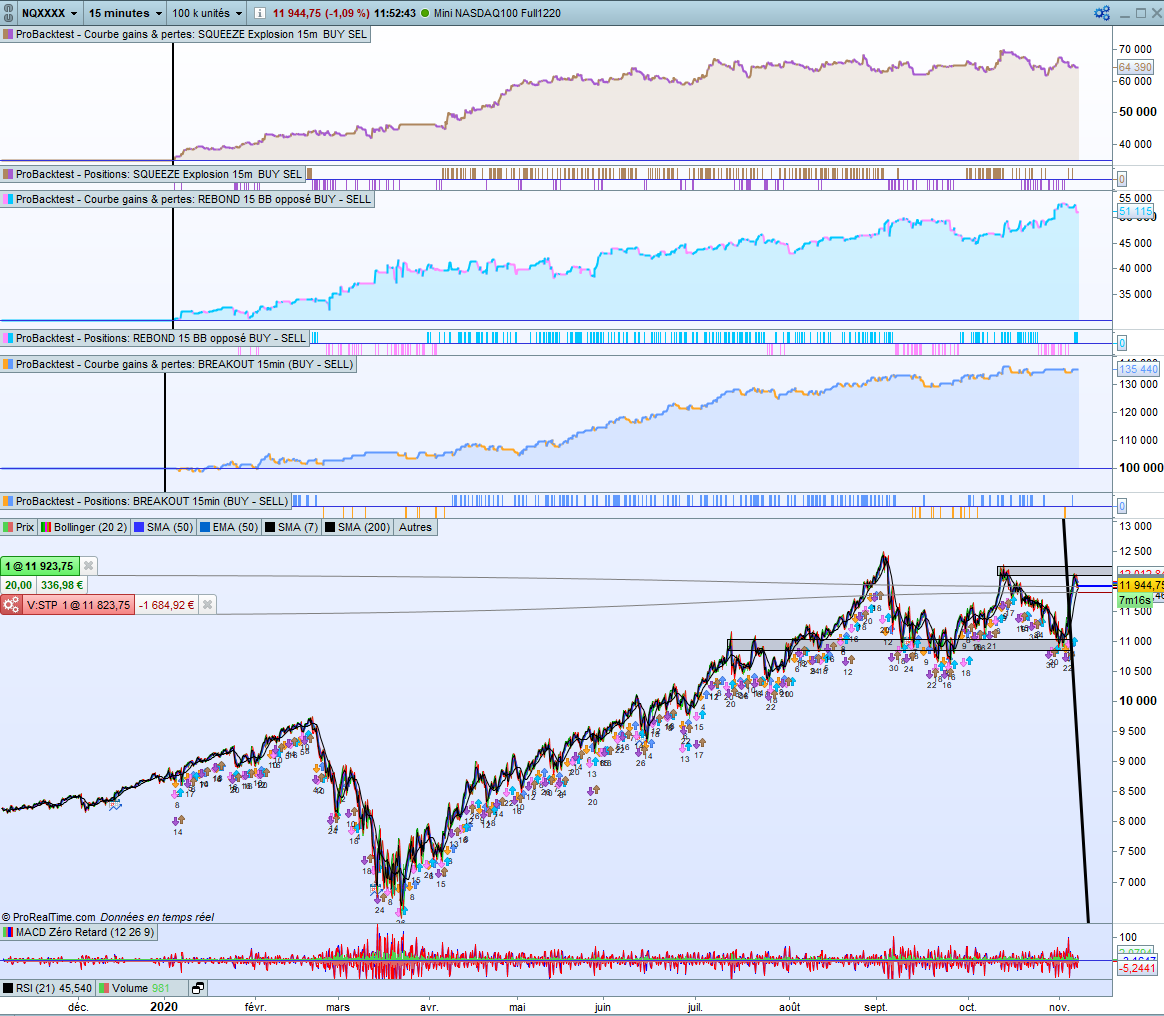
I have created 3 algos based on the methods I use in discretionary trading.
Here are the perfs of 3 algo for 1% invested per trade (hence the capital that starts at 100 000 for a 50pts SL and 30 000€ for a 30pts SL).
Over the period the benchmark (Nasdaq) is +35% with a drawdown of 30%.
The first robot does slightly better with 10 times less drawdown.
The other 2 do about 3 times better with 3 times less drawdown.
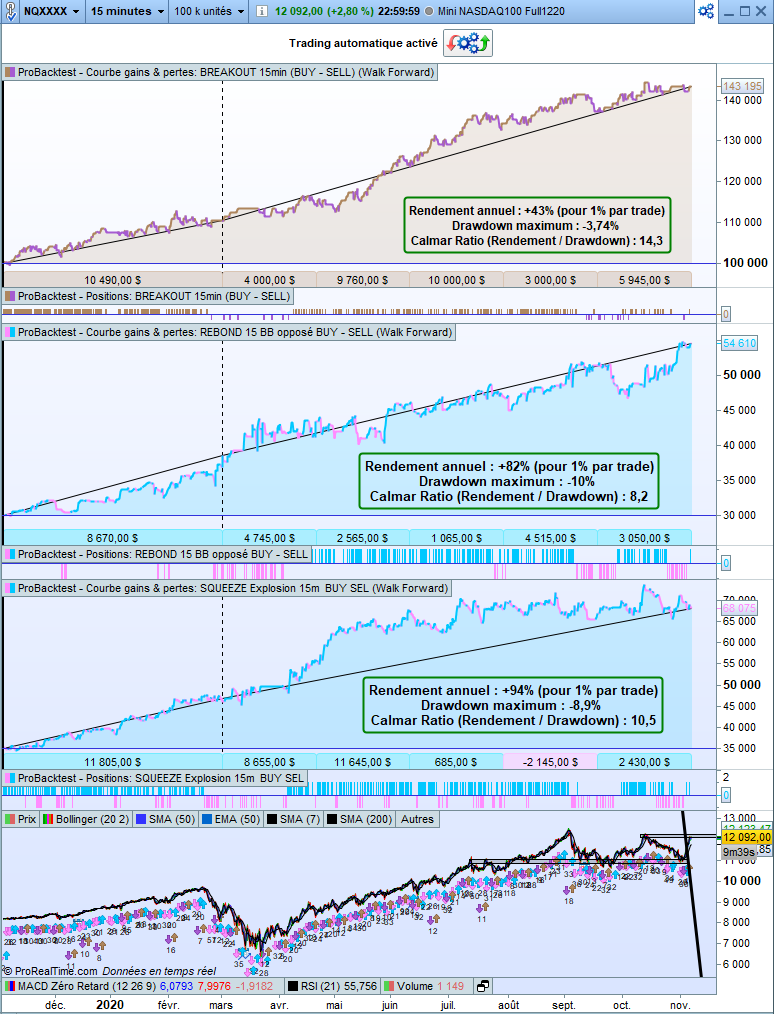
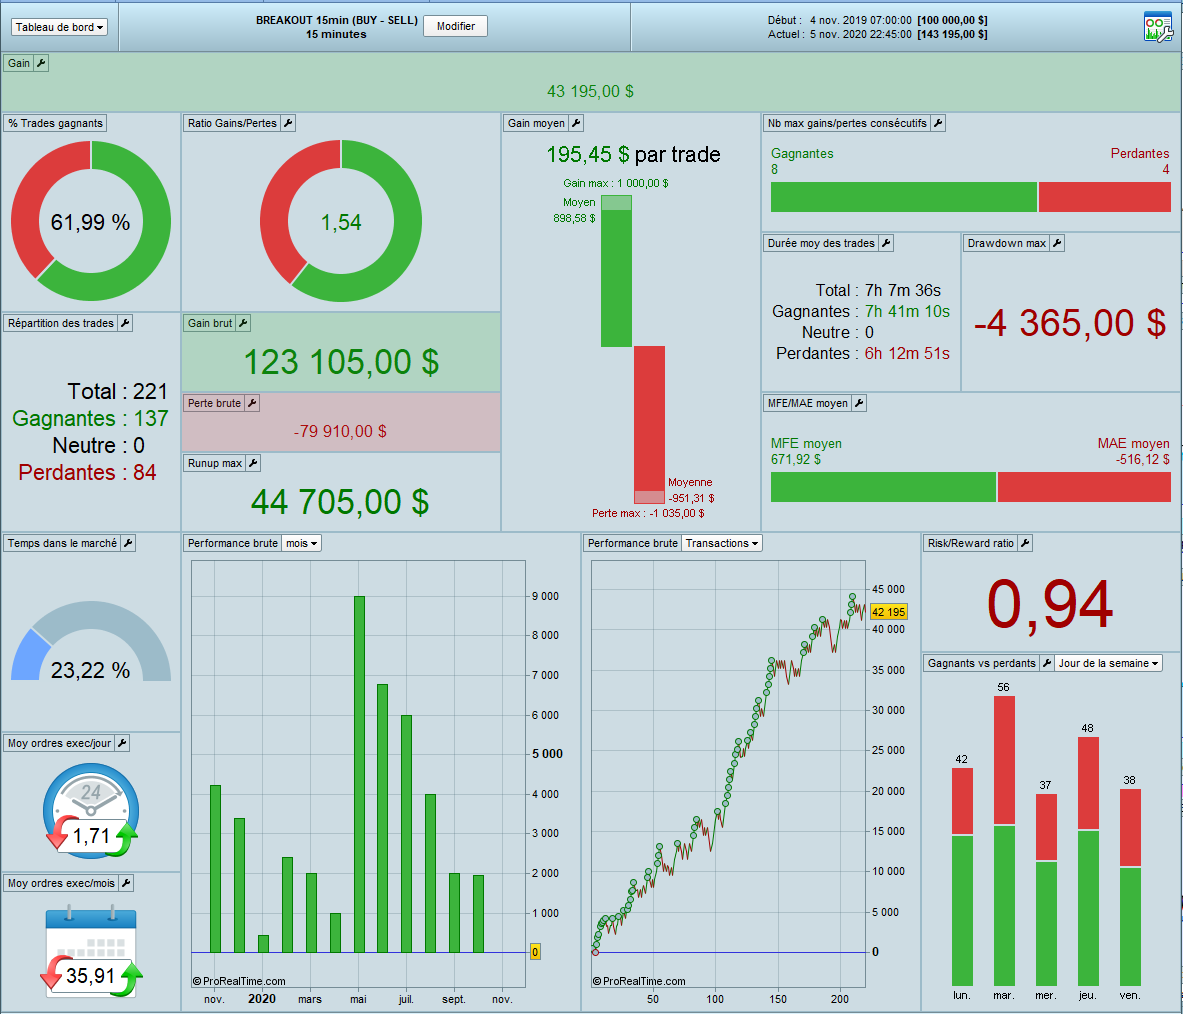
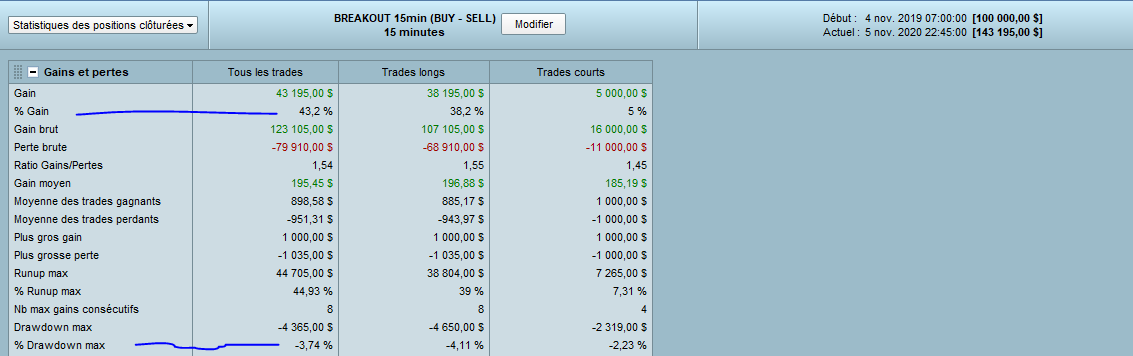
1. Breakout strategy with intraday trend following:
Annual return: +43%.
Maximum drawdown: -3.74%.
Calmar ratio (Return/Drawdown): 14.3
Average gain per trade : $195
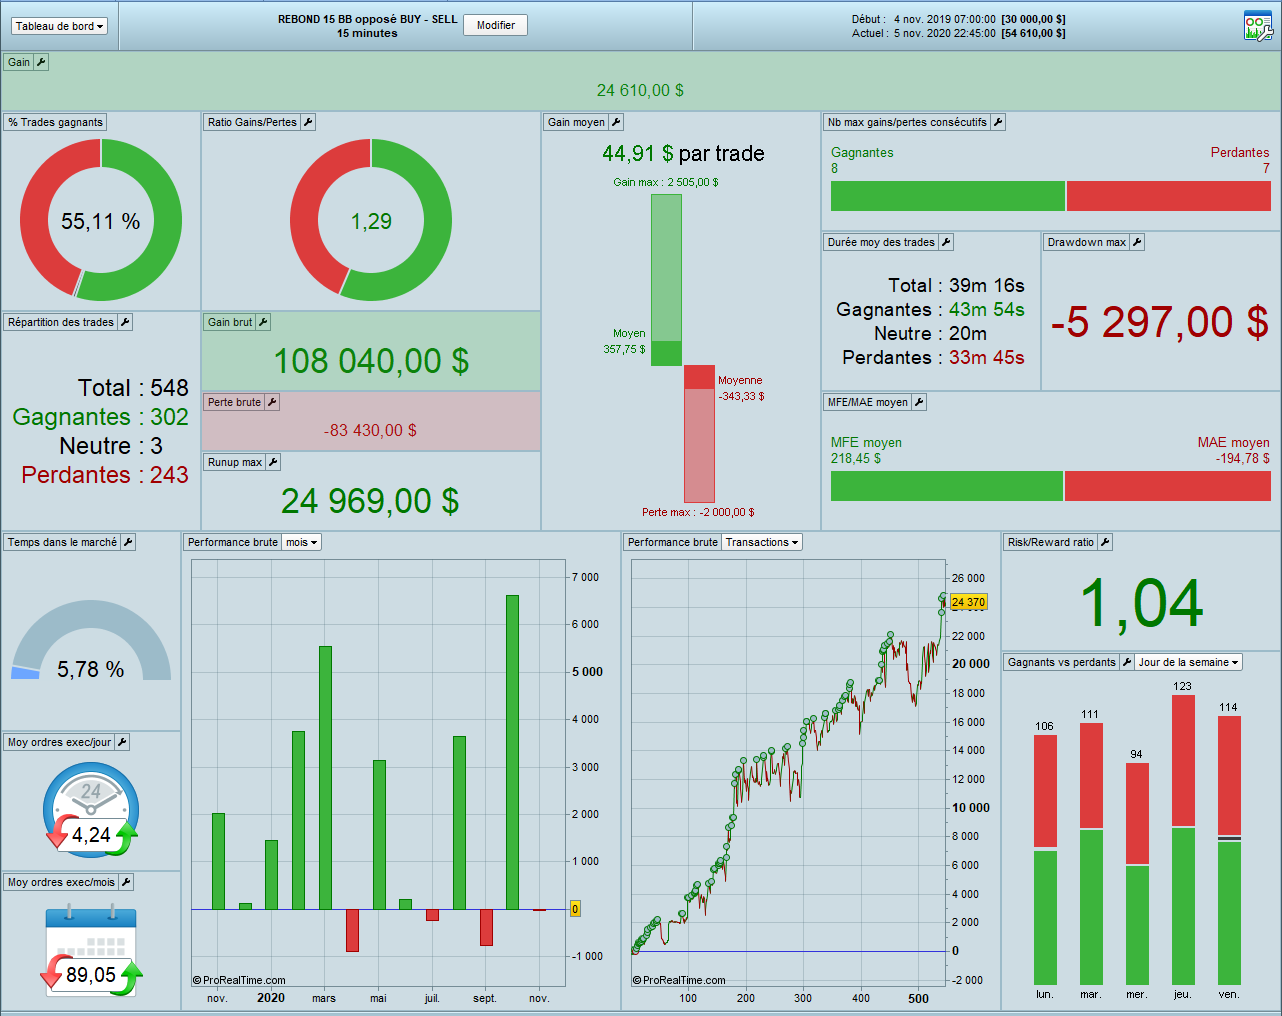
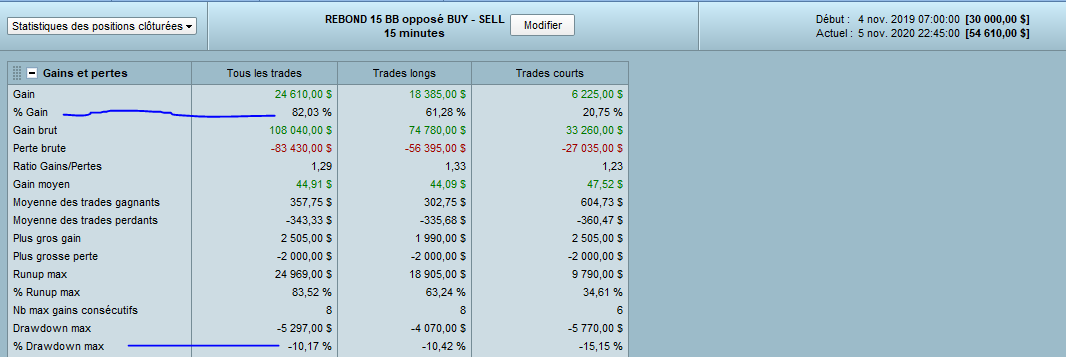
2. Intraday mean reversing strategy
Annual yield: +82%.
Maximum drawdown: -10%.
Calmar ratio (Return/Drawdown): 8.2
Average gain per trade: $45
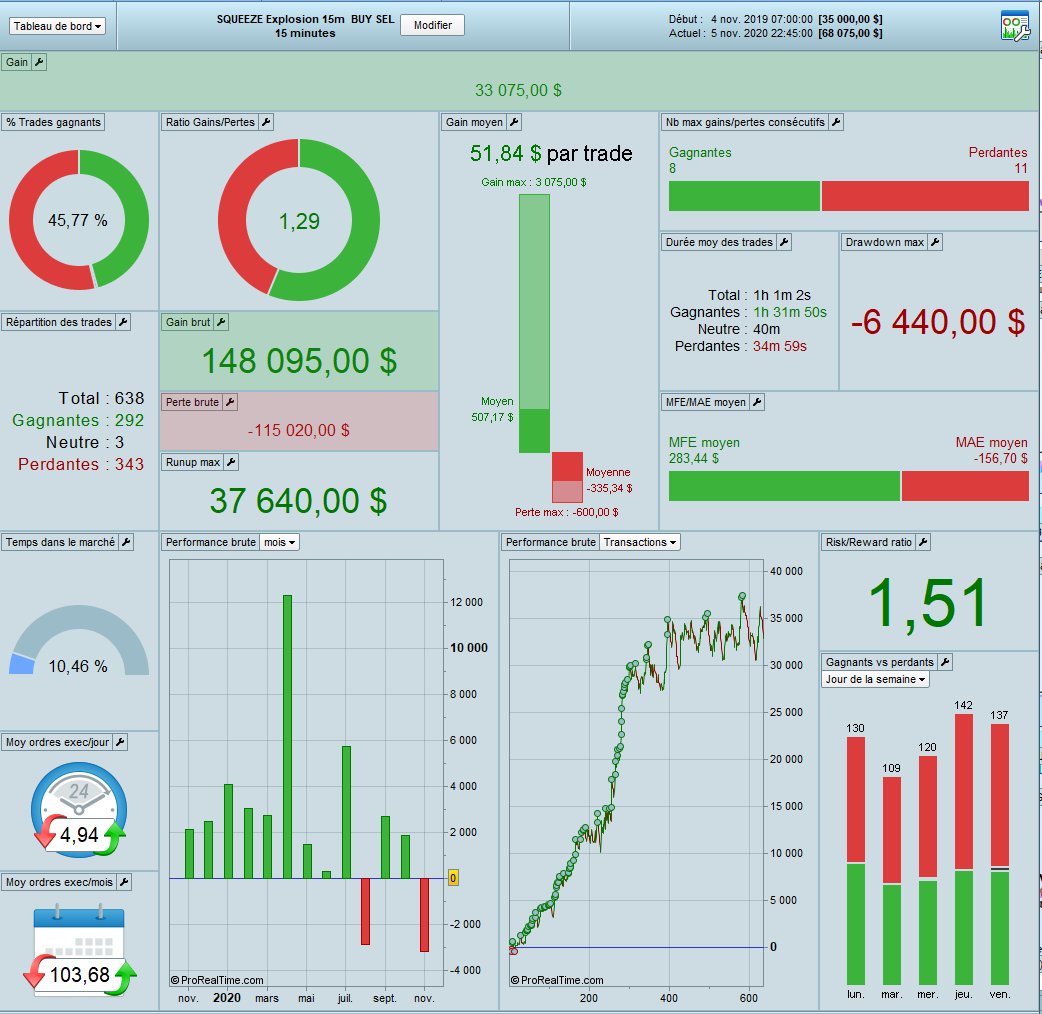
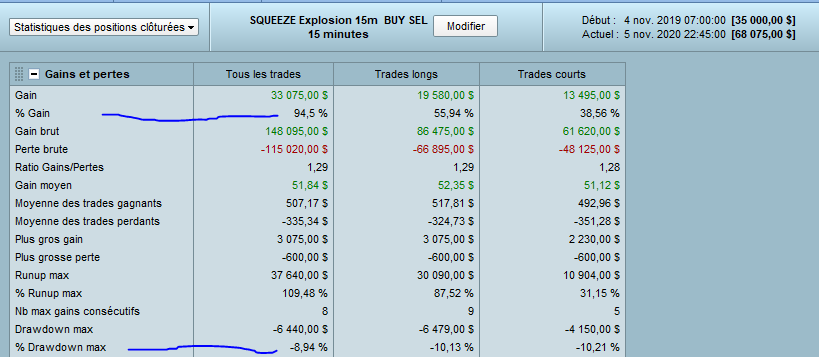
3. Intraday momentum strategy
Annual yield: +94%.
Maximum drawdown: -9.11%.
Calmar ratio (Return/Drawdown): 10.5
Average gain per trade: $50
These 3 robots have different criteria but I added a common criterion that I don’t usually use in manual trading: the SMA20 daily.
Is it considered as over-fitting to only look for purchases when you are above an MM20 daily and sales below as these 3 algo’s do?
The best way to know if it is over fitted is to examine values either side of 20 for the MA filter and then use something like Excel to plot charts of the results. This way you can see if you just got lucky with that value or if it is just a value in the middle of a broad range of values that work.
You can also do this on in sample and out of sample sections of data to further analyse whether the values work consistently over all data.
The second thing to do is to robustness test by shaking up the starting point and shaking up the bars you allow trades to open on to eliminate whether you just got lucky with your starting point and lucky that you already had a trade open which meant you missed a loser…. or even all the losers!
Congrats on the results and the work done. I see that most of your results are contained into the OOS periods which are all optimized to get the most profit of the bull run that start around April. Bear in mind that this type of market is not the norm and will not last beyond this year. In short, I think that there is a bias introduced by the current context in this extraordinary performance 😉
Thank you for your advice @Nicolas et @Vonasi
I hope I won’t make too many mistakes because English is not my natural language.
With no optimization, and setting the starting date at the beginning of January, we see that the robots had similar performance in terms of yield and drawdown, even during the crash of March.
I will do more testing on different timeframe and different assets.
And I will see how it behaves in live testing (with simulation account first). I will not use algos with a drawdown greater than 10% (eliminatory with most prop trading companies) and / or a squid ratio less than 3 (Paul Tudor Jones considers that a good trader must have a squid ratio greater than 2.5 and a drawdown whose duration between the 2 peaks (and not only between the trough and the peak) is less than 4 months.
The only optimization I had done was the SMA20 Daily.
As this is not a criteria I use in my manual trading, I tried the SMA 15/ 20/ 25 and 30.
In most cases it was the 20 or 30 that gave the best results. I chose the SMA20 which is more used by traders and is more likely to give robust strategies than an SMA30.
Too much optimization can generate nice equity curves in backtest / walk forward, but the actual results of data mining based strategies are in 99% of the cases disappointing.
I prefer not to do optimization if these are strategies I already use in manual trading. Why change something that works at the risk of creating a losing strategy?
For my new strategies I mainly optimize the triggers. I use python-coded genetic algorithms to choose the best entry, filter, exit and risk management triggers (keep only the strategies that look strongest and most robust with IS / OOS, walf forward analysis , Monte Carlo simulation, different departure date, different timeframe, different assets …)
I hope that with PRT we will soon be able to use genetic algorithms and
Monte Carlo simulations. 😉
Nice, that seems great. Now you have to adapt the strategies in order to perform as good with CFD instruments and to be able to trade them automatically with ProOrder, did you try?
I have also tested on other assets and other TFs.
Here are 3 results on a bond future (Bund), a commodity future (oil) and a cryptocurrency future (Bitcoin).
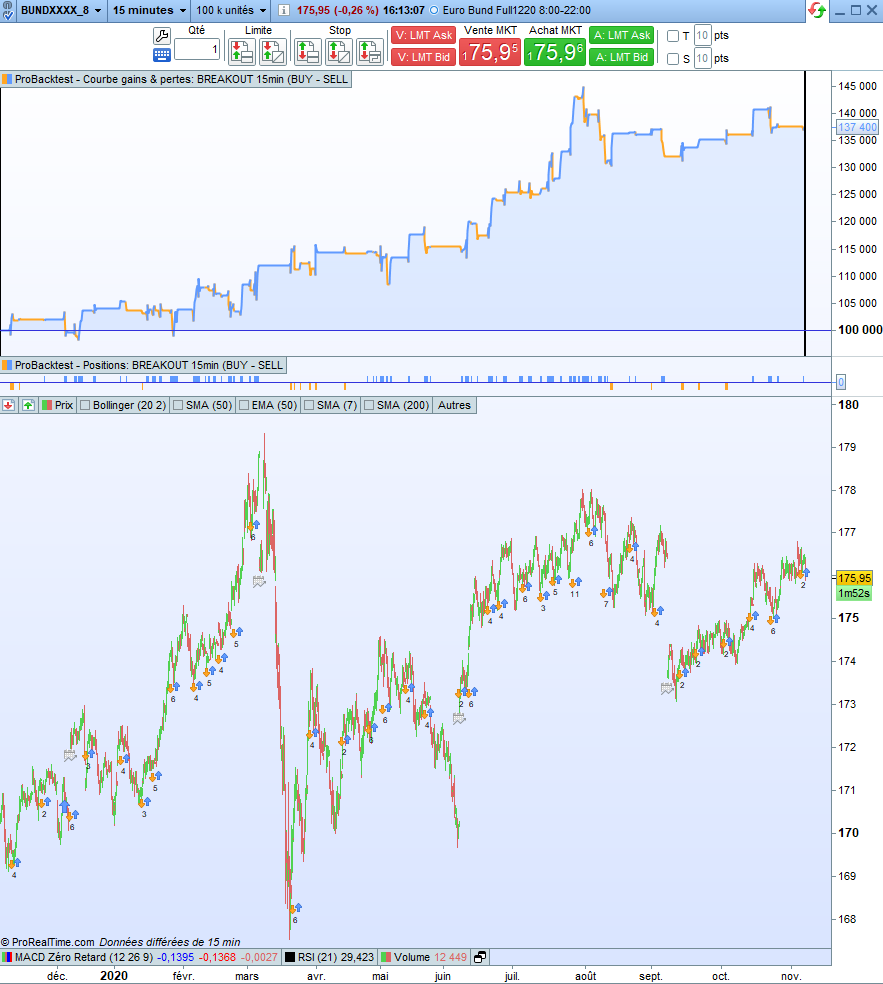
1. The Bund with the 15min Timeframe breakout strategy is + 37% in 1 year when its benchmark is + 3%. The equity curve is not subject to the erratic fluctuations of the benchmark prices.
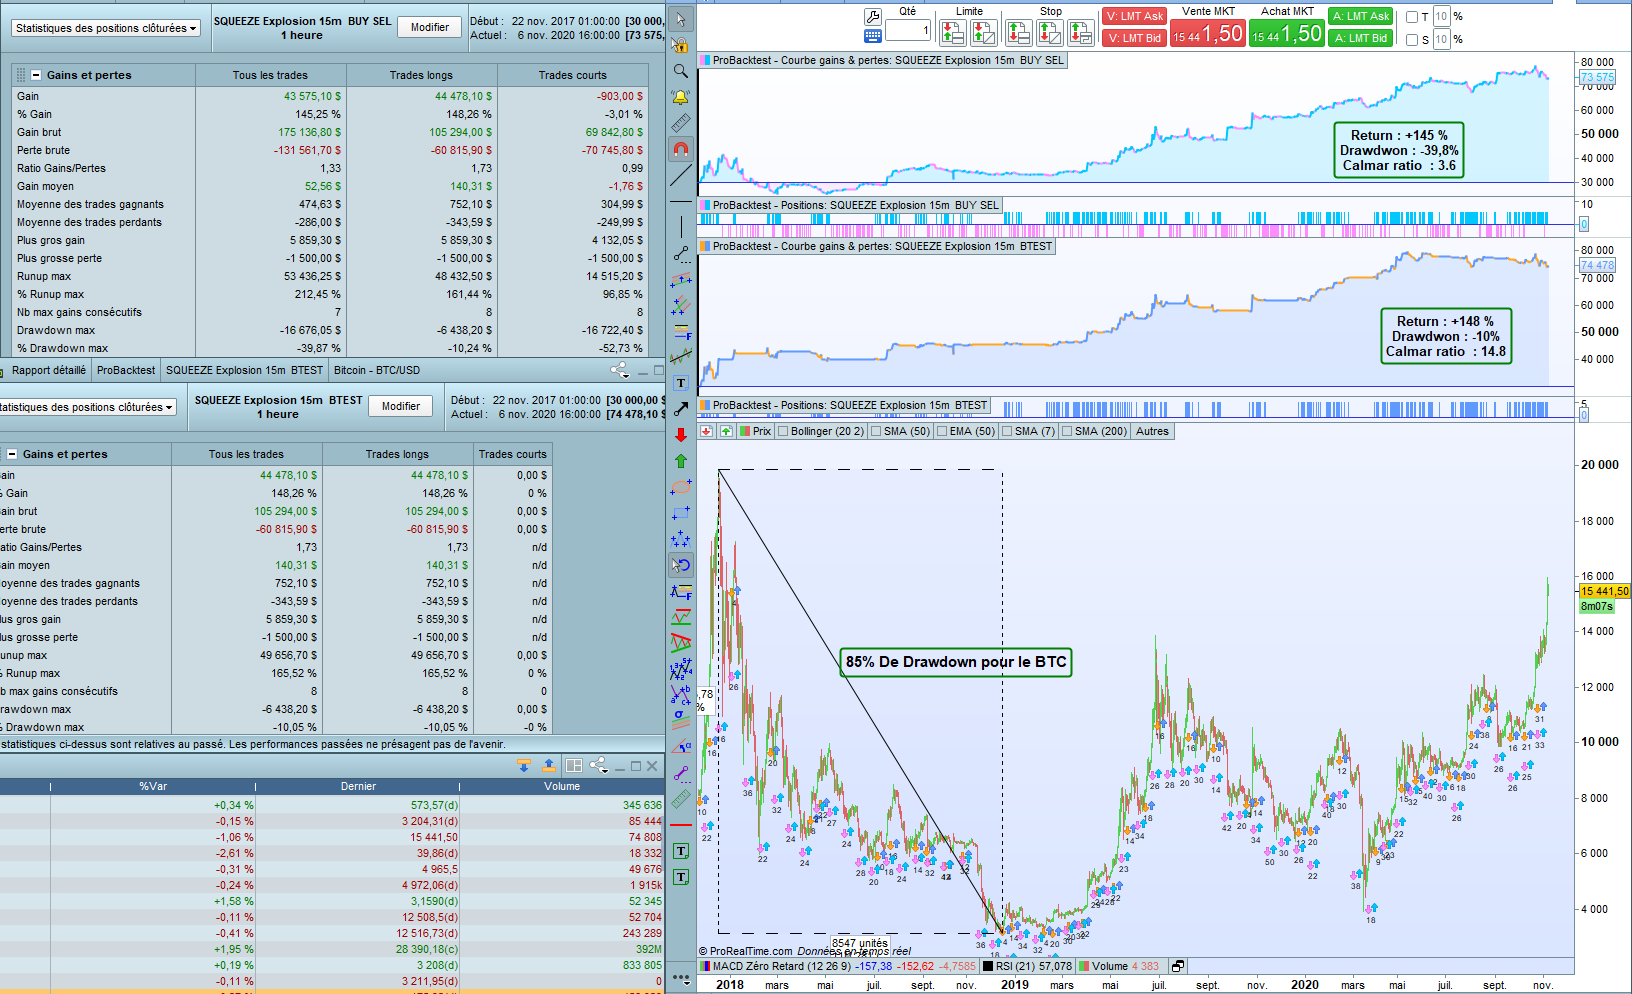
2. Bitcoin with an H1 squeeze strategy makes + 145% return with -40% drawdown. Using the strategy that for purchases we get a return of +148 with a drawdown of only -10% (Calmar ratio of 145). During this period Bitcoin experienced a drawdown of 84%
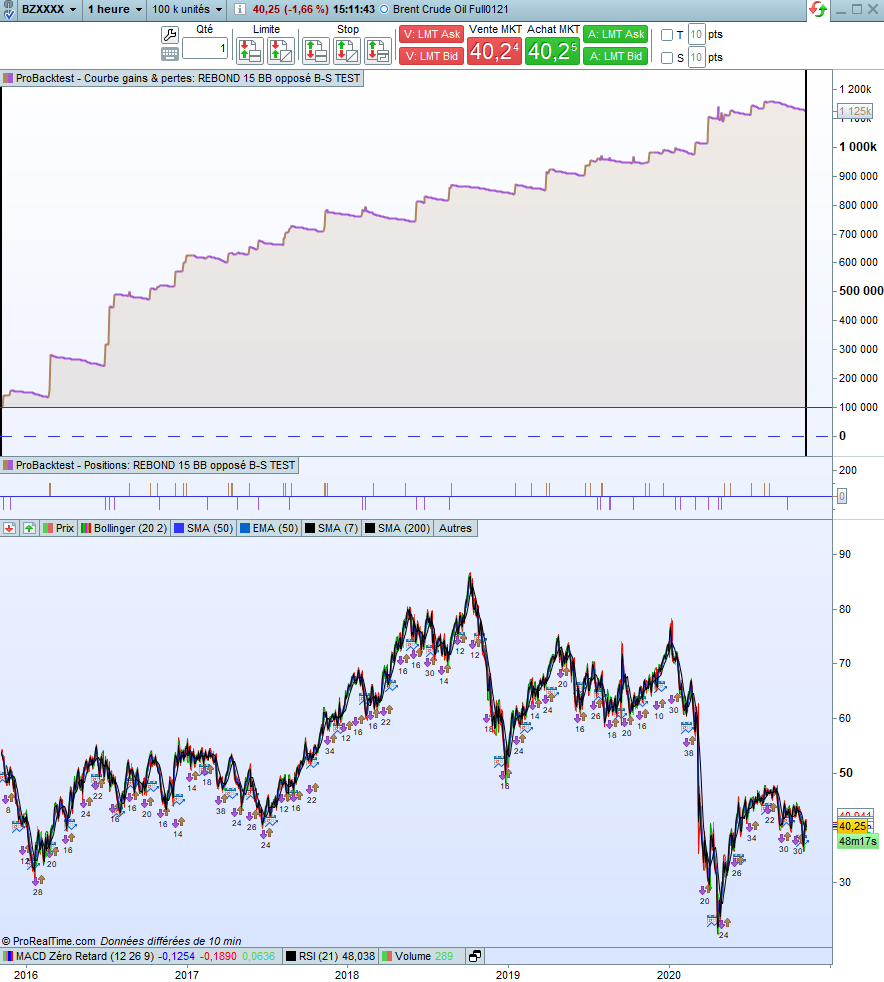
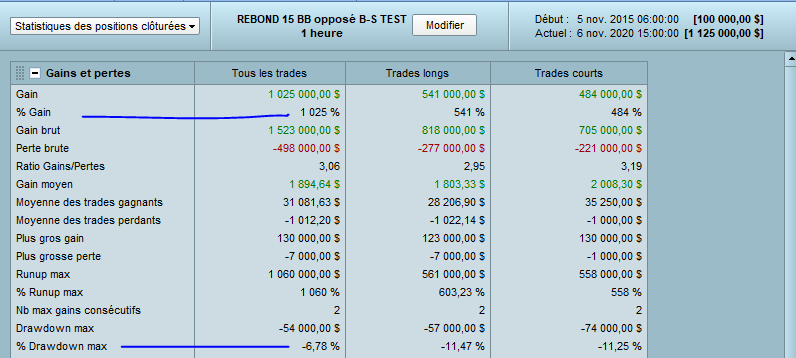
3. Oil with the mean reversing strategy (modified) is + 1025% with a drawdown of 14% (the PRT report notes -6.78% of Drawdown but on the graph we see that the DD is 14%)
The Calmar ratio is 73!!
These results were achieved with an average risk of 1% per trade.
For the mean reversion on oil, I modified a trigger in the strategy that generates frequent small losses and very large gains.
@Nicolas It’s still early as I launched the first simulation tests for these algos only on Wednesday.
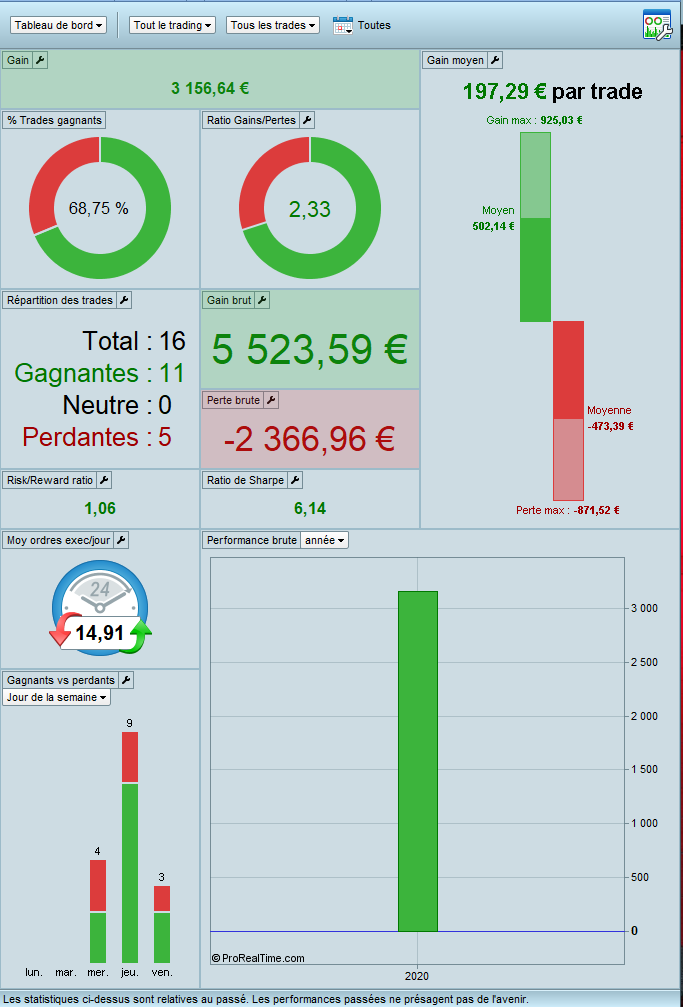
So far the results on 16 trades are :
Gain: + 3156$ (1052$/day)
Winrate: 68.7% (11 winners and 5 losers).
Sharpe Ratio 6.14
Payoff Ratio 2.33
Risk reward ratio 1.06
Average gain per trade: +197$.
Average duration of winning trades: 45min
Average duration of losing trades: 34min
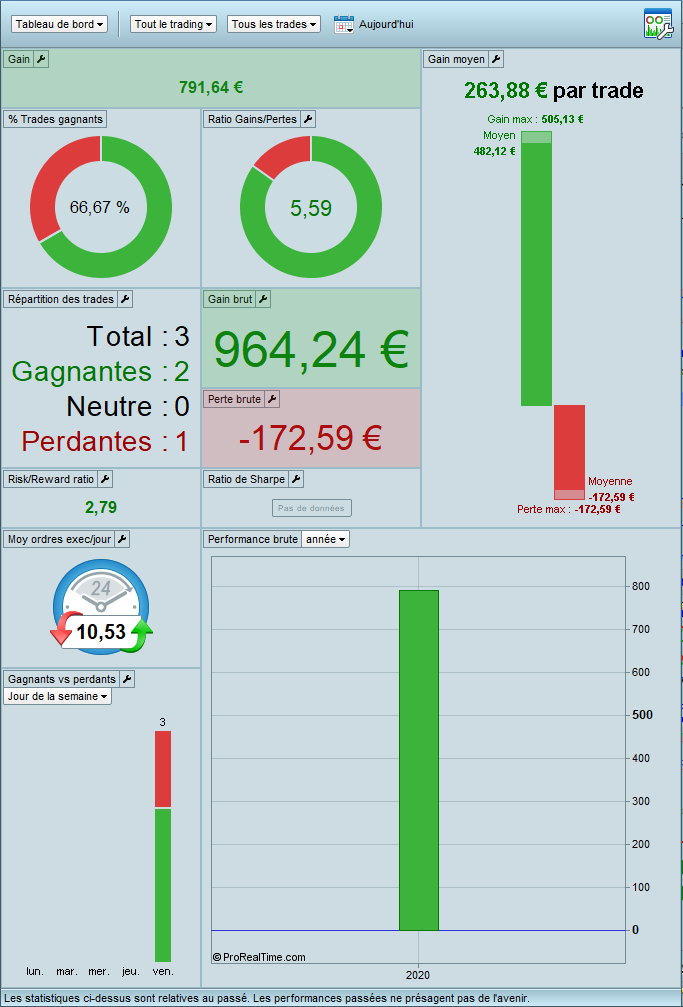
Today at 5:30pm (Paris time) the robots generated 3 trades, 2 winners and 1 loser for $791 of profit with a payoff ratio of 5.59 ($964 of profit for $172 of loss).