


Stochastic Reverse Engenering

Viewing 2 posts - 1 through 2 (of 2 total)
  • Author
    Posts
  • #240756 quote
    teshmi9zteshmi9z
    Participant
    New

    bonjour, j’ai fais un code avec chat gpt qui marche sur TW pour afficher la STO en reverse engenering
    le voici

    //@version=5
    indicator(“Stochastic Reverse Engineering (K=200, D=200)”, overlay = true)
    // Inputs
    k_period = 200  // Période de %K fixée à 200
    d_period = 200  // Période de %D fixée à 200
    smoothK = input(3, title=”Smooth K”)
    // Calcul du Stochastique %K
    lowestLow = ta.lowest(low, k_period)
    highestHigh = ta.highest(high, k_period)
    k = 100 * (close – lowestLow) / (highestHigh – lowestLow)
    // Lisser %K
    smoothedK = ta.sma(k, smoothK)
    // Calcul du %D
    d = ta.sma(smoothedK, d_period)
    // Normaliser %K et %D pour les rendre visibles sur le graphique des prix
    k_normalized = (smoothedK / 100) * (highestHigh – lowestLow) + lowestLow
    d_normalized = (d / 100) * (highestHigh – lowestLow) + lowestLow
    // Tracer les lignes %K et %D sur le graphique des prix
    plot(d_normalized, title=”%D (200)”, color=color.orange, linewidth=2)

    j’ai essayé une conversion mais impossible au niveau du calcul de K, je ne comprend pas pourquoi il parle de nombre entier.
    Si vous avez une solution?

    // Paramètres
    kp = 200  // Période de %K fixée à 200
    dp = 200  // Période de %D fixée à 200
    smoothK = 3  // Lissage de %K
    
    // Calcul du Stochastique %K
    lowestLow = lowest[kp](low)
    highestHigh = highest[kp](high)
    k = 100 * (close - lowestLow) / (highestHigh - lowestLow)
    
    // Lissage de %K
    smoothedK = average[k](smoothK)
    
    // Calcul du %D
    d = average[smoothedK](dp)
    
    // Normalisation de %K et %D pour les afficher sur le graphique des prix
    knormalized = (smoothedK / 100) * (highestHigh - lowestLow) + lowestLow
    dnormalized = (d / 100) * (highestHigh - lowestLow) + lowestLow
    
    // Tracer %D sur le graphique des prix
    RETURN dnormalized AS "%D (200)" COLOURED(255,165,0)


    #240758 quote
    teshmi9zteshmi9z
    Participant
    New

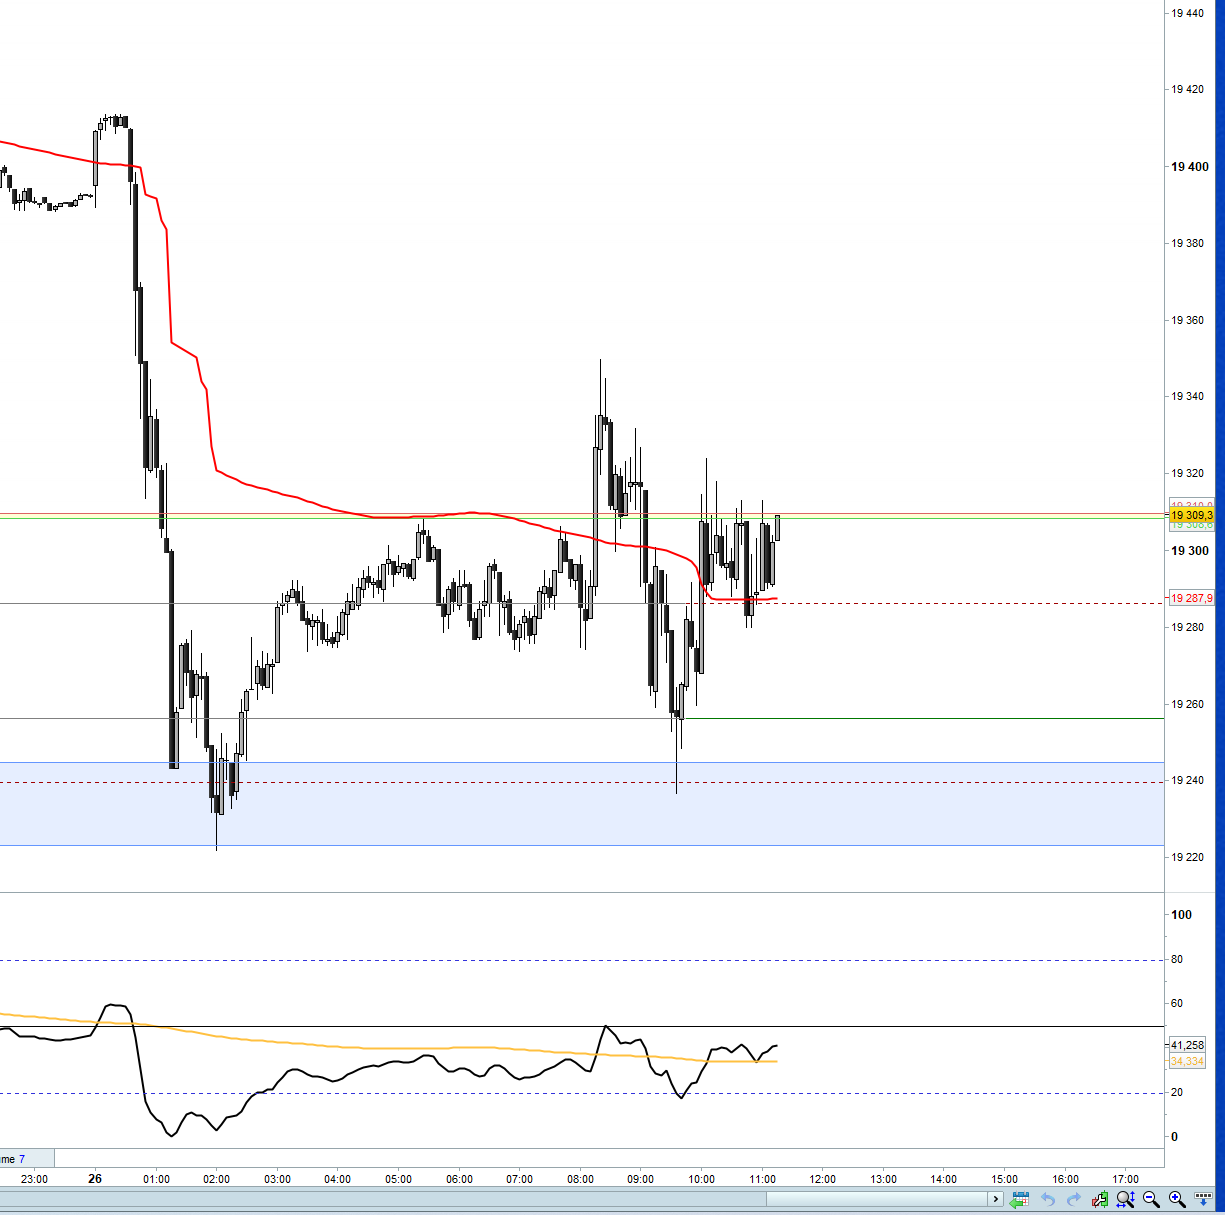
    je vien  de reussir
    le voici pour vous

    // --- settings
    KPeriod = 200
    Slowing = 3
    DPeriod = 200
    
    stochValue = Stochastic[Kperiod,Slowing](close)
    signalValue = average[Dperiod](stochValue)
    //----
    
    haut=highest[KPeriod](high)
    bas=lowest[KPeriod](low)
    sto=(signalValue /100)*(haut-bas)+bas


    return   sto coloured(255,0,0) style(line,2) as "Signal line"
    Iván González and RicLg thanked this post
    Capture-decran-2024-11-26-111618.png Capture-decran-2024-11-26-111618.png
Viewing 2 posts - 1 through 2 (of 2 total)
  • You must be logged in to reply to this topic.

ProRealAI ProRealAI New

Stuck on this ProBuilder code?

Describe what this topic is trying to build, in plain English, and ProRealAI writes the ProRealTime™ indicator, screener or system for you.

Available in 7 languages
Try ProRealAI

Stochastic Reverse Engenering


ProBuilder : Indicateurs & Outils Personnalisés

New Reply
Author
author-avatar
teshmi9z @teshmi9z Participant
Summary

This topic contains 1 reply,
has 1 voice, and was last updated by teshmi9zteshmi9z

1 year, 9 months ago.

Topic Details
Forum: ProBuilder : Indicateurs & Outils Personnalisés
Language: French
Started: 11/26/2024
Status: Active
Attachments: 1 files
ProRealCode ProRealCode
Loading...

