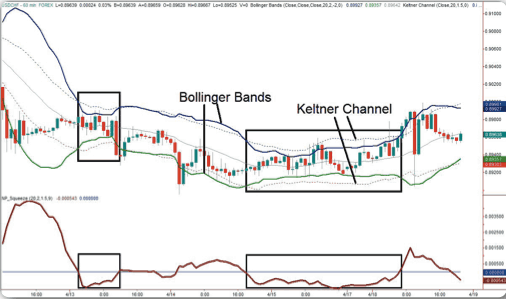
Squeeze Trading Indicator
from https://www.netpicks.com/squeeze-out-the-chop/
The basic formulas we need are:
Bollinger Band = Moving Average + (Number of standard deviations X Standard Deviation)
Keltner Channel = Moving Average + (Number of ATR’s X ATR)
Or if we translate this into pseudo-code:
BBUpper = Avg(close,period) + (BBDevs X StdDev(close,period))
KCUpper = Avg(close,period) + (KCDevs X ATR(period))
The squeeze is calculated by taking the difference between these two values:
Squeeze = BBUpper – KCUpper
Which simplifies down to this:
Squeeze = (BBDevs X StdDev(close,period)) – (KCDevs X ATR(period))
- Hello Nicholas sorry for the mix-up sending it to the wrong place hopefully there’s enough information i’ve linked the web page that it’s from and also sticking a picture I can make a basic version of this but it would not use the standard deviation or the ATR so I’d like to see this version with that in it and then test that out, thank you.
- Patrick
Moderators edit: Post edited to remove text from inserted code. Please only insert actual code when using the ‘Insert PRT Code’ button.
Hello robertogozzi
Does the screener show up on the charts as an indicator because I’m doing a lot of backtesting and I use the simplified creation tool for backtesting so it helps a lot to have it on the chart thank you
Patrick
This is the one at https://www.prorealcode.com/prorealtime-market-screeners/intraday-volatility-explosion-screener/ (it returns explosions, you can set it as a histogram):
//********* Parameters *********
//Keltner channel
n=20
coeff=1.5
//Bollinger Bands
period=10
deviation=1
//Candles lookback
xCandles=4
//******************************
//keltner bands
MA = Average[N](TypicalPrice)
UpperBand = MA + coeff*Average[N](Range)
LowerBand = MA - coeff*Average[N](Range)
//bollinger bands
BBmiddle = average[period](close)
dev = std[period](close)
BBup = BBmiddle+dev*deviation
BBdown = BBmiddle-dev*deviation
count = 0
for i = 1 to xCandles do
   c1 = BBup[i]<UpperBand[i]
   c2 = BBdown[i]>LowerBand[i]
   if c1 and c2 then
      count = count+1
   endif
next
validate = count=xCandles
bullishexplosion = BBup>UpperBand
bearishexplosion = BBdown<LowerBand
Result = 0
IF validate AND bullishexplosion THEN
   Result = 1
ELSIF validate AND bearishexplosion THEN
   Result = -1
ENDIF
RETURN Result
That indicated that you shared me is only a breakout indicator can you change it into a zero line Cross please
I have only a very basic understanding of coding I’ve watched quite a few videos, if I Could code it myself I would, zero line cross indicator version might be more beneficial
Thank you
Patrick
What do you mean by zero line?
BB & KC do not have 0.
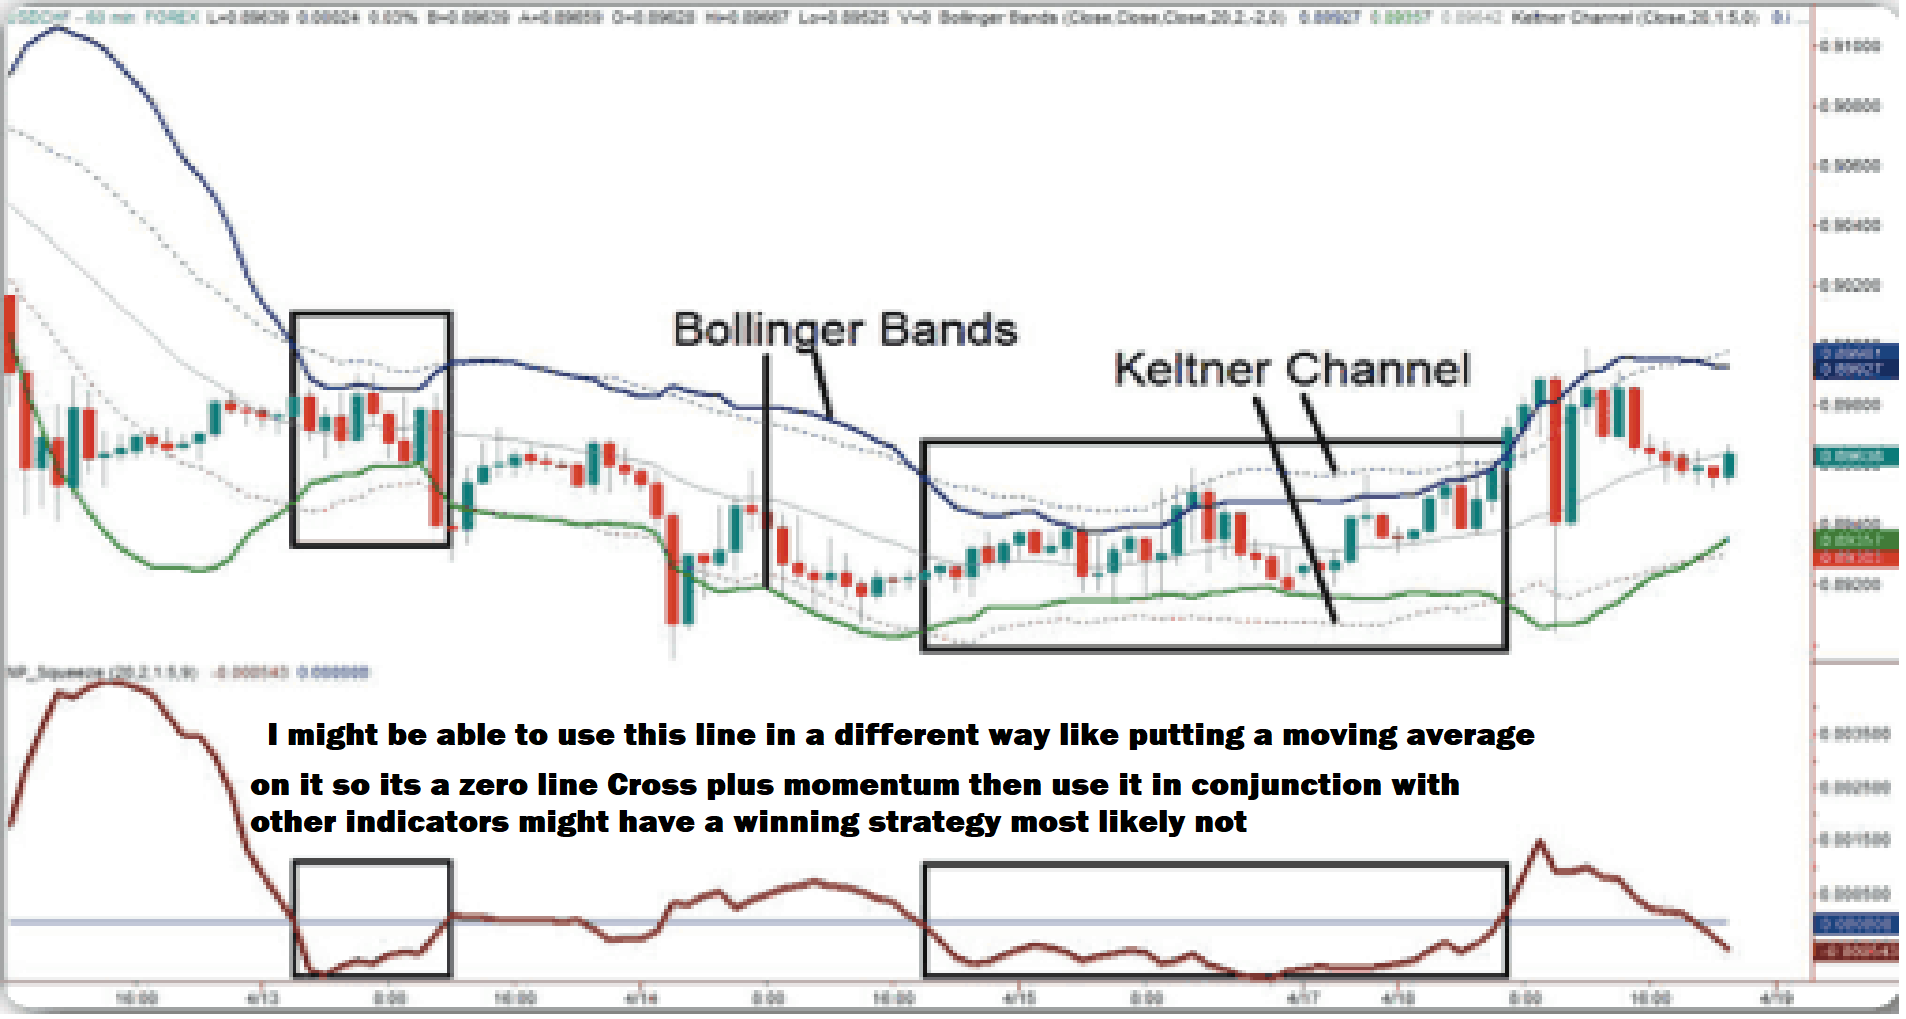
I might be able to use this line in a different way like putting a moving average on it so its a zero line Cross plus momentum then use it in conjunction with other indicators might have a winning strategy most likely not
Yes you’re right the Bollinger bands and keltner channels do not but the indicator based on them that I would like you to build would,
just to clarify rate of Change would be a zero line cross.
thank you
Patrick
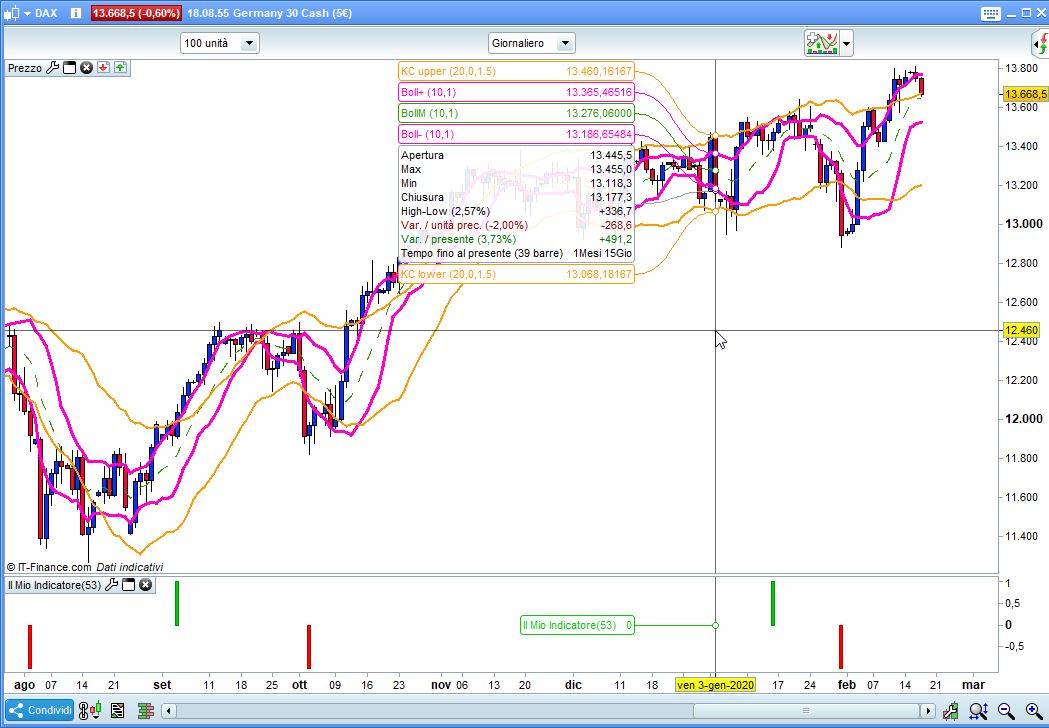
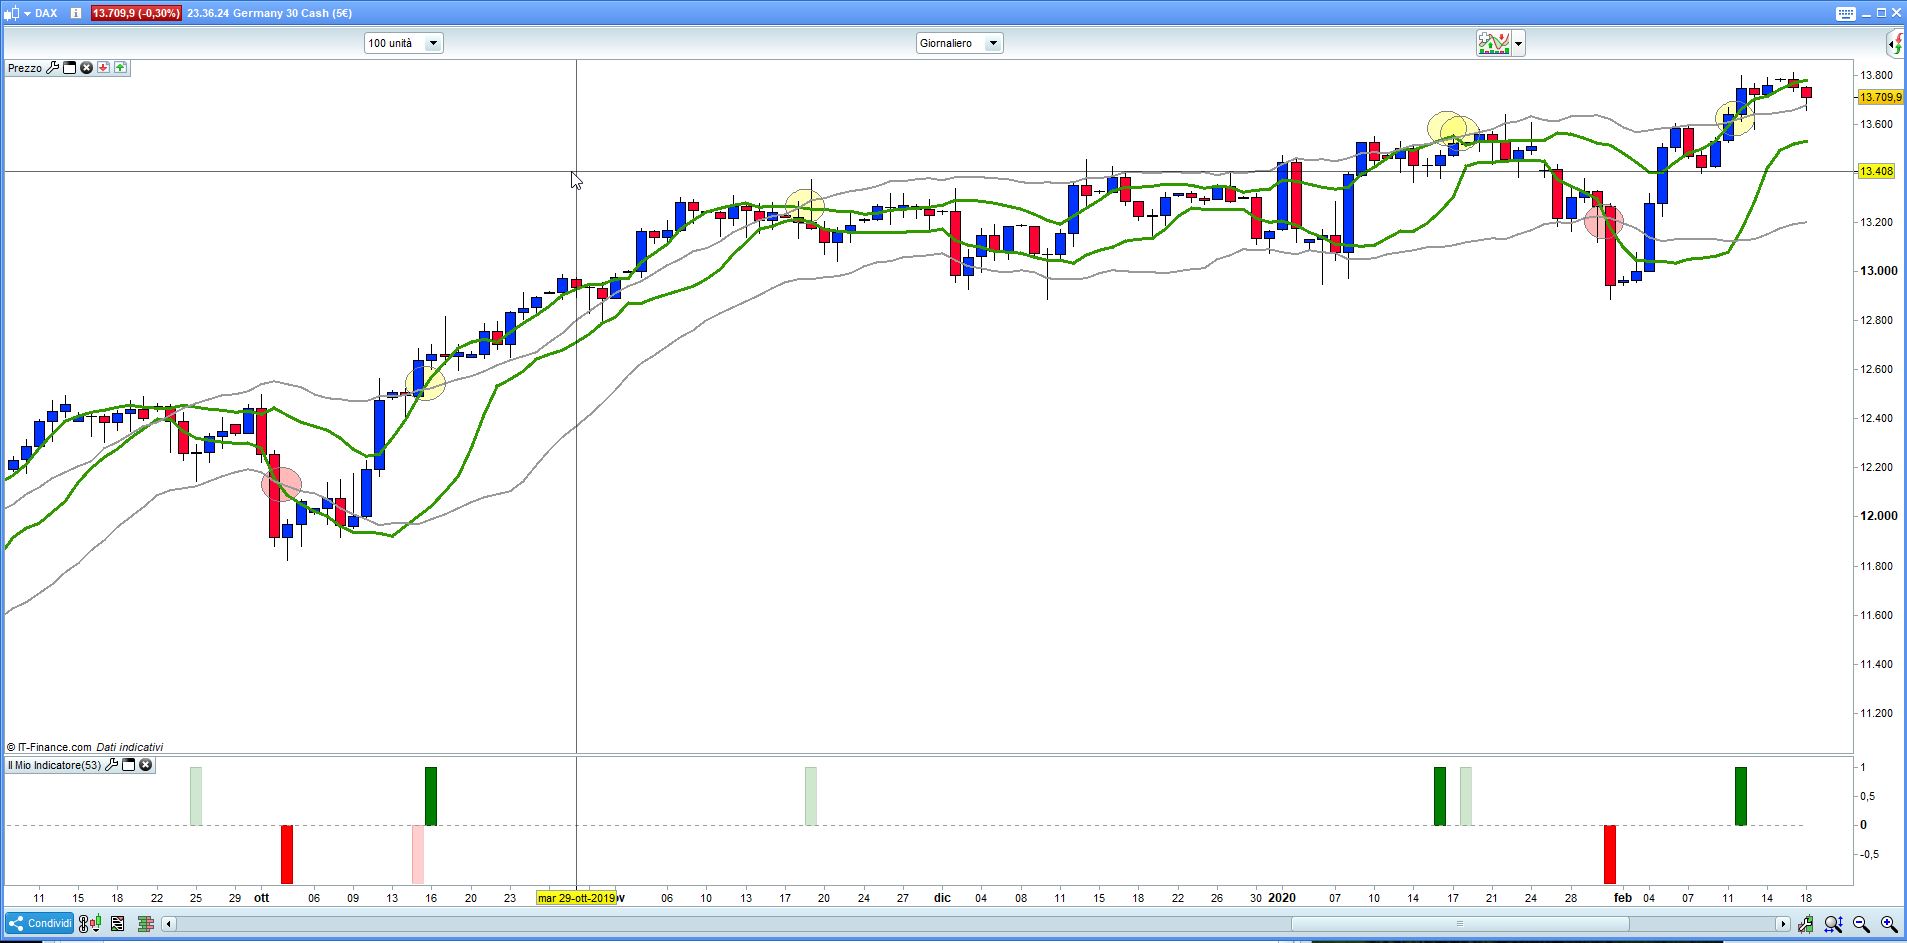
Ok, I changed so that it returns all crossings with different colours:
- bullish explosion: plain GREEN (returns 1)
- bullish implosion: light GREEN (returns 1)
- bearish explosion: plain RED (returns -1)
- bearish implosion: ligtht RED (pink) (returns -1)
The attached pic shows all possible crossings of the Bollinger Bands over/under the Keltner Channel.
//********* Parameters *********
//Keltner channel
n          = 20
coeff      = 1.5
//Bollinger Bands
period     = 10
deviation  = 1
//Candles lookback
//xCandles = 4
t          = 255
r          = 0
g          = 128
b          = 0
validate   = 1
//----------------------------------------------------
//keltner bands
MA         = Average[N](TypicalPrice)
UpperBand  = MA + coeff*Average[N](Range)
LowerBand  = MA - coeff*Average[N](Range)
//----------------------------------------------------
//bollinger bands
BBmiddle   = average[period](close)
dev        = std[period](close)
BBup       = BBmiddle+dev*deviation
BBdown     = BBmiddle-dev*deviation
//----------------------------------------------------
// Explosion (expansion)
//count = 0
//for i = 1 to xCandles do
//c1 = BBup[i]<UpperBand[i]
//c2 = BBdown[i]>LowerBand[i]
//if c1 and c2 then
//count = count+1
//endif
//next
//validate = count=xCandles
bullishexplosion = BBup   crosses over  UpperBand
bearishexplosion = BBdown crosses under LowerBand
//----------------------------------------------------
// Implosion (contraction)
//count = 0
//for i = 1 to xCandles do
//c1 = BBup[i]<UpperBand[i]
//c2 = BBdown[i]>LowerBand[i]
//if c1 and c2 then
//count = count+1
//endif
//next
//validate = count=xCandles
bullishimplosion = BBup   Crosses under UpperBand
bearishimplosion = BBdown crosses over  LowerBand
//----------------------------------------------------
Result = 0
IF validate THEN
   IF bullishexplosion OR bullishimplosion THEN
      Result = 1
      IF bullishimplosion THEN
         t = 48
      ENDIF
   ELSIF bearishexplosion OR bearishimplosion THEN
      Result = -1
      r      = 255
      g      = 0
      IF bearishimplosion THEN
         t = 48
      ENDIF
   ENDIF
ENDIF
RETURN Result coloured(r,g,b,t) AS "Result",0 AS "Zero"
Roberto
you won’t believe this I don’t really believe this but I think I’ve done it even so I still would like to thank you for helping
It’s not 100% because it only incorporates the upper Bollinger band and the upper keltner channel which doesn’t give you 100% Reading somehow how I need to factor in in the lower band and the lower channel into the equation but I don’t know how to do that
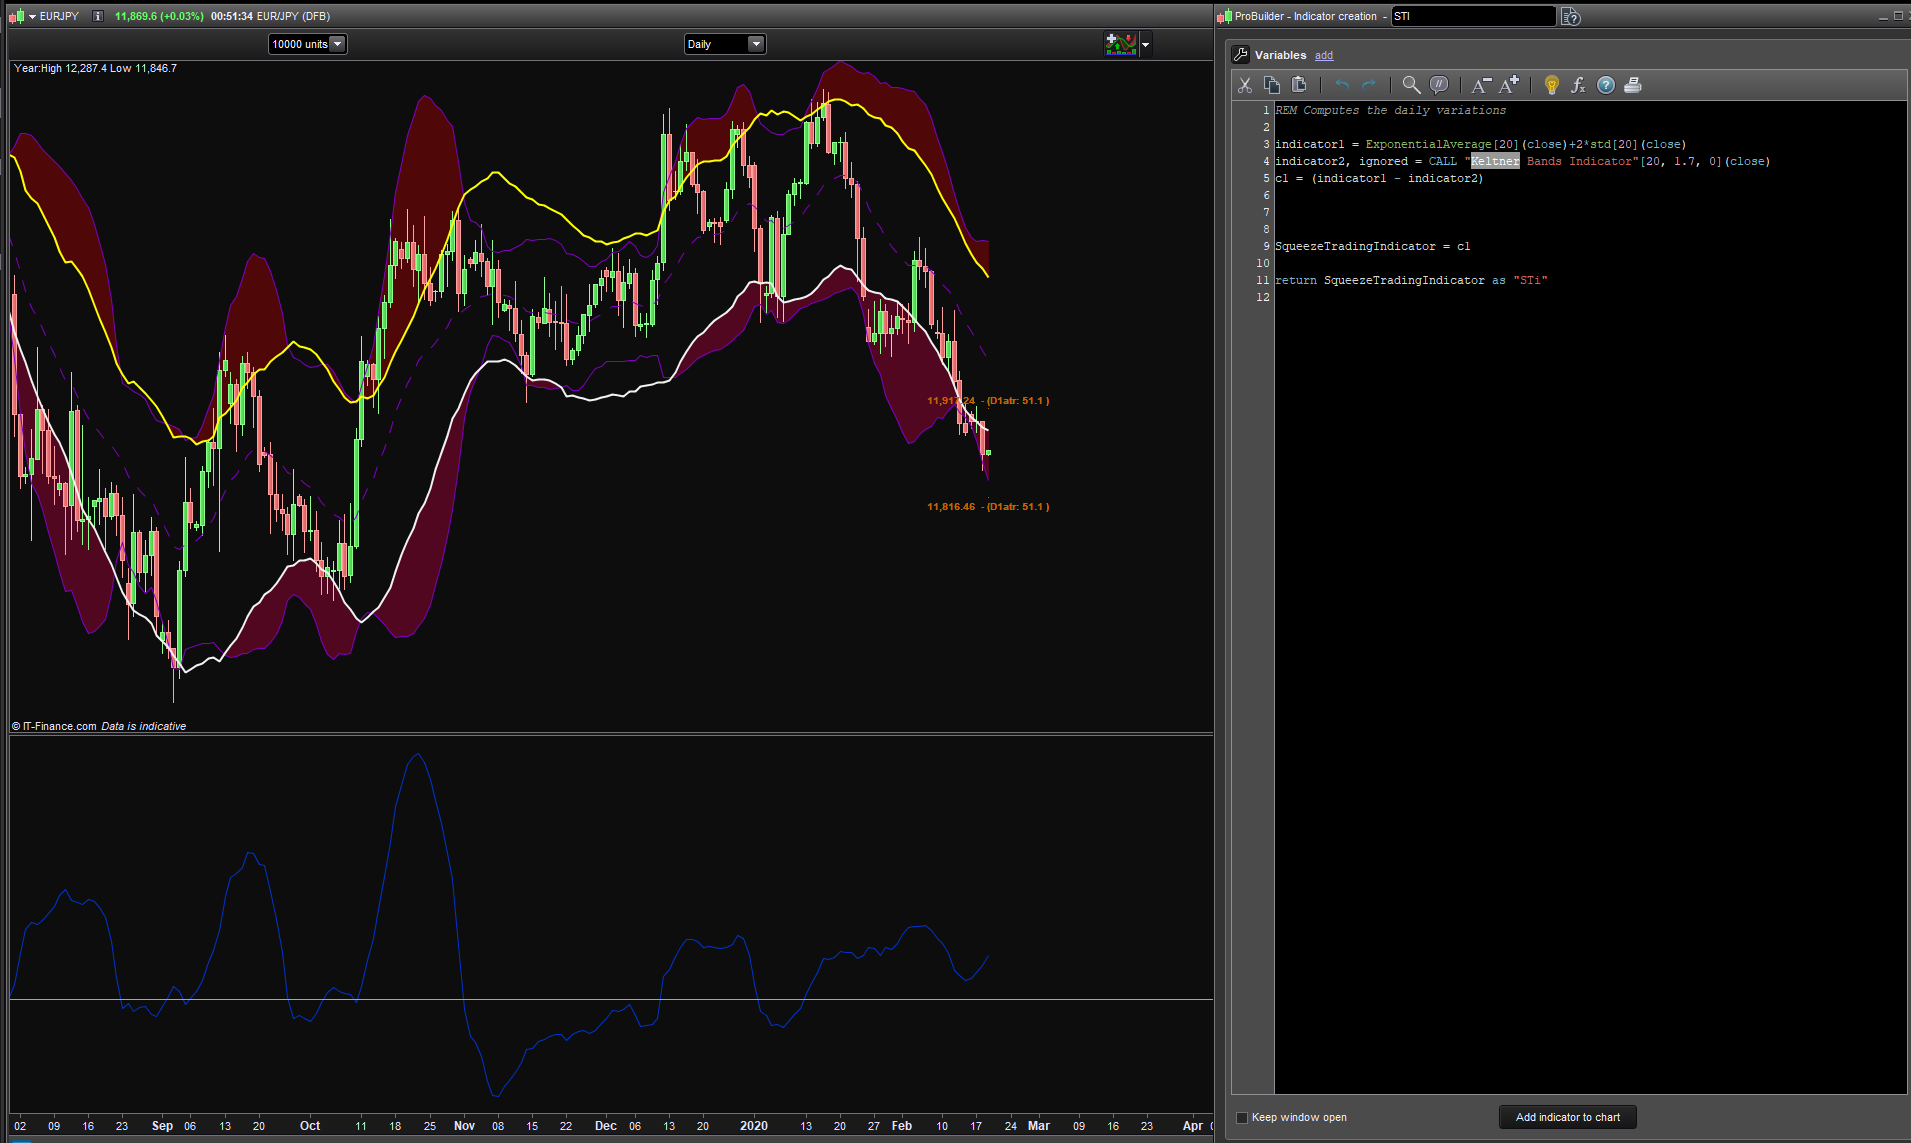
Here’s what I have done
REM Computes the daily variations

indicator1 = ExponentialAverage[20](close)+2*std[20](close)
indicator2, ignored = CALL "Keltner Bands Indicator"[20, 1.7, 0](close)
c1 = (indicator1 - indicator2)

Squeeze Trading Indicator = c1

return Squeeze Trading Indicator as "STi"
The other one might be better
indicator1 = ExponentialAverage[20](close)+2*std[20](close)
indicator2, ignored = CALL "Keltner Bands Indicator"[20, 1.7, 0](close)
c1 = (indicator1 - indicator2)

indicator3 = ExponentialAverage[20](close)-2*std[20](close)
ignored, indicator4 = CALL "Keltner Bands Indicator"[20, 1.7, 0](close)
c2 = (indicator3 - indicator4)


SqueezeTradingIndicator = c1+c2/2

return SqueezeTradingIndicator as "SqueezeTradingIndicator"0 as "0 level"
Thank you again
Patrick
You don’t need to call the indicator twice so the code can be simplified a little further. Also you forgot a comma in your return line.
Please always use the ‘Insert PRT Code’ button when posting code. I tidied up your first code that you posted. 🙂
indicator1 = ExponentialAverage[20](close)+2*std[20](close)
indicator3 = ExponentialAverage[20](close)-2*std[20](close)
indicator2, indicator4 = CALL "Keltner Bands Indicator"[20, 1.7, 0](close)

c1 = (indicator1 - indicator2)
c2 = (indicator3 - indicator4)

SqueezeTradingIndicator = c1+c2/2

return SqueezeTradingIndicator as "SqueezeTradingIndicator",0 as "0 level"