Spiegazione di un indicatore

Viewing 2 posts - 1 through 2 (of 2 total)
  • Author
    Posts
  • #225291 quote
    Ciccarelli FrancoCiccarelli Franco
    Participant
    Senior

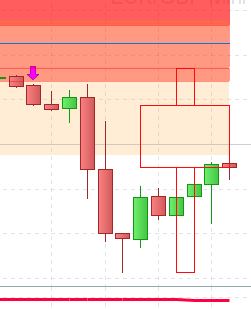
    Vorrei chiedere la spiegazione sulla forma della candela nell’indicatore Daily Candlestick.

    Grazie

    Allego foto

    Cattura.jpg Cattura.jpg
    #225316 quote
    luxrunluxrun
    Participant
    Master

    Non conosco l’indicatore, ma è abbastanza intuitivo il calcolo. Se consideri un timeframe orario con giornata di borsa, mettiamo di 8 ore, hai otto candele orarie. Il min e il max sono rispettivamente il minimo delle otto candele e il massimo delle otto considerate. L’open è quello a inizio giornata battuto dalla borsa e il close è l’ultimo valore battuto, considerato come close. Se l’open è minore del close hai una candela verde rialzista, al contrario hai una candela rossa.

    robertogozzi thanked this post
Viewing 2 posts - 1 through 2 (of 2 total)
  • You must be logged in to reply to this topic.

ProRealAI ProRealAI New

Stuck on this ProBuilder code?

Describe what this topic is trying to build, in plain English, and ProRealAI writes the ProRealTime™ indicator, screener or system for you.

Available in 7 languages
Try ProRealAI

Spiegazione di un indicatore


ProBuilder: Indicatori & Strumenti Personalizzati

New Reply
Summary

This topic contains 1 reply,
has 2 voices, and was last updated by luxrunluxrun

2 years, 9 months ago.

Topic Details
Forum: ProBuilder: Indicatori & Strumenti Personalizzati
Language: Italian
Started: 12/15/2023
Status: Active
Attachments: 1 files
ProRealCode ProRealCode
Loading...