Hello, Happy New Year!
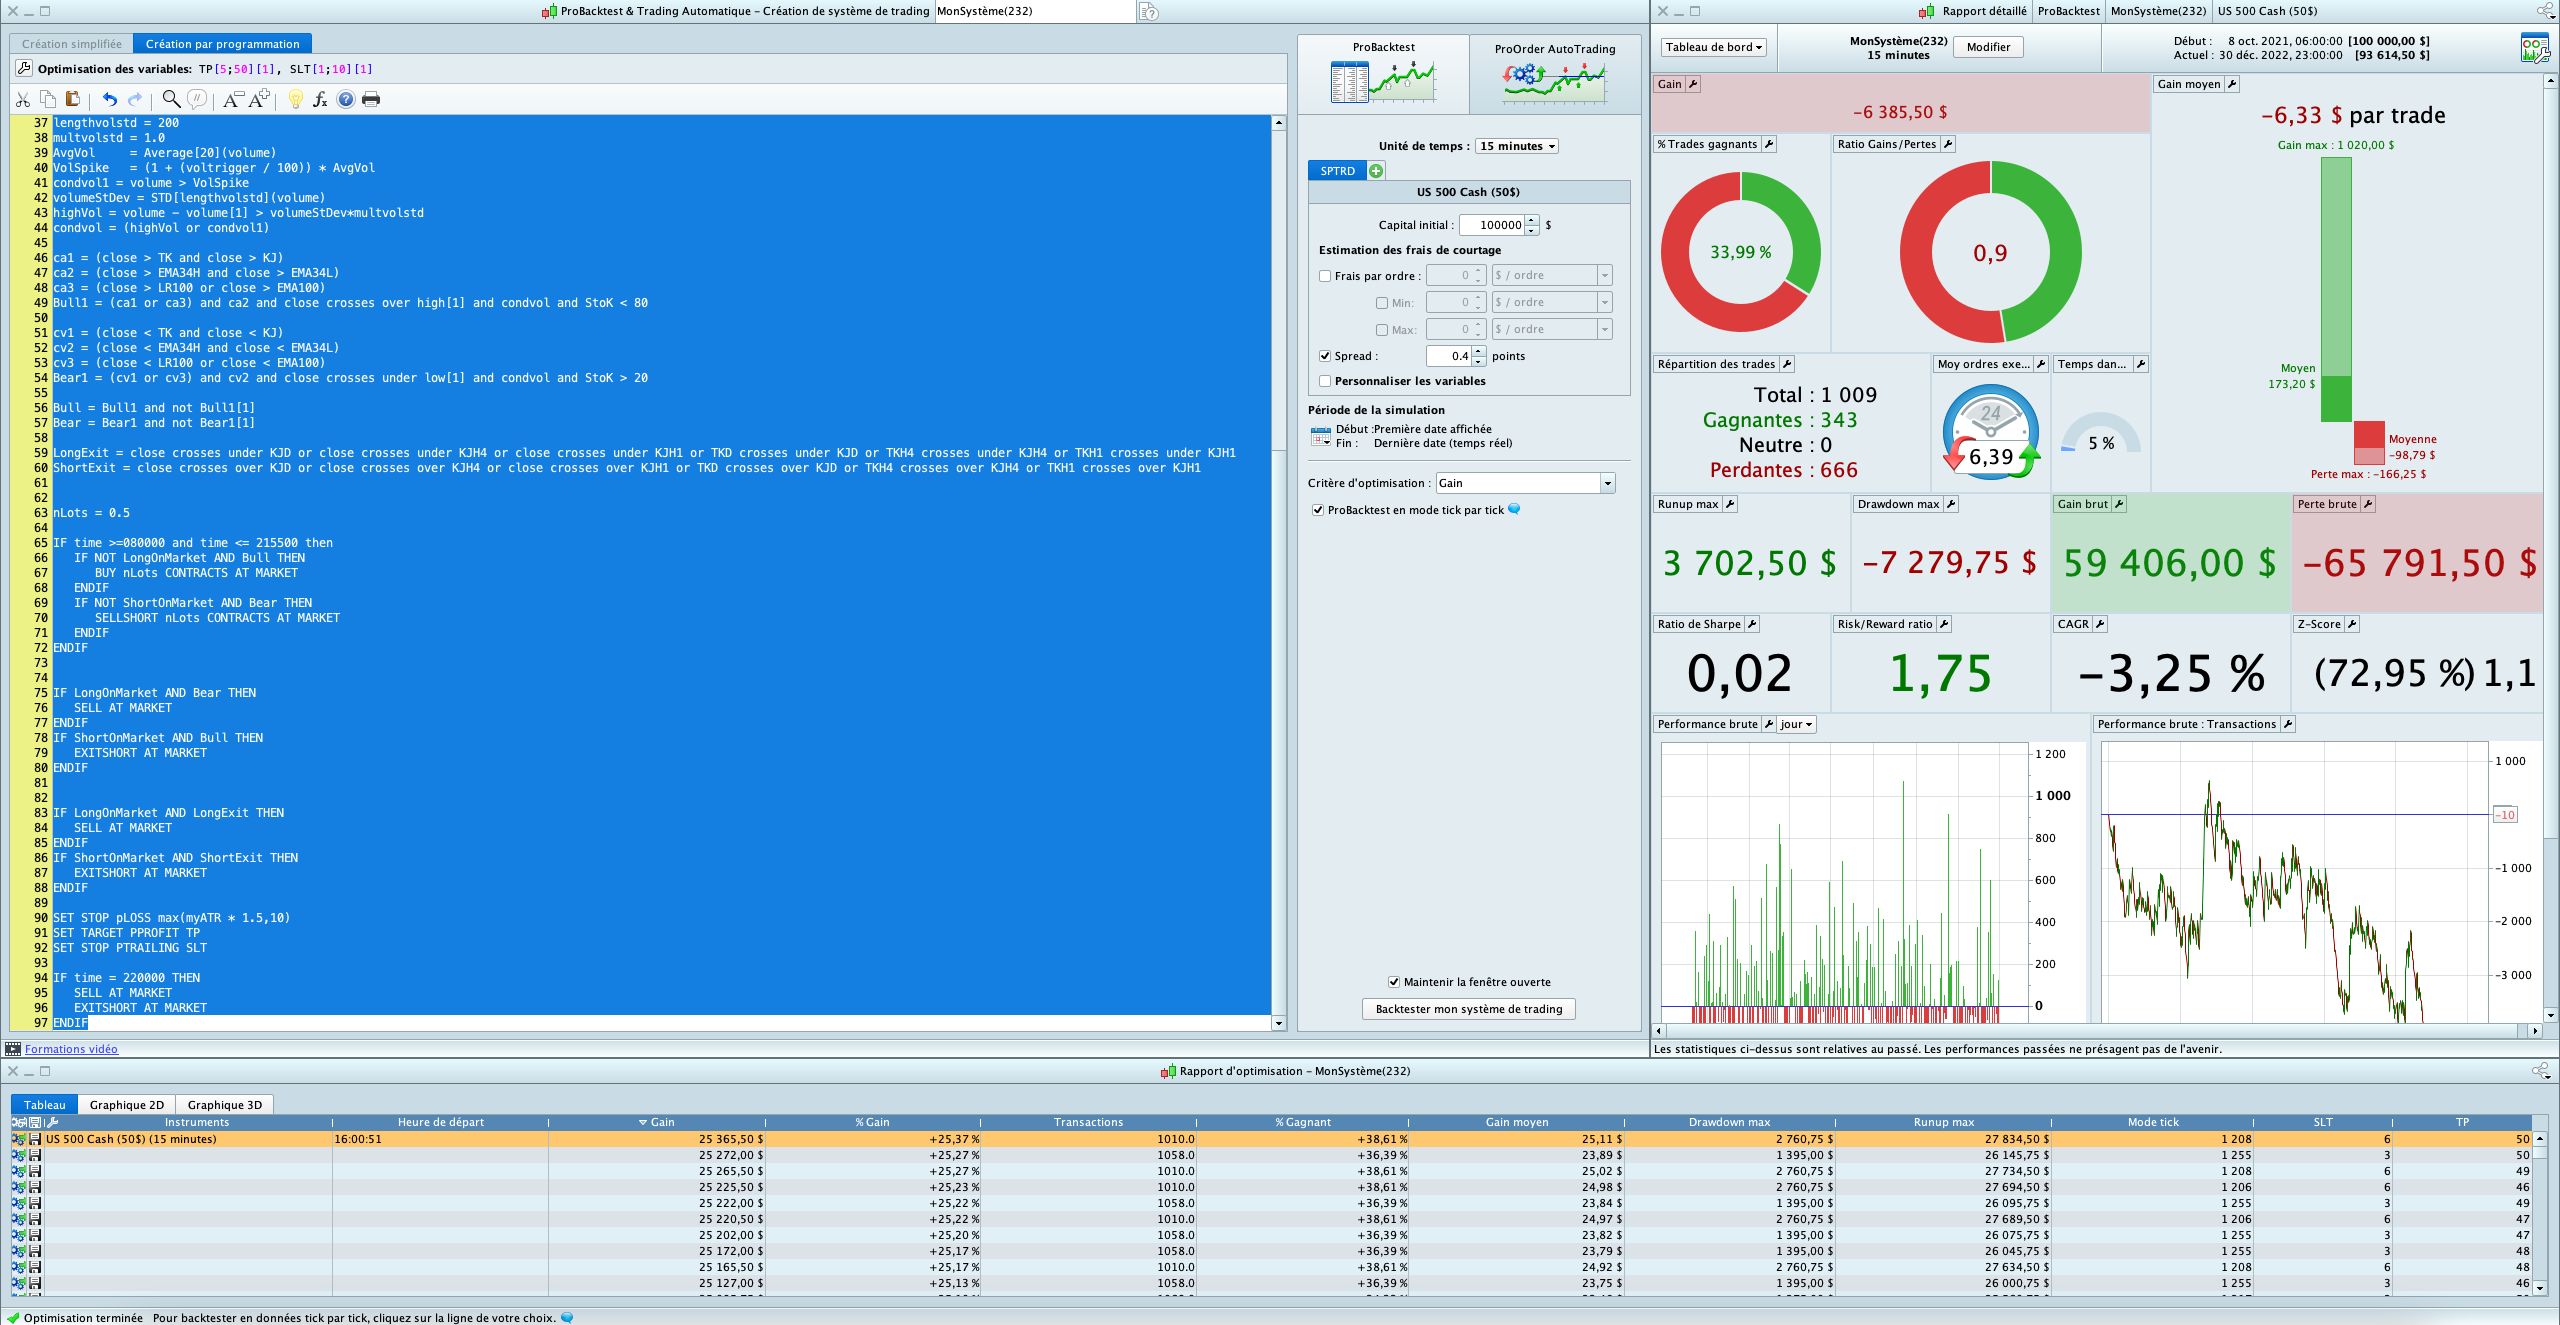
I have put together the following code and tried to run it TF M15 on S&P500 (Broker IG / code SPTRD at $50 per point). The results generated in the optimization table (+$25,365) do not match with the results shown on the Report (-$6385). Anyone can help please? could it be the Ticker? or something wrong with the code itself? Thanks
DEFPARAM CUMULATEORDERS = FALSE
DEFPARAM PRELOADBARS = 2500

TIMEFRAME(DAILY)
TKD = TenkanSen[9,26,52]
KJD = KijunSen[9,26,52]

TIMEFRAME(240 minutes)
TKH4 = TenkanSen[9,26,52]
KJH4 = KijunSen[9,26,52]
RSIH4Exit = RSI[9](close)

TIMEFRAME(60 minutes)
TKH1 = TenkanSen[9,26,52]
KJH1 = KijunSen[9,26,52]
RSIH1Exit = RSI[9](close)

TIMEFRAME(15 minutes)
condvol = 0
Bull = 0
Bear = 0
LongExit = 0
ShortExit = 0

myATR = AverageTrueRange[4](close)


TK = TenkanSen[9,26,52]
KJ = KijunSen[9,26,52]
LR100 = LinearRegression[100](close)
EMA100 = ExponentialAverage[100](close)
EMA34H = ExponentialAverage[34](high)
EMA34L = ExponentialAverage[34](low)
StoK = Stochastic[14,3](close)

voltrigger = 25
lengthvolstd = 200
multvolstd = 1.0
AvgVol     = Average[20](volume)
VolSpike   = (1 + (voltrigger / 100)) * AvgVol
condvol1 = volume > VolSpike
volumeStDev = STD[lengthvolstd](volume)
highVol = volume - volume[1] > volumeStDev*multvolstd
condvol = (highVol or condvol1)

ca1 = (close > TK and close > KJ)
ca2 = (close > EMA34H and close > EMA34L)
ca3 = (close > LR100 or close > EMA100)
Bull1 = (ca1 or ca3) and ca2 and close crosses over high[1] and condvol and StoK < 80

cv1 = (close < TK and close < KJ)
cv2 = (close < EMA34H and close < EMA34L)
cv3 = (close < LR100 or close < EMA100)
Bear1 = (cv1 or cv3) and cv2 and close crosses under low[1] and condvol and StoK > 20

Bull = Bull1 and not Bull1[1]
Bear = Bear1 and not Bear1[1]

LongExit = close crosses under KJD or close crosses under KJH4 or close crosses under KJH1 or TKD crosses under KJD or TKH4 crosses under KJH4 or TKH1 crosses under KJH1
ShortExit = close crosses over KJD or close crosses over KJH4 or close crosses over KJH1 or TKD crosses over KJD or TKH4 crosses over KJH4 or TKH1 crosses over KJH1


nLots = 0.5

IF time >=080000 and time <= 215500 then
IF NOT LongOnMarket AND Bull THEN
BUY nLots CONTRACTS AT MARKET
ENDIF
IF NOT ShortOnMarket AND Bear THEN
SELLSHORT nLots CONTRACTS AT MARKET
ENDIF
ENDIF


IF LongOnMarket AND Bear THEN
SELL AT MARKET
ENDIF
IF ShortOnMarket AND Bull THEN
EXITSHORT AT MARKET
ENDIF


IF LongOnMarket AND LongExit THEN
SELL AT MARKET
ENDIF
IF ShortOnMarket AND ShortExit THEN
EXITSHORT AT MARKET
ENDIF

SET STOP pLOSS max(myATR * 1.5,10)
SET TARGET PPROFIT TP
SET STOP PTRAILING SLT

IF time = 220000 THEN
SELL AT MARKET
EXITSHORT AT MARKET
ENDIF
I forgot to mention test on 30k candles
What value for SLT and TP are you using so that my test is same as yours?
From what you say, it sounds like you do not have Tick by Tick mode enabled?
Oh sorry, I can see from the screenshot that you DO Indeed have tick by tick enabled.
Thanks GraHal.
SLT 6
TP 50
and yes, Tick by Tick enabled.
 JS
JSParticipant
Senior
What I have always understood is that the optimization never works with “tick by tick mode” but that only ProBackTest uses “tick by tick mode”…
So, when you optimize and you get a certain (optimal) result, this is always without “tick by tick mode”.
You will see that your optimization and your ProBackTest give the same results when you turn off “tick by tick mode”…
the spread is too small and the 90 line is useless because afterwards you have the trailling stop
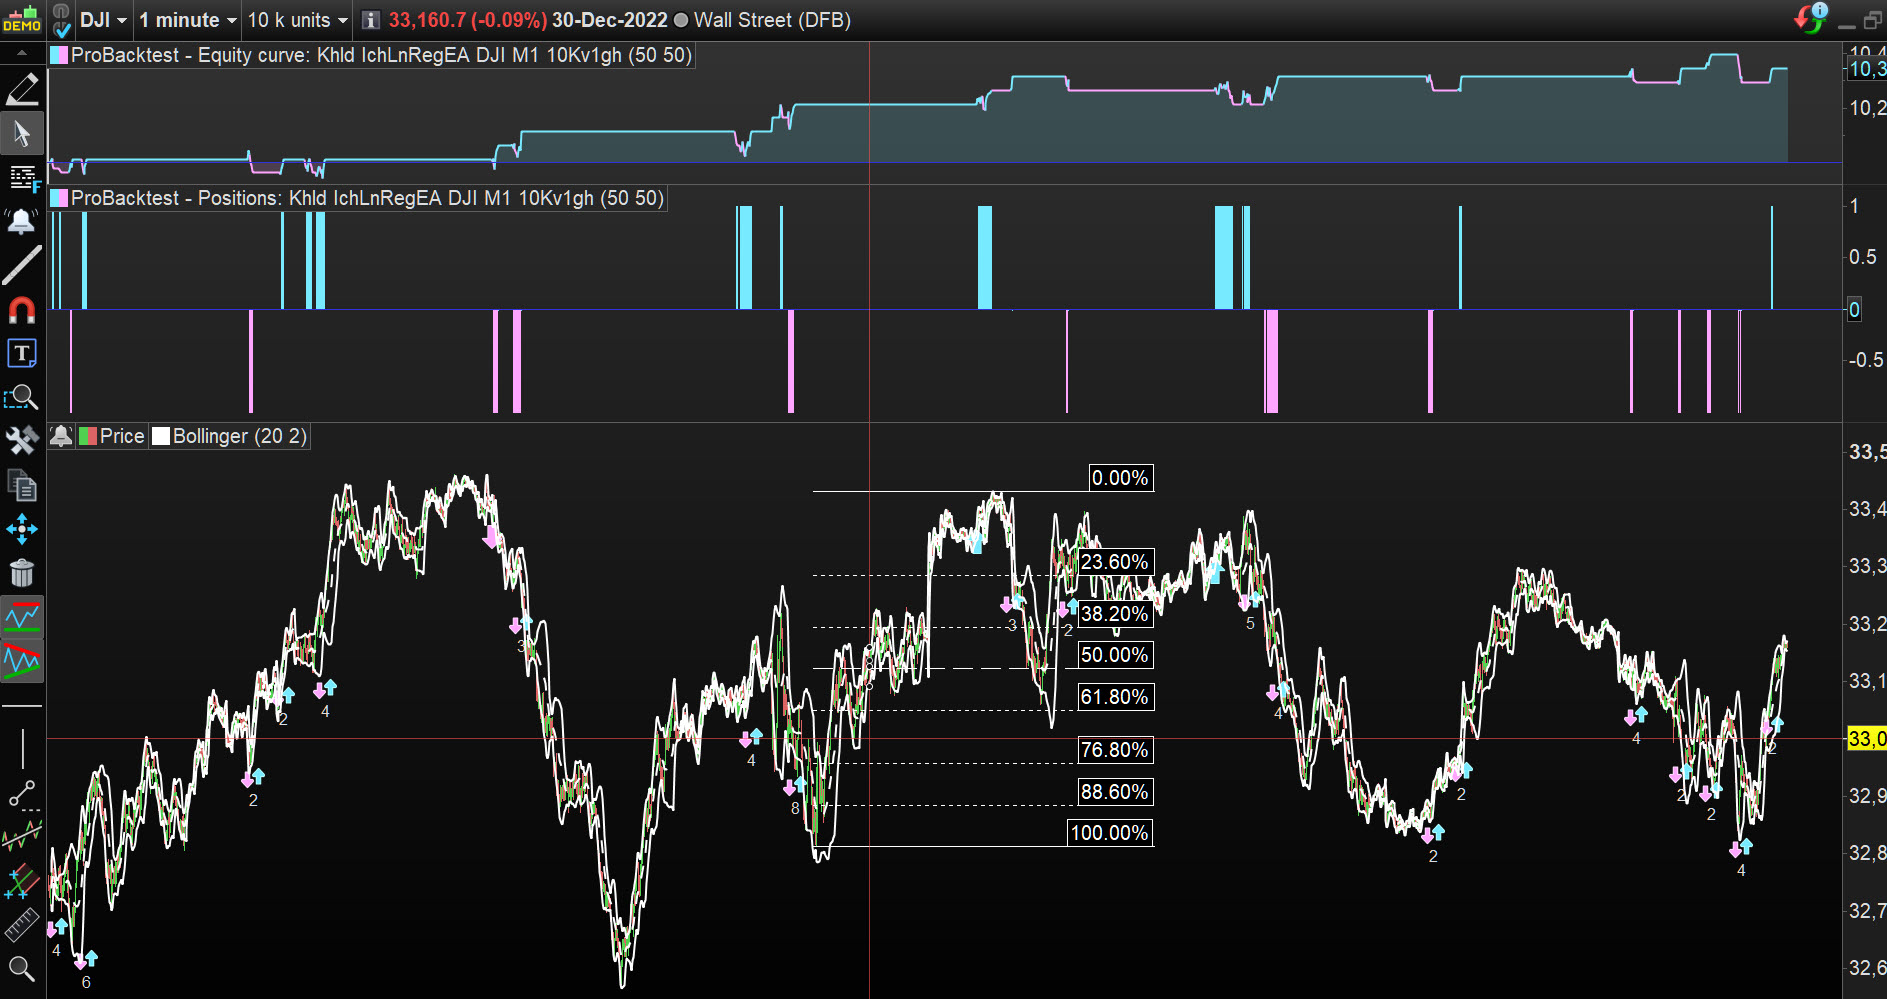
While I was waiting, I got attached with attached .itf.
I’ll simulate your test on SP500 now.
JSParticipant
Senior
“tick by tick mode” turned off…
SLT 6
How did you arrive at 6 for Stop pTrailing?
(Stop pTrailing is fraught with problems anyway, best to use a coded Trailing Stop)
You would be stopped out (with SLT 6) almost each and every 15 min bar and so get a
‘high value in the Tick Mode column‘ on backtest results. This is likely the reason for your odd results (same / similar to what JS has said).
Ideally we want 0 / zero in the
Tick Mode column‘ on backtest results … backtest result will then be same as shown on the Chart and Detailed Report (allowing for any open trades … which are NOT taken account of in backtest results).
JSParticipant
Senior
The difference between the optimization (without tick by tick mode) and the ProBackTest (with tick by tick mode) is so big here because the code uses stop loss, take profit and trailing stop that are only calculated in the ProBackTest in a “good way”…
JSParticipant
Senior
Sorry when I repeat myself but:
Optimization never uses tick by tick data but only calculates with “bars”…
ProBackTest with tick by tick enabled “looks” into the “bars” at tick level…
Thank you. the Spread of 0.4 is the IG Spread during regular market hours, which I used as an estimation. The Spread on official Futures is 0.25.
The SL (line 90) is useful in case the position goes immediately into red and does not have the chance to comeback to green (news for example).
You’re absolutely right. I’ve optimized with T by T and get the same result on the optimization and the Report, which is by the way very close to the one reported on your graph. Thank you!
The system looks promising though. Every single month is green from Oct. 2021 to Dec. 2022. Based on the report, very minimal drawdown. R/R x3.3