Hi,
Just created this code with excellent result and an intention to buy only on price in intraday basis.
Any comments will be highly appreciated.
// Main code : LancePivotXXX
//-------------------------------------------------------------------------
//-------------------------------------------------------------------------
// LancePivotXXX
//--------------------------------------------------------------------
//Lance PivotSystem
// TF on 30min
//S&P500, EURUSD

// Definition of code parameters
DEFPARAM CumulateOrders = False // Cumulating positions deactivated

// Prevents the system from placing new orders on specified days of the week
daysForbiddenEntry = OpenDayOfWeek = 6 OR OpenDayOfWeek = 0

// Conditions to enter long positions
indicator1 = 2*((DHigh(1) + DLow(1) + DClose(1))/3) - DHigh(1)
c1 = (close CROSSES UNDER indicator1)
indicator2 = (DHigh(1) + DLow(1) + DClose(1))/3-(DHigh(1)-DLow(1))
c2 = (close CROSSES UNDER indicator2)

IF (c1 OR c2) AND not daysForbiddenEntry THEN
BUY 2 CONTRACT AT MARKET
ENDIF

// Conditions to exit long positions
indicator3 = 2*((DHigh(1) + DLow(1) + DClose(1))/3) - DLow(1) + 3
c3 = (close CROSSES OVER indicator3)
indicator4 = DHigh(1)+2*(((DHigh(1) + DLow(1) + DClose(1))/3)-DLow(1))
c4 = (close CROSSES UNDER indicator4)

IF c3 OR c4 THEN
SELL AT MARKET
ENDIF

// Stops and targets
SET STOP pLOSS 20
Thank you for this interesting approach. I get not so good results before the period you seem to have used to evaluate your strategy. That’s why I moved your post from the library pending review list to this new forum topic.
Of course it depends of when you start the strategy, but the fact is the stoploss is very tight and if it is triggered many times in a short period, the strategy give back to the market the profit it has already made and that’s one of the main reason it doesn’t perform well in the past. I think that recent bull market behavior has given more juice to the “let the profit run” adage, your strategy mainly rely on.
Hi Nicolas,
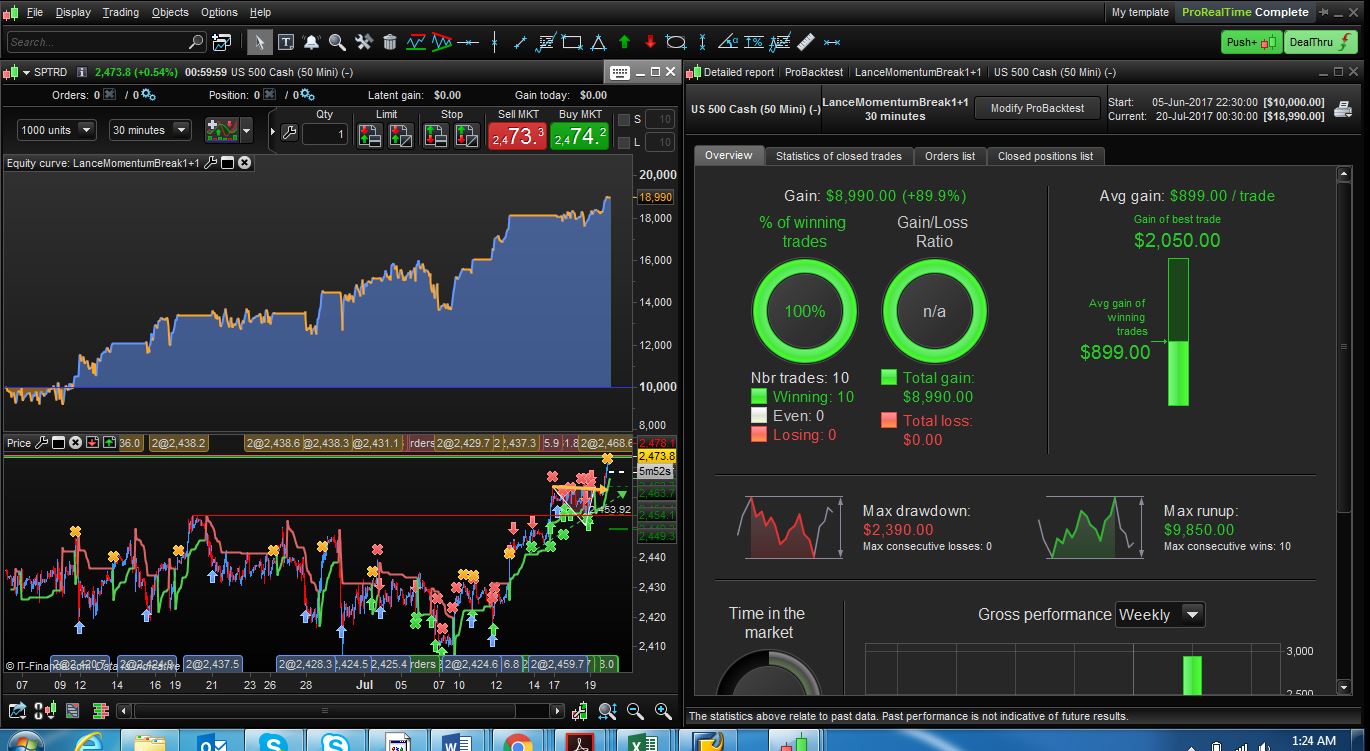
Thank you for your comments. The no. unit/bars set to this strategy is 1000 – 1500units. I been running this on my live account and it has been consistent .
I will take not on the let profit run mode and appreciate if somebody guide me more to optimize the code
Regards,
Lance
Hi Lance
There’s no content in your .itf file?
Looks like you may need different Exit Conditions because below gives better results (attached Spreadbet @ £1 per point over 100,000 bars)
Just ideas anyway
// Main code : LancePivotXXX
//-------------------------------------------------------------------------
//-------------------------------------------------------------------------
// LancePivotXXX
//--------------------------------------------------------------------
//Lance PivotSystem
// TF on 30min
//S&P500, EURUSD

// Definition of code parameters
DEFPARAM CumulateOrders = False // Cumulating positions deactivated

// Prevents the system from placing new orders on specified days of the week
daysForbiddenEntry = OpenDayOfWeek = 6 OR OpenDayOfWeek = 0

// Conditions to enter long positions
indicator1 = 2*((DHigh(1) + DLow(1) + DClose(1))/3) - DHigh(1)
c1 = (close CROSSES UNDER indicator1)
indicator2 = (DHigh(1) + DLow(1) + DClose(1))/3-(DHigh(1)-DLow(1))
c2 = (close CROSSES UNDER indicator2)

IF (c1 OR c2) AND not daysForbiddenEntry AND Close > Average[10](close) THEN
BUY 2 CONTRACT AT MARKET
ENDIF

// Conditions to exit long positions
//indicator3 = 2*((DHigh(1) + DLow(1) + DClose(1))/3) - DLow(1) + 3
//c3 = (close CROSSES OVER indicator3)
//indicator4 = DHigh(1)+2*(((DHigh(1) + DLow(1) + DClose(1))/3)-DLow(1))
//c4 = (close CROSSES UNDER indicator4)
//
//IF c3 OR c4 THEN
//SELL AT MARKET
//ENDIF

// Stops and targets
SET TARGET PPROFIT 80
SET STOP pLOSS 24
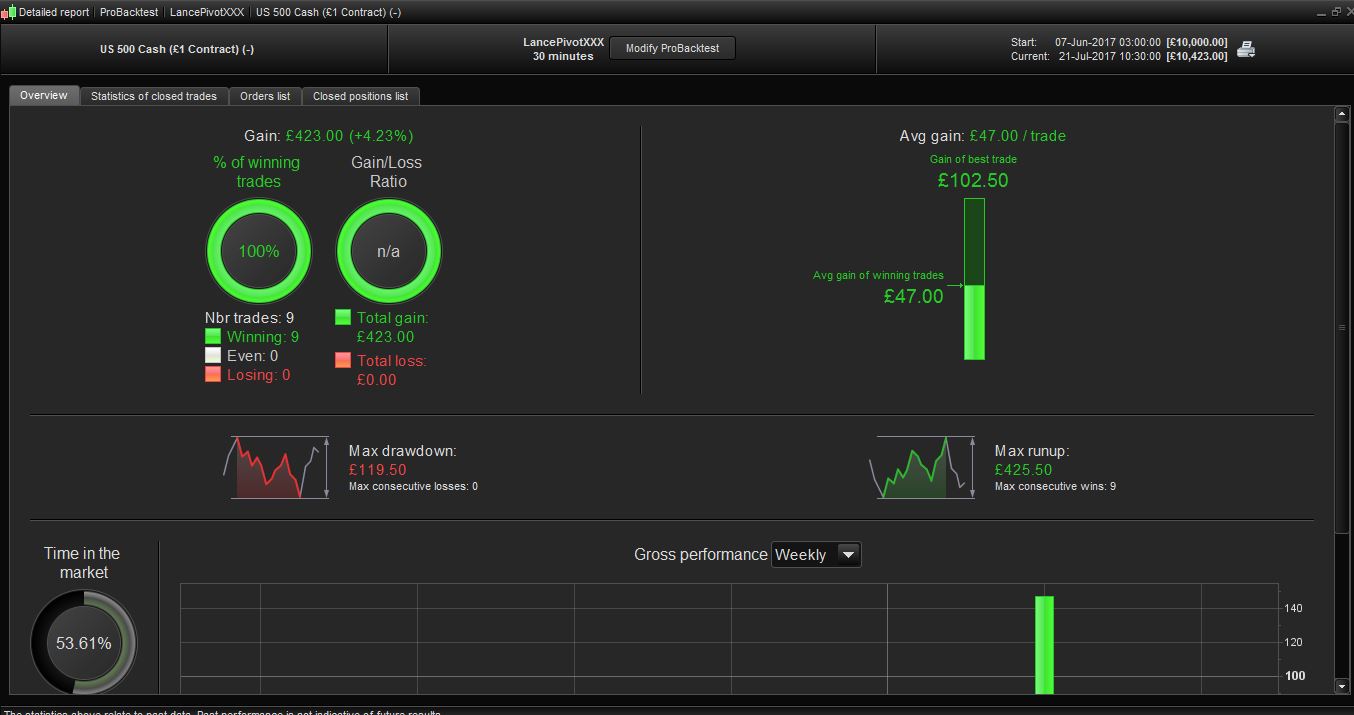
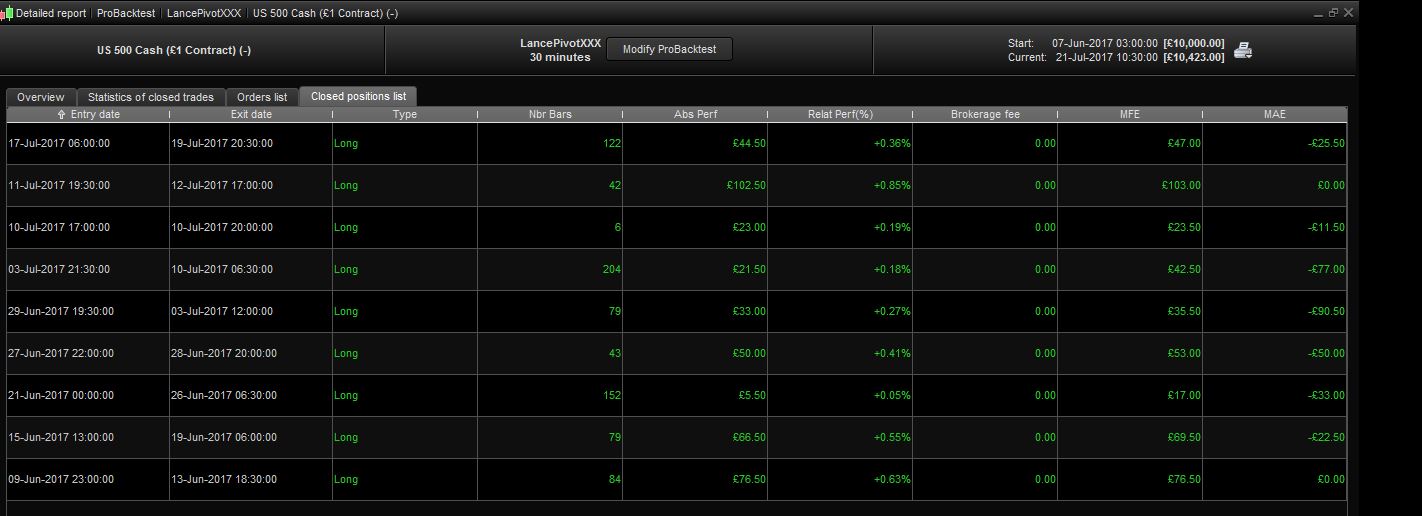
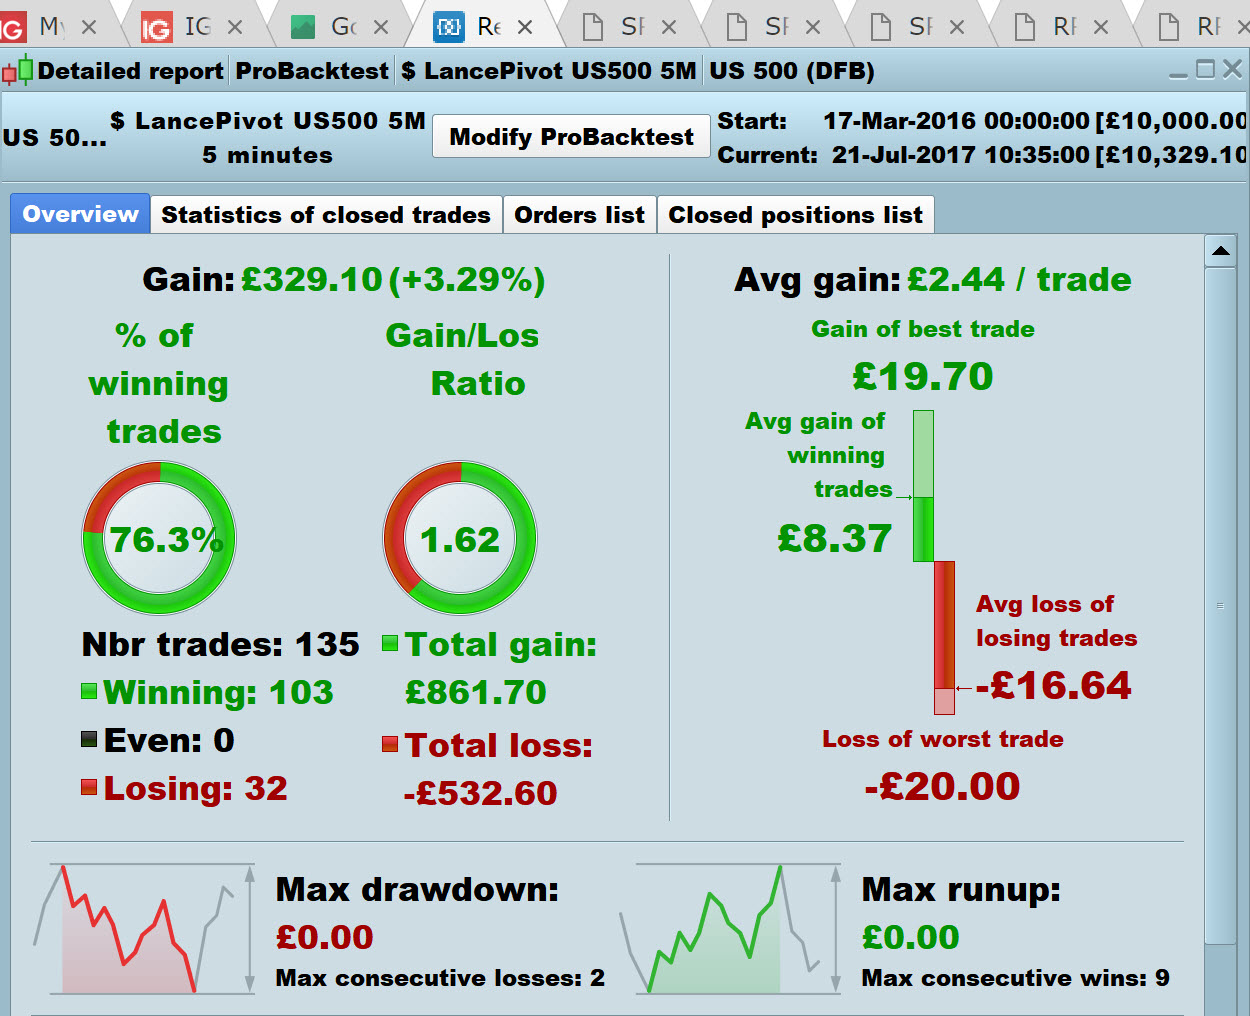
Thanks Grahal for your comments. See attached .itf file.
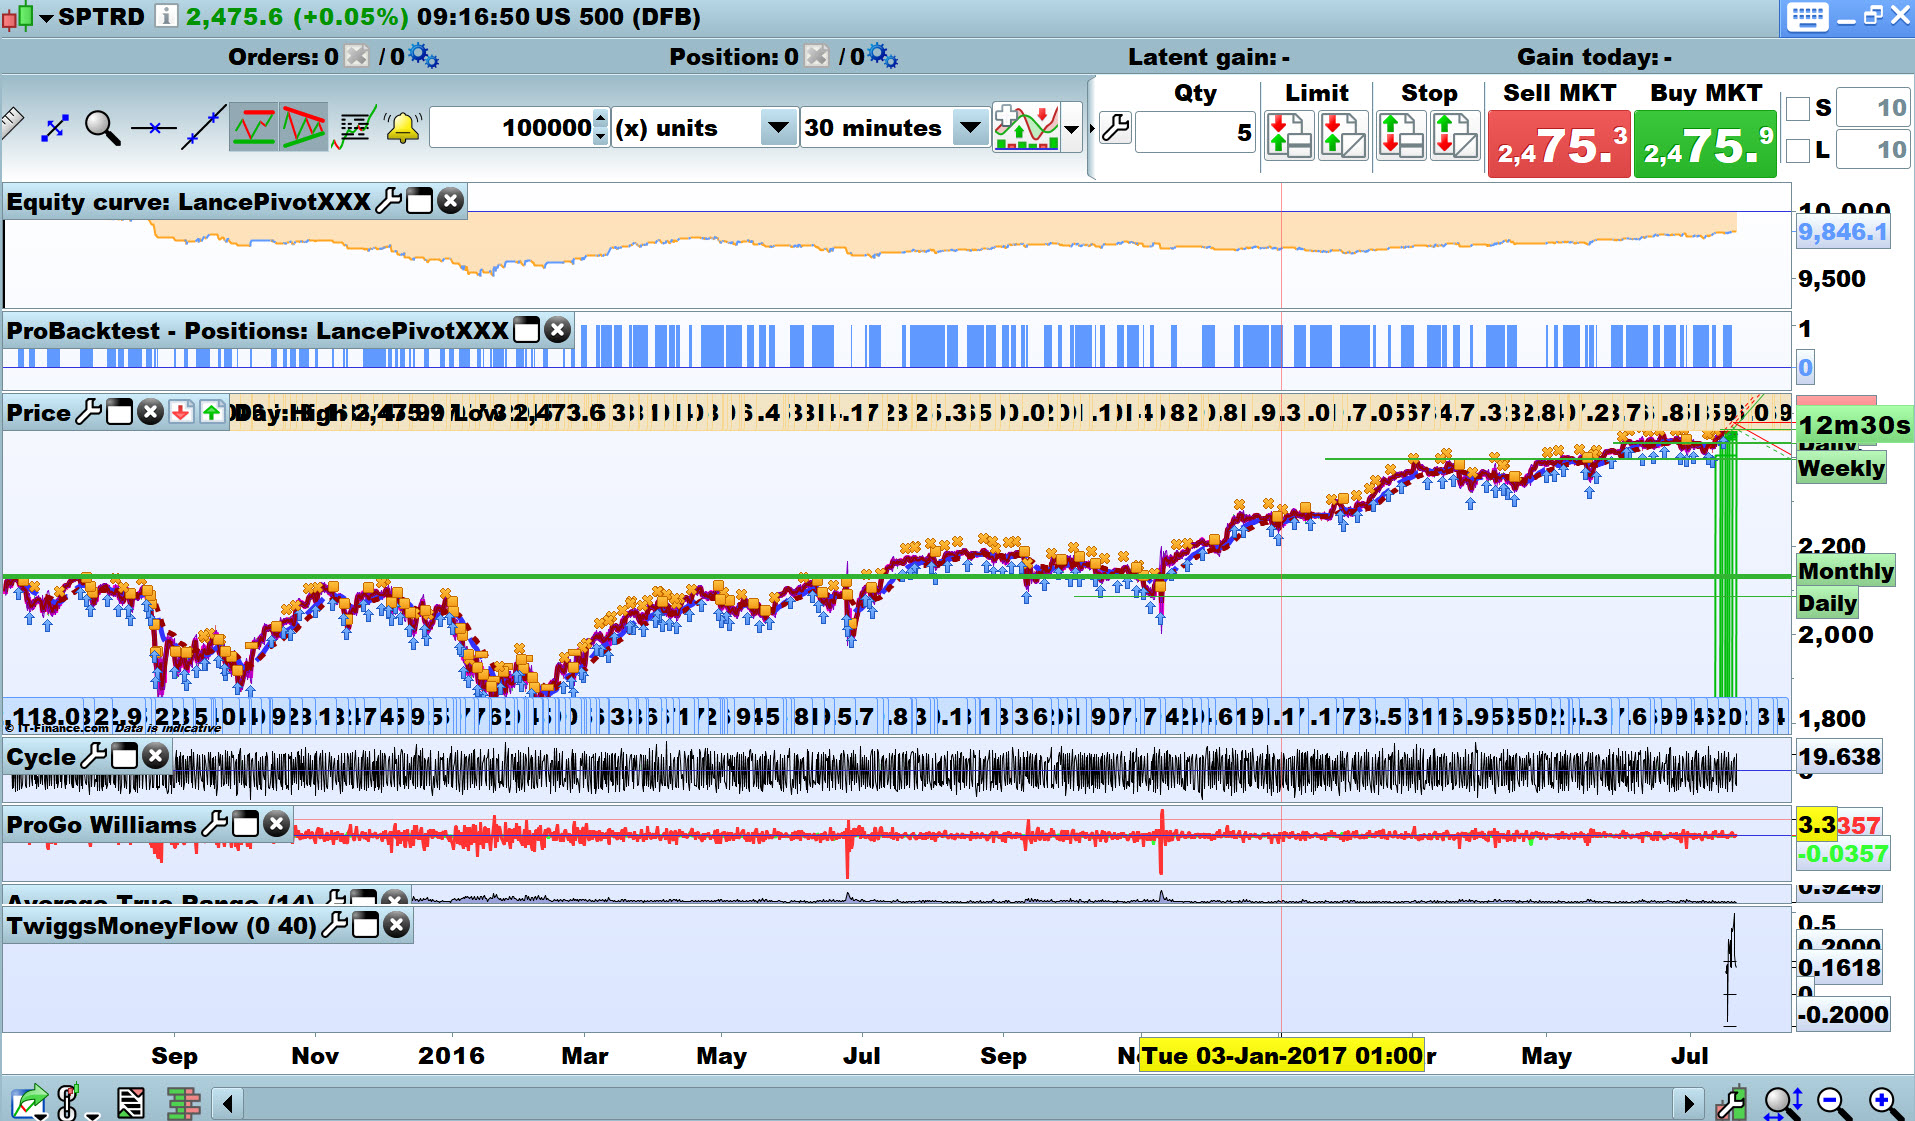
Result on S&P 500 Cash ( 1GBP Contract)
File content good now thanks.
How come you are showing results for the last 6 weeks only? Your results are not statistically significant … mainly due to the low number (9) of trades?
Are you able to get your code to execute profitable sellshort trades?
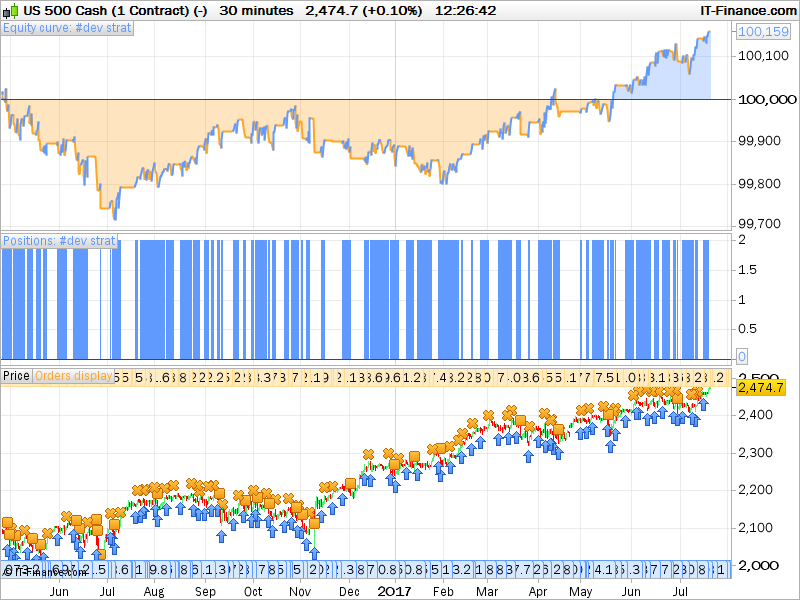
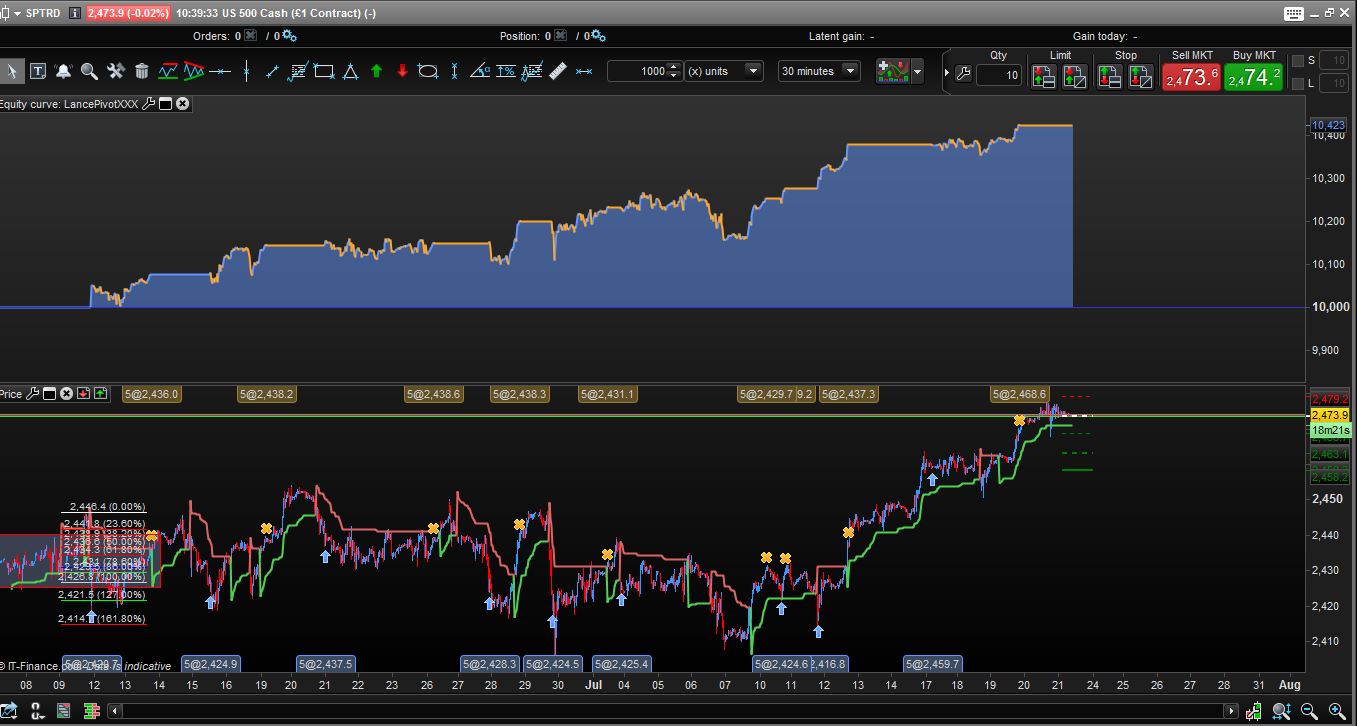
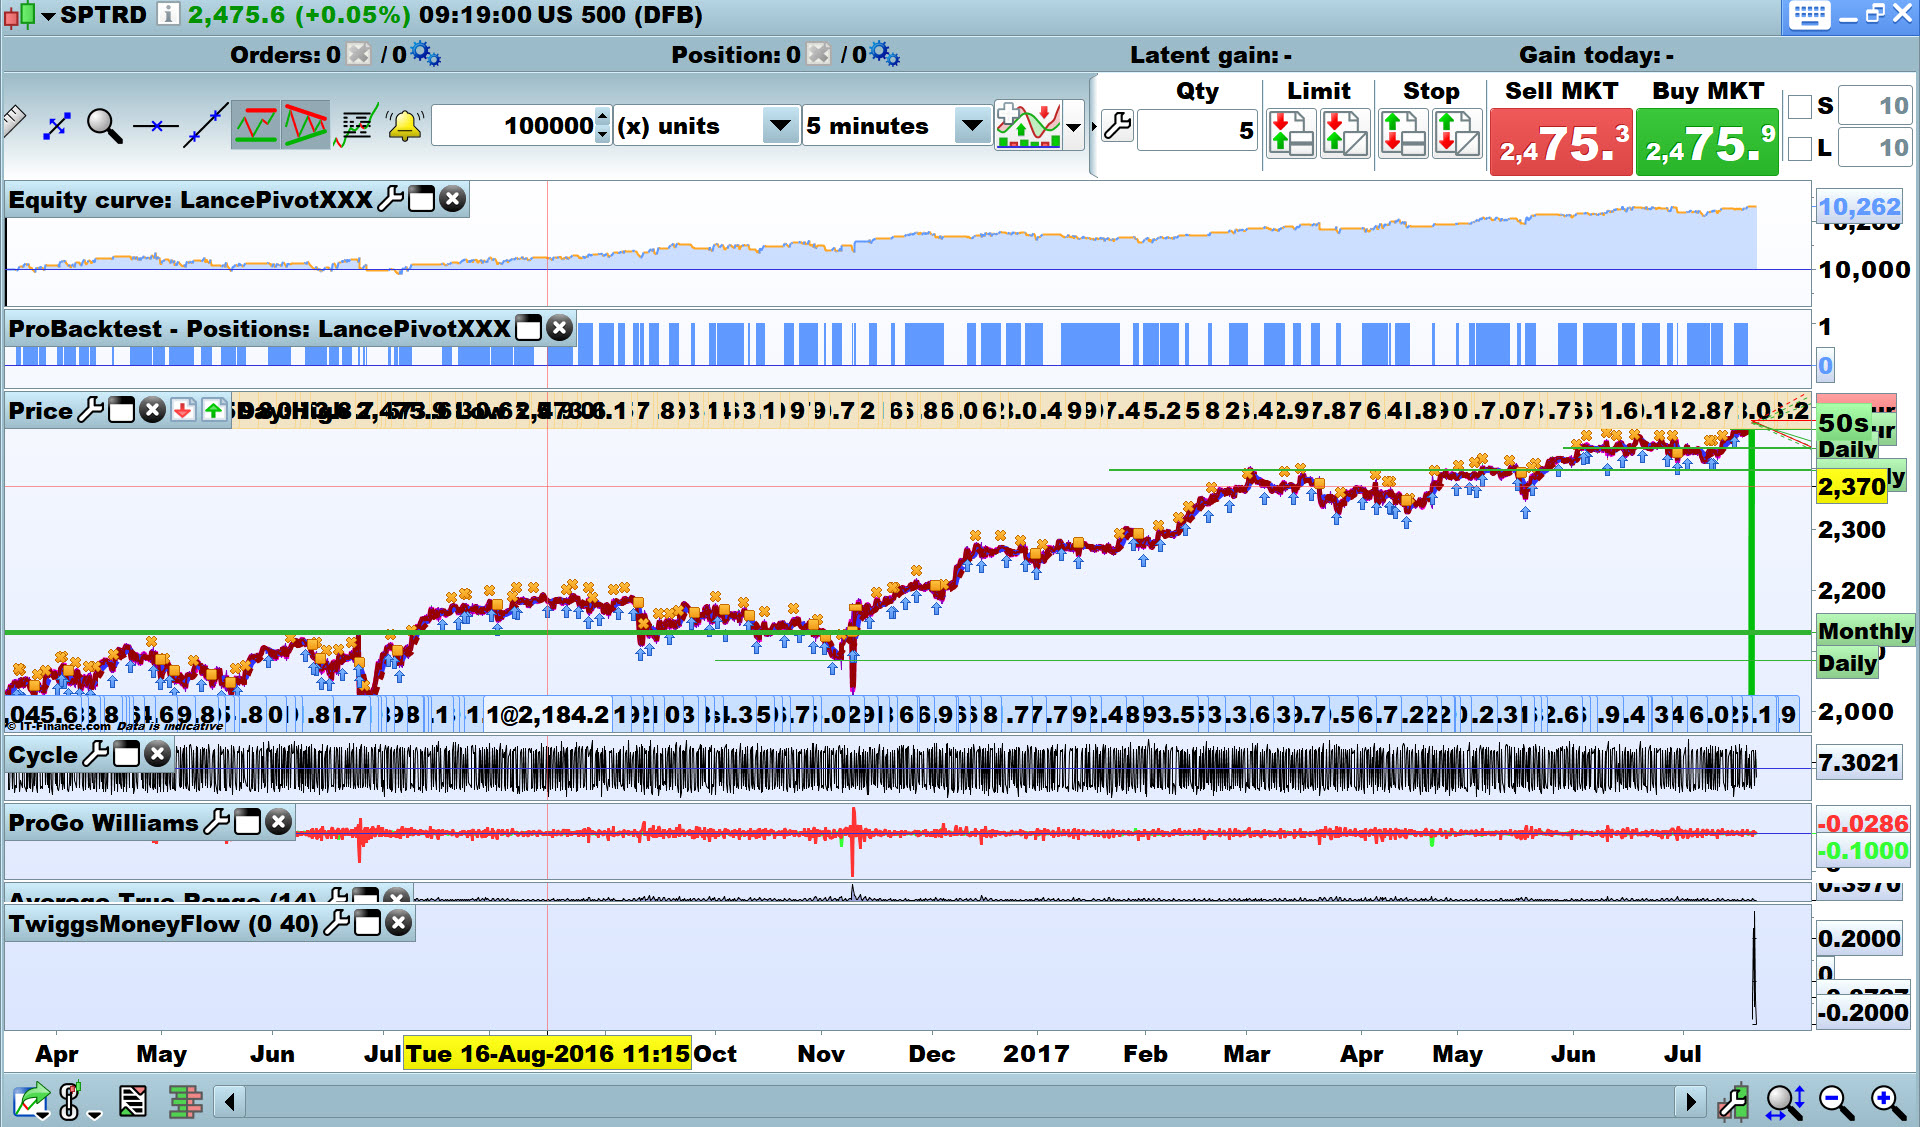
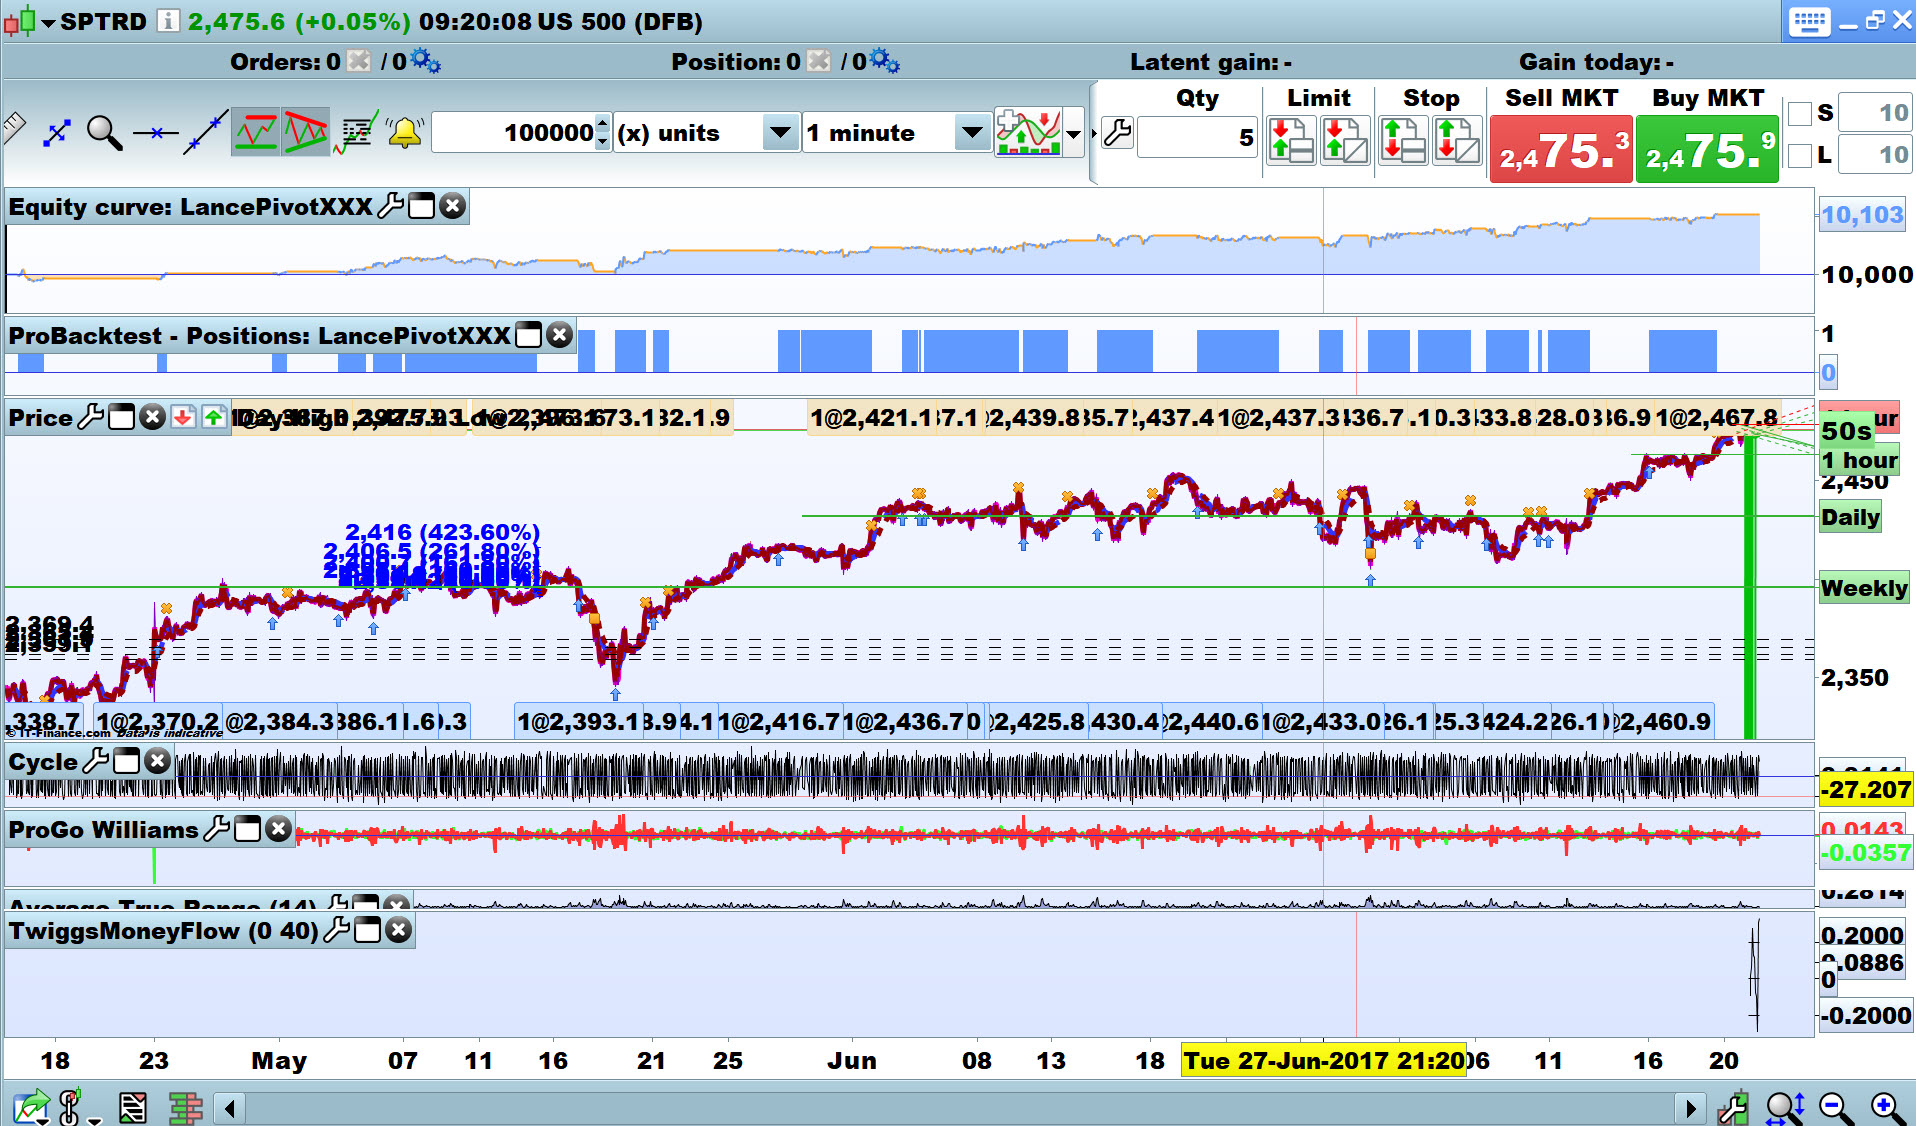
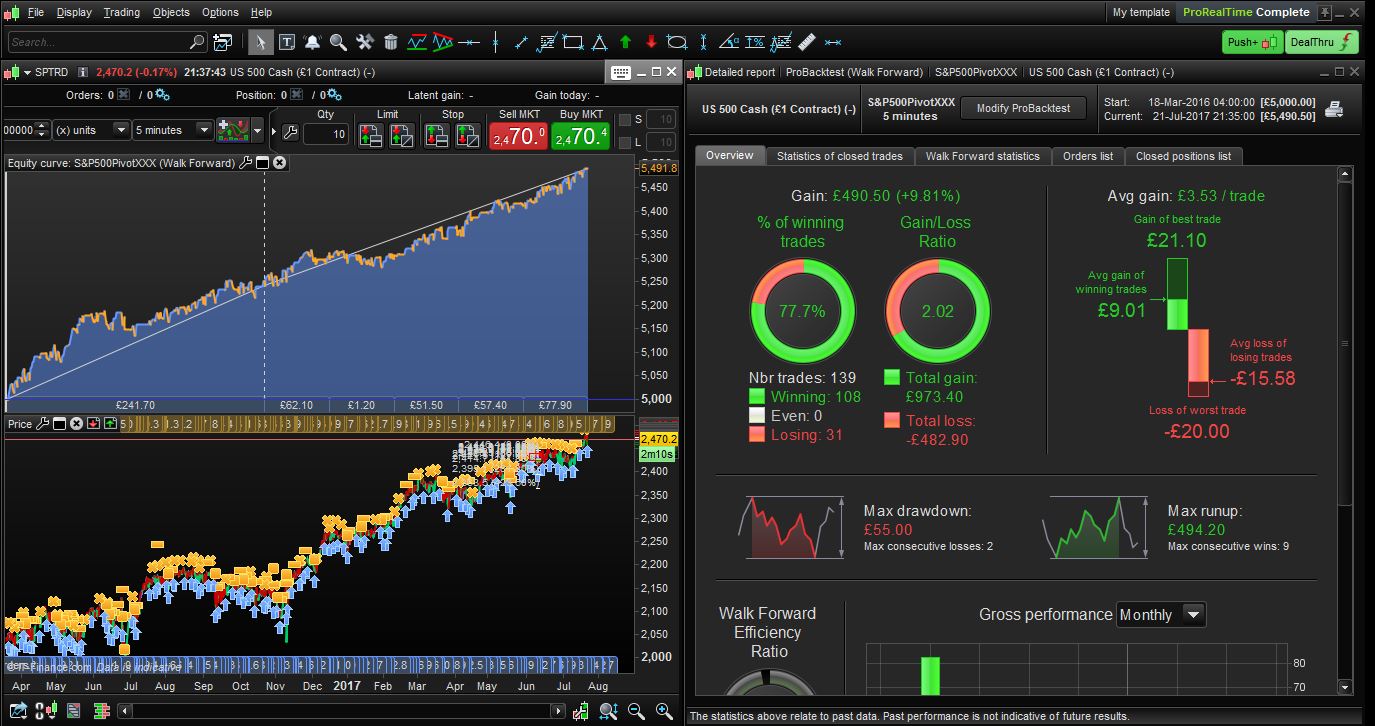
Equity Curve looks better on 5 min and even on 1 min … why don’t you work on it some more (and on sellshort) on the 5M Timeframe? Attached are all on 100,000 bars.
Point to note though is that 100,000 bars at 5M / 1M may equate to your 6 weeks on 30M and that’s why equity curve on attached looks good … work it out or ‘go figure’ (if you prefer that american expression! 🙂 )?
5 min is a good compromise between too much noise and false signals (on 1M / lower) and too much time for profit to turn to loss (on 30M / higher).
Cheers
GraHal
I decided to go figure …
100k bars at 1 min is back to mid April 2017
100k bars at 5 min is back to mid March 2017
100k bars at 30 min is back to mid Jun 2015
To get it accurate, the Chart or even the Platform needs closing each time (which I didn’t do) because when you’ve charted a long period it kinda screws it for shorter periods.
The significant thing to note is that the 5 m results in the image (I posted above) show 118 trades and so is far more significant … you go figure now (re your 9 trades) 🙂
If you can get the SellShort side working now (on 5 Min TF) we might make money!? 🙂
GraHal
PS you could do the SellShort as a completely separate Auto-Strategy and we’ll run Long and Short Strats alongside each other?
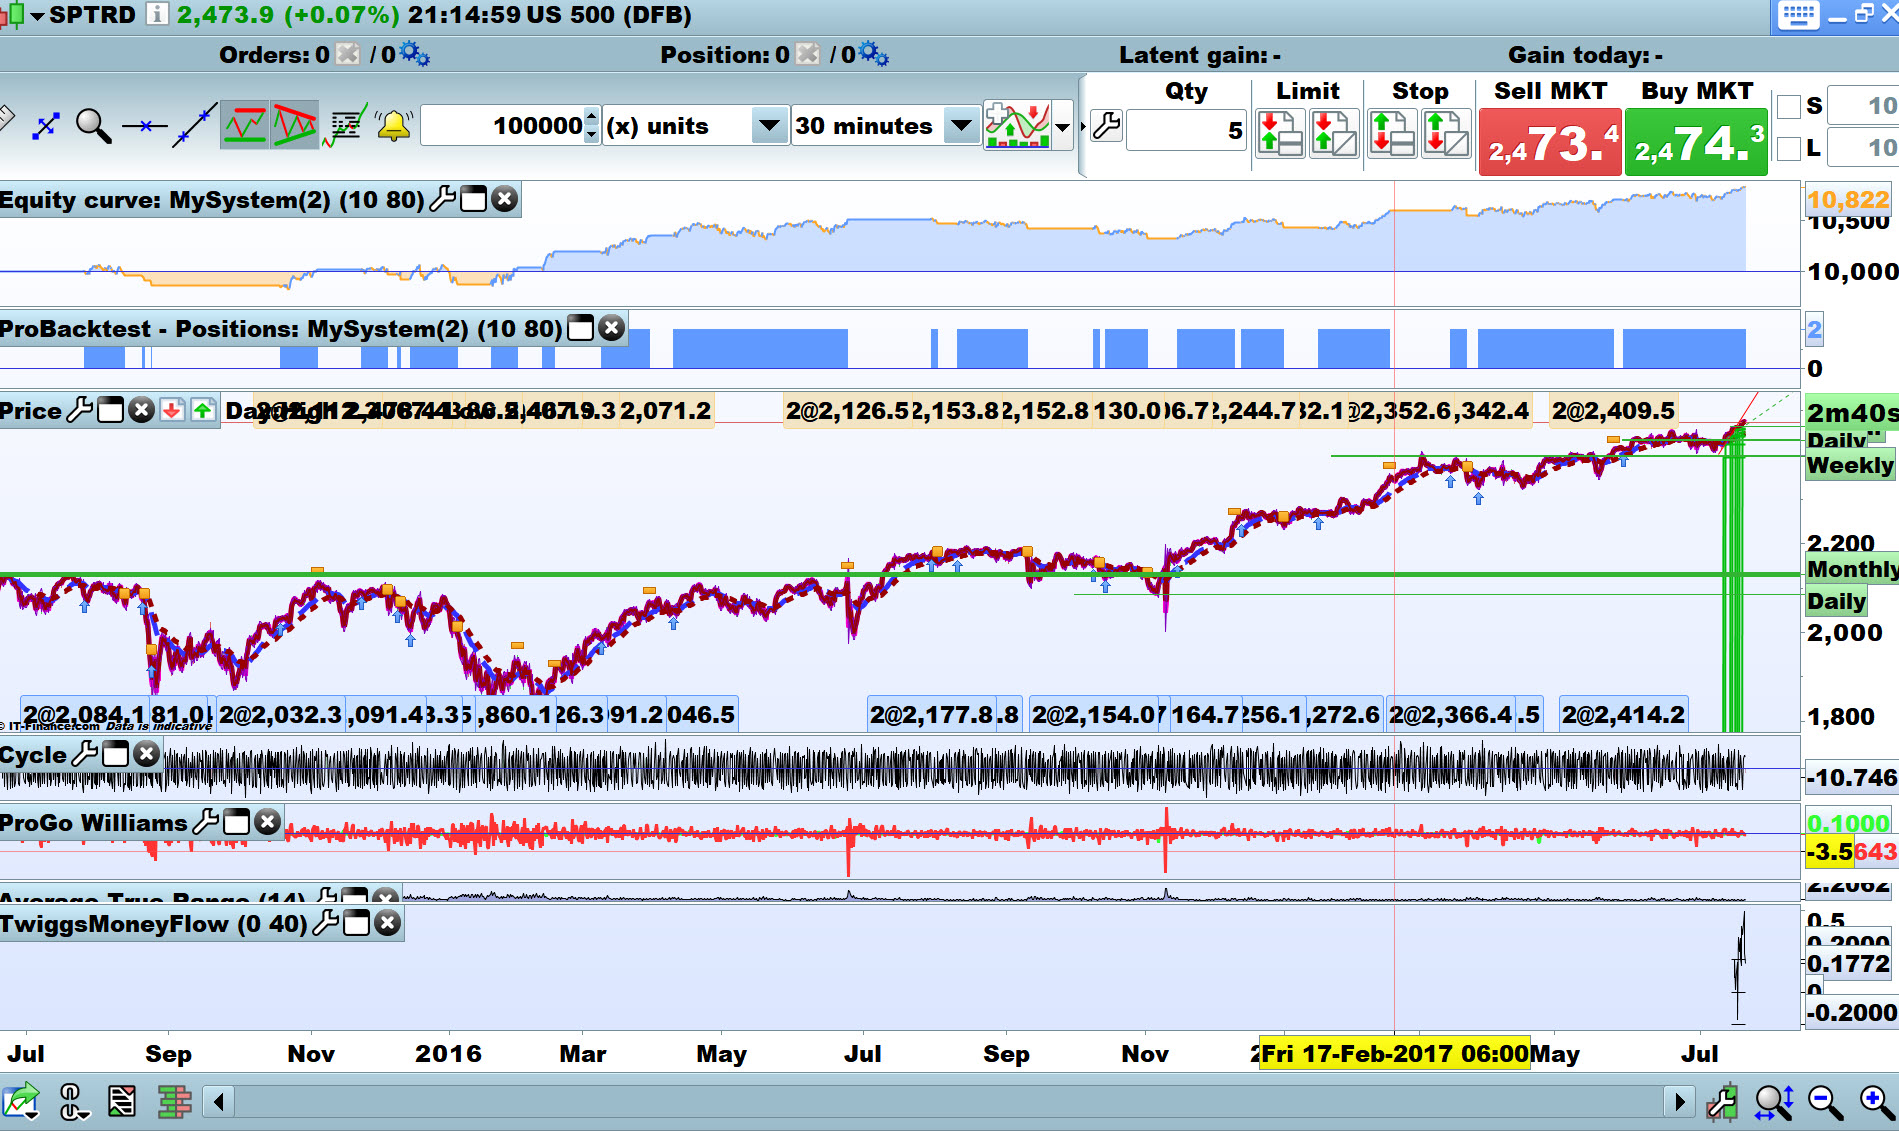
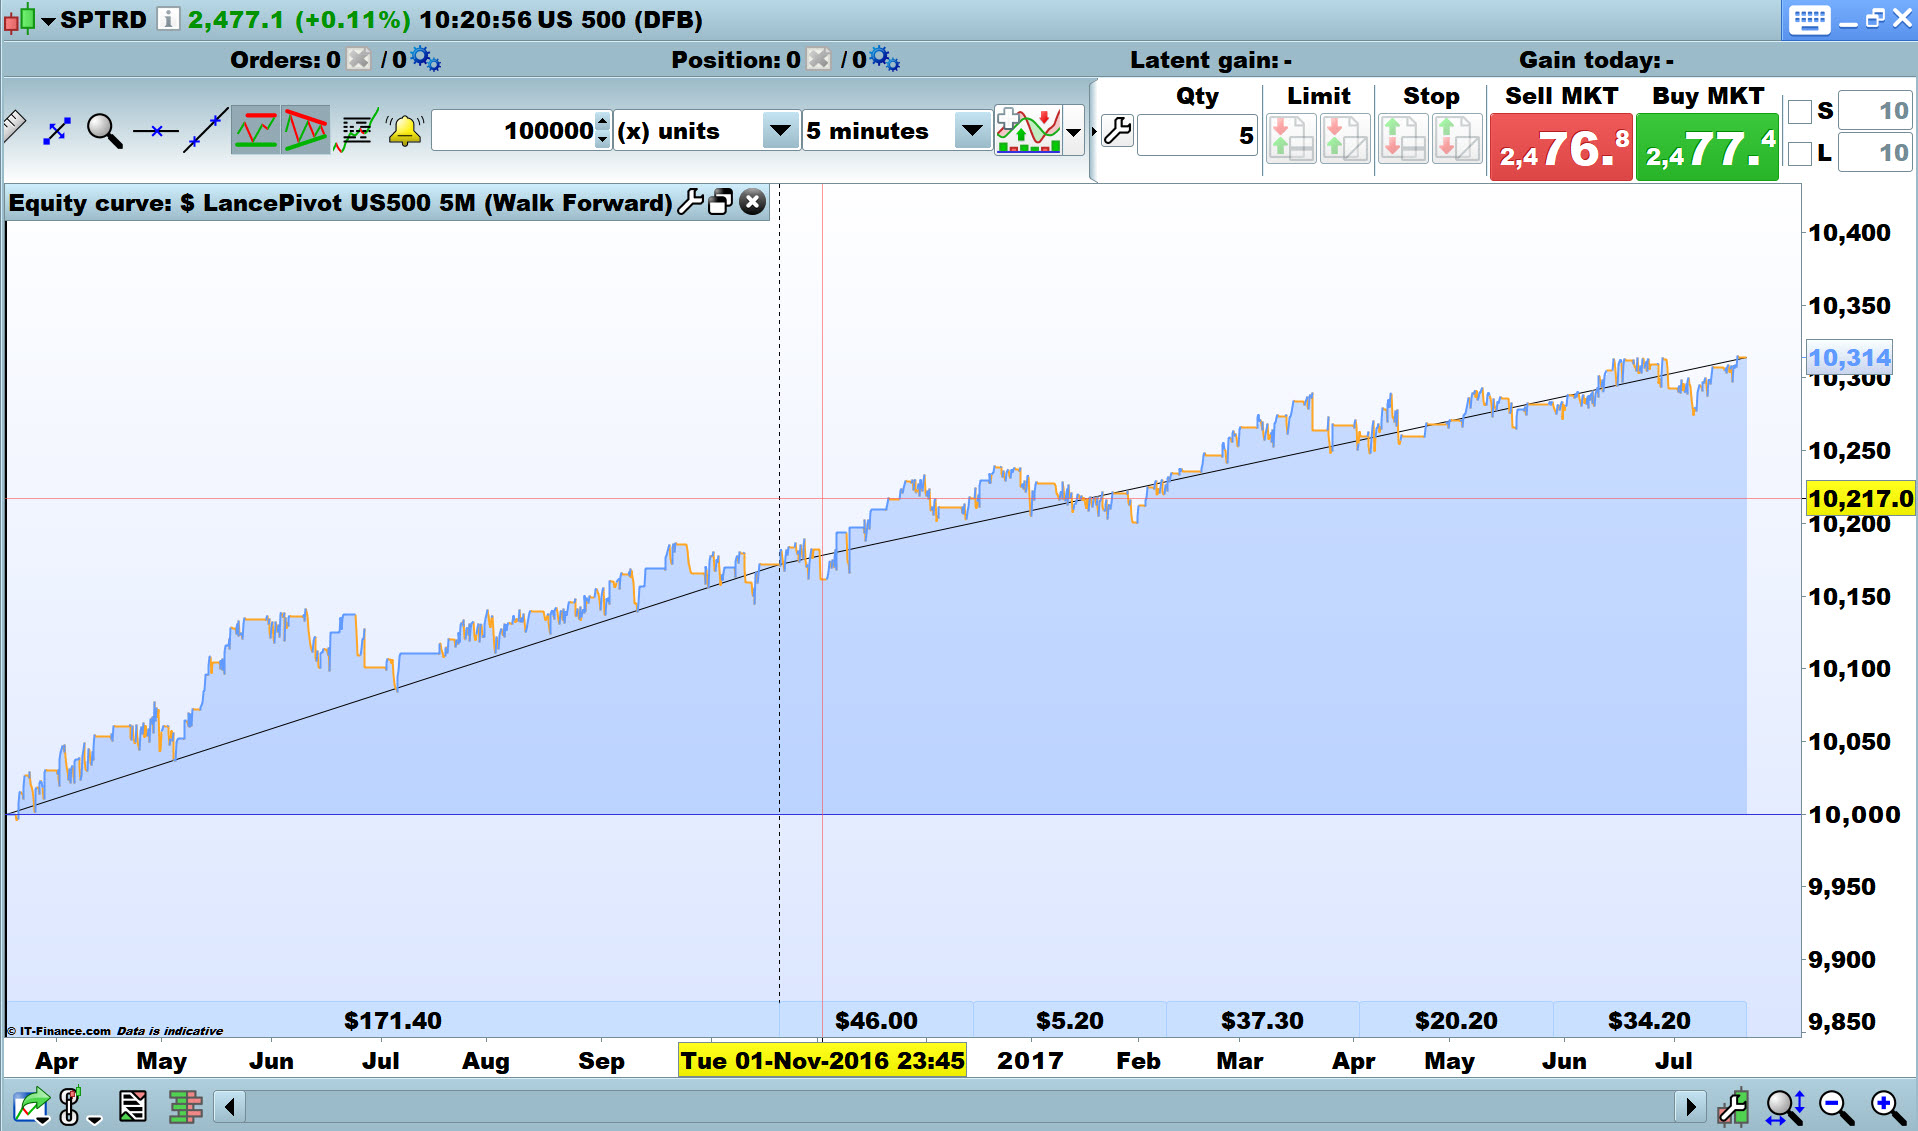
Better still on 5M with Target Profit at 12 (SL at 20) … see Walk Forward results attached.
I’ve set your code / Strat going Live on the S&P! I’ll let you know how it goes!
If you get SellShort working then let me know please?
Good Work Lance!
GraHal
Hi Grahal,
Thanks a lot for taking your time back testing my strategy and i really appreciate your suggestions. I have tested also on 5Min TF, 100K Bars and the result was impressive .
The system trigger my trade today and so far is running as expected…
I will work on SELL opportunity and advise you with the result..
Attached result on walk forward testing with WFER of 97%..
Thanks for your comments .
Lance
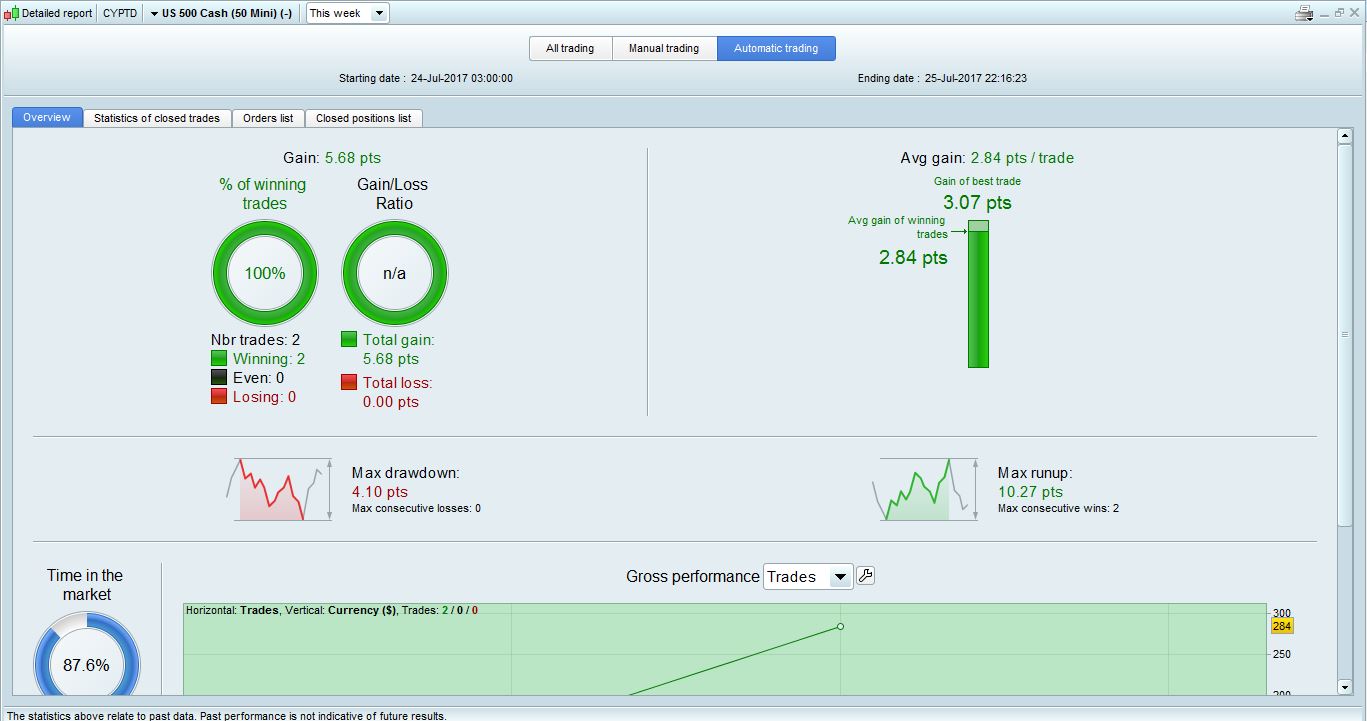
HI Grahal,
So far two consecutive trades with positive result. See attached.. I hope you had the same results.
Regards,
Lance
Hi – Interesting thread. I am intrigued, how did you get the results above to show up as points rather than in money terms ? ie 5.68 pts. As far as I am aware the detailed reports only show figures in currency rather than points gained/lost.
Many thanks
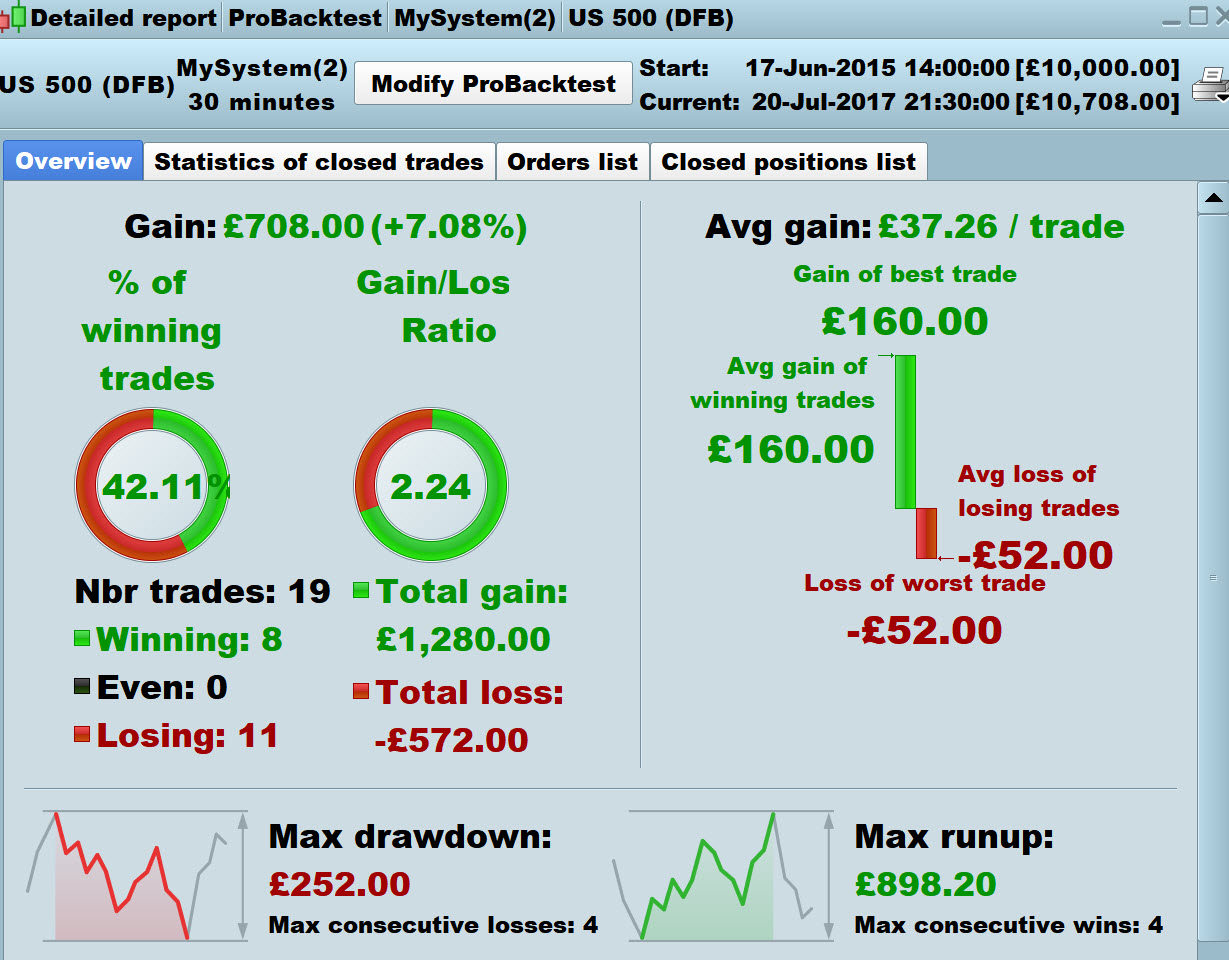
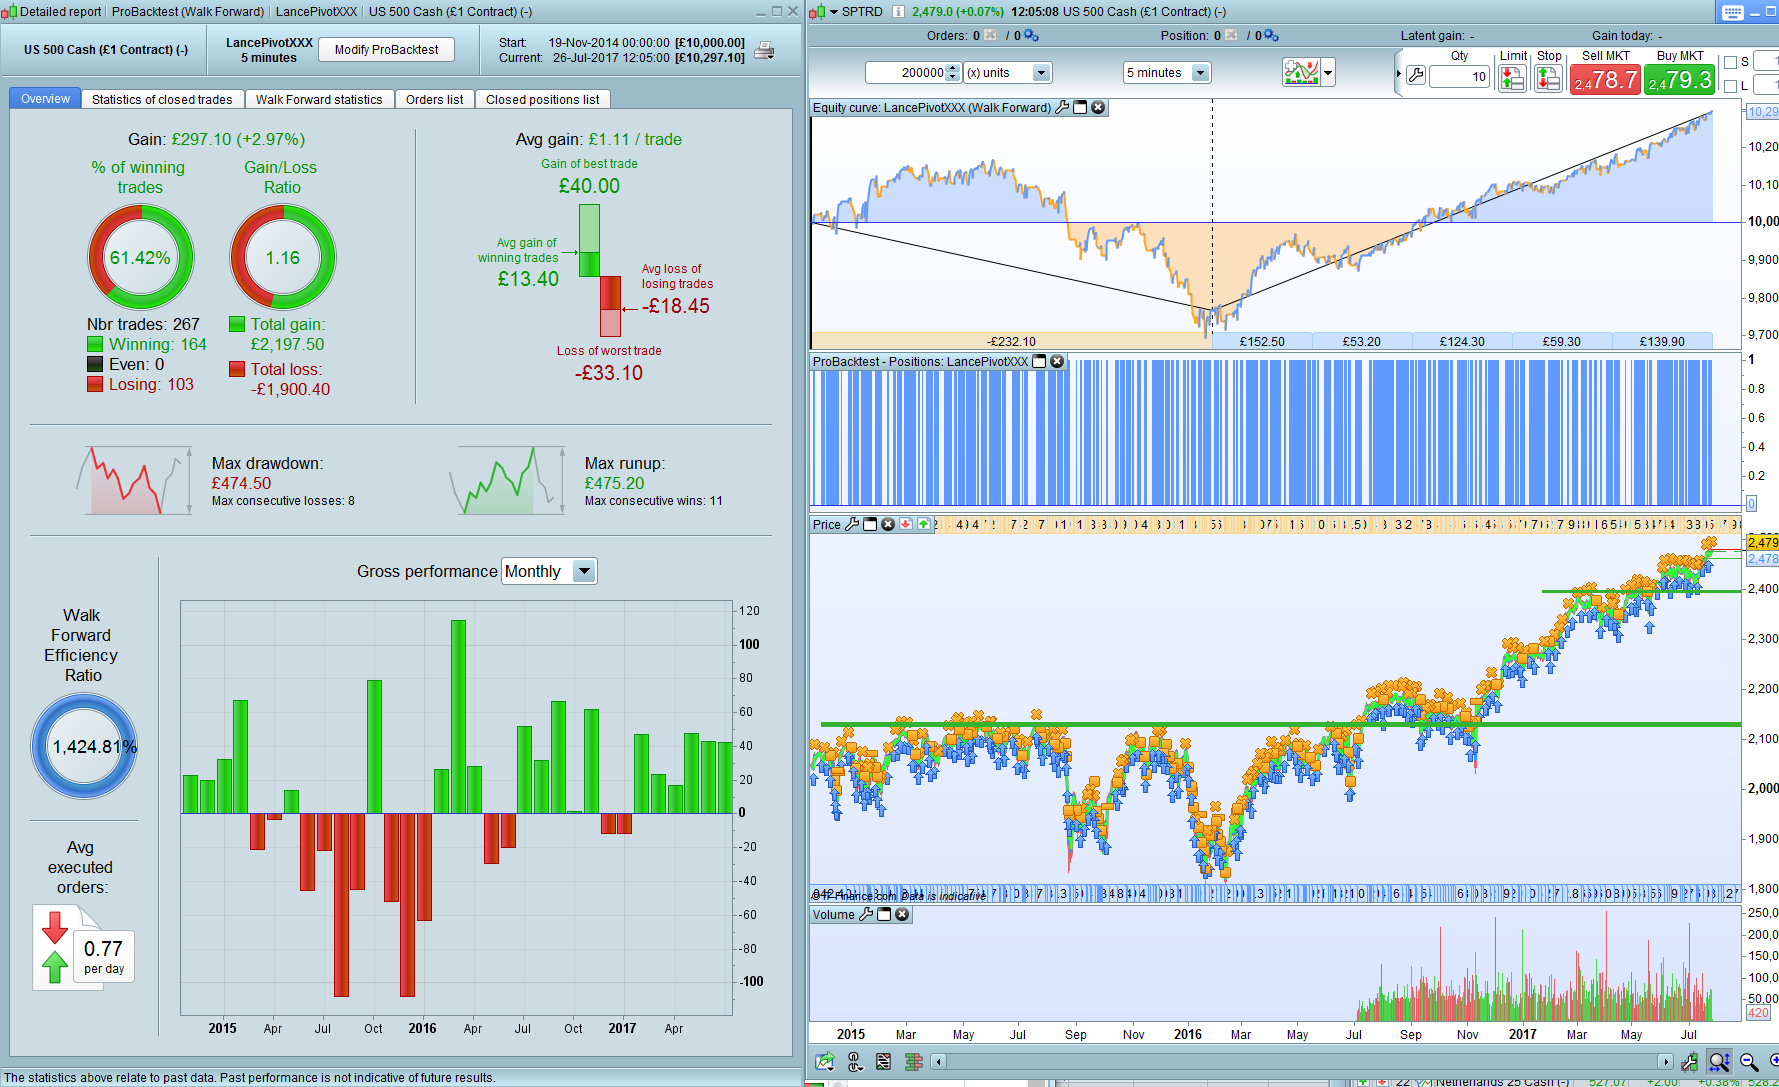
Please find attached a longer 200k bars backtest result on this strategy. As expected since it is a long strategy only, the results are only positive in a prolonged bull market ie that from the beg of 2016 onwards. Prior to this period as you can see, in a sideways or falling market the system does not perform as well. A way to improve this is to of course add in a short component that will also stop the losing long trades from taking place and provide an offset with hopefully short profits as well. However, at present the system looks like performing well, so well done on the idea and coding ! But just be aware of this going forward.
@Grahal: Which variables did you optimize in your WF? TP and SL?
I agree with Manel. It is a mean reverting strategy just buying the dips in a long market. So it worked great since the US election.
I will make the short side after i had lunch but I’m afraid it won’t be as promising as the long side. But we shall see…