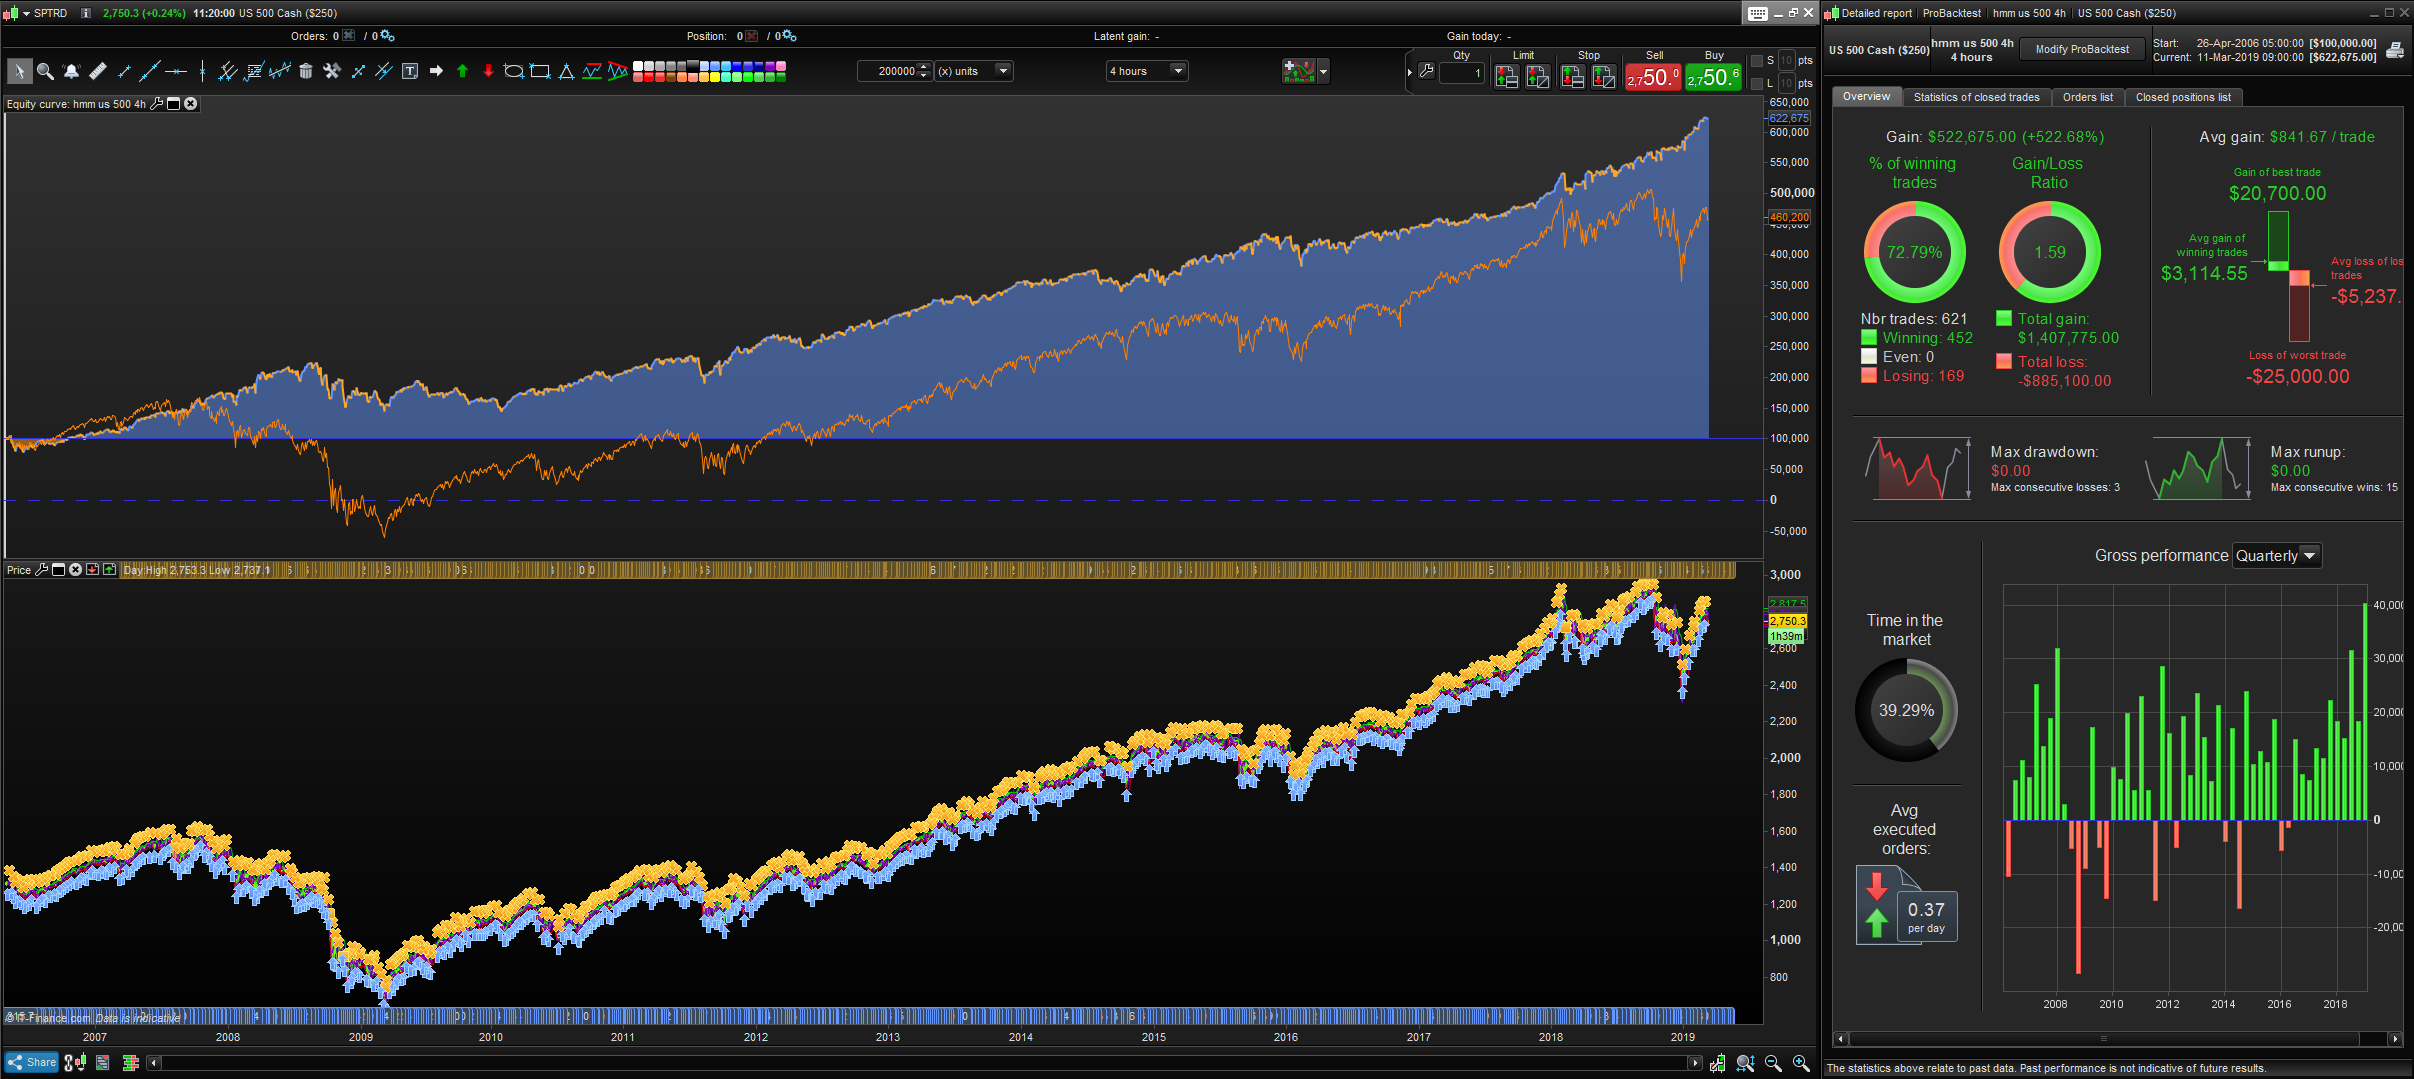
Hello all, as im starting towards finding super-simple codes and i came across this. Surprised to see it beat buy and hold with only 1 line for entry and 1 for exit. (plus a tiny bit money management)
Im 100% sure this could become alot better with some filters and better setups, just wondering what your take would be on this code. This is just a code trying to find simple ways to beat buy and hold.
Optimized variables:
Stop loss X pips
Exit after X bars
MFE trailing stop.
For entry and sell signal i used just the standard variables for bollinger band (boll mid = average 20 + boll up = 20
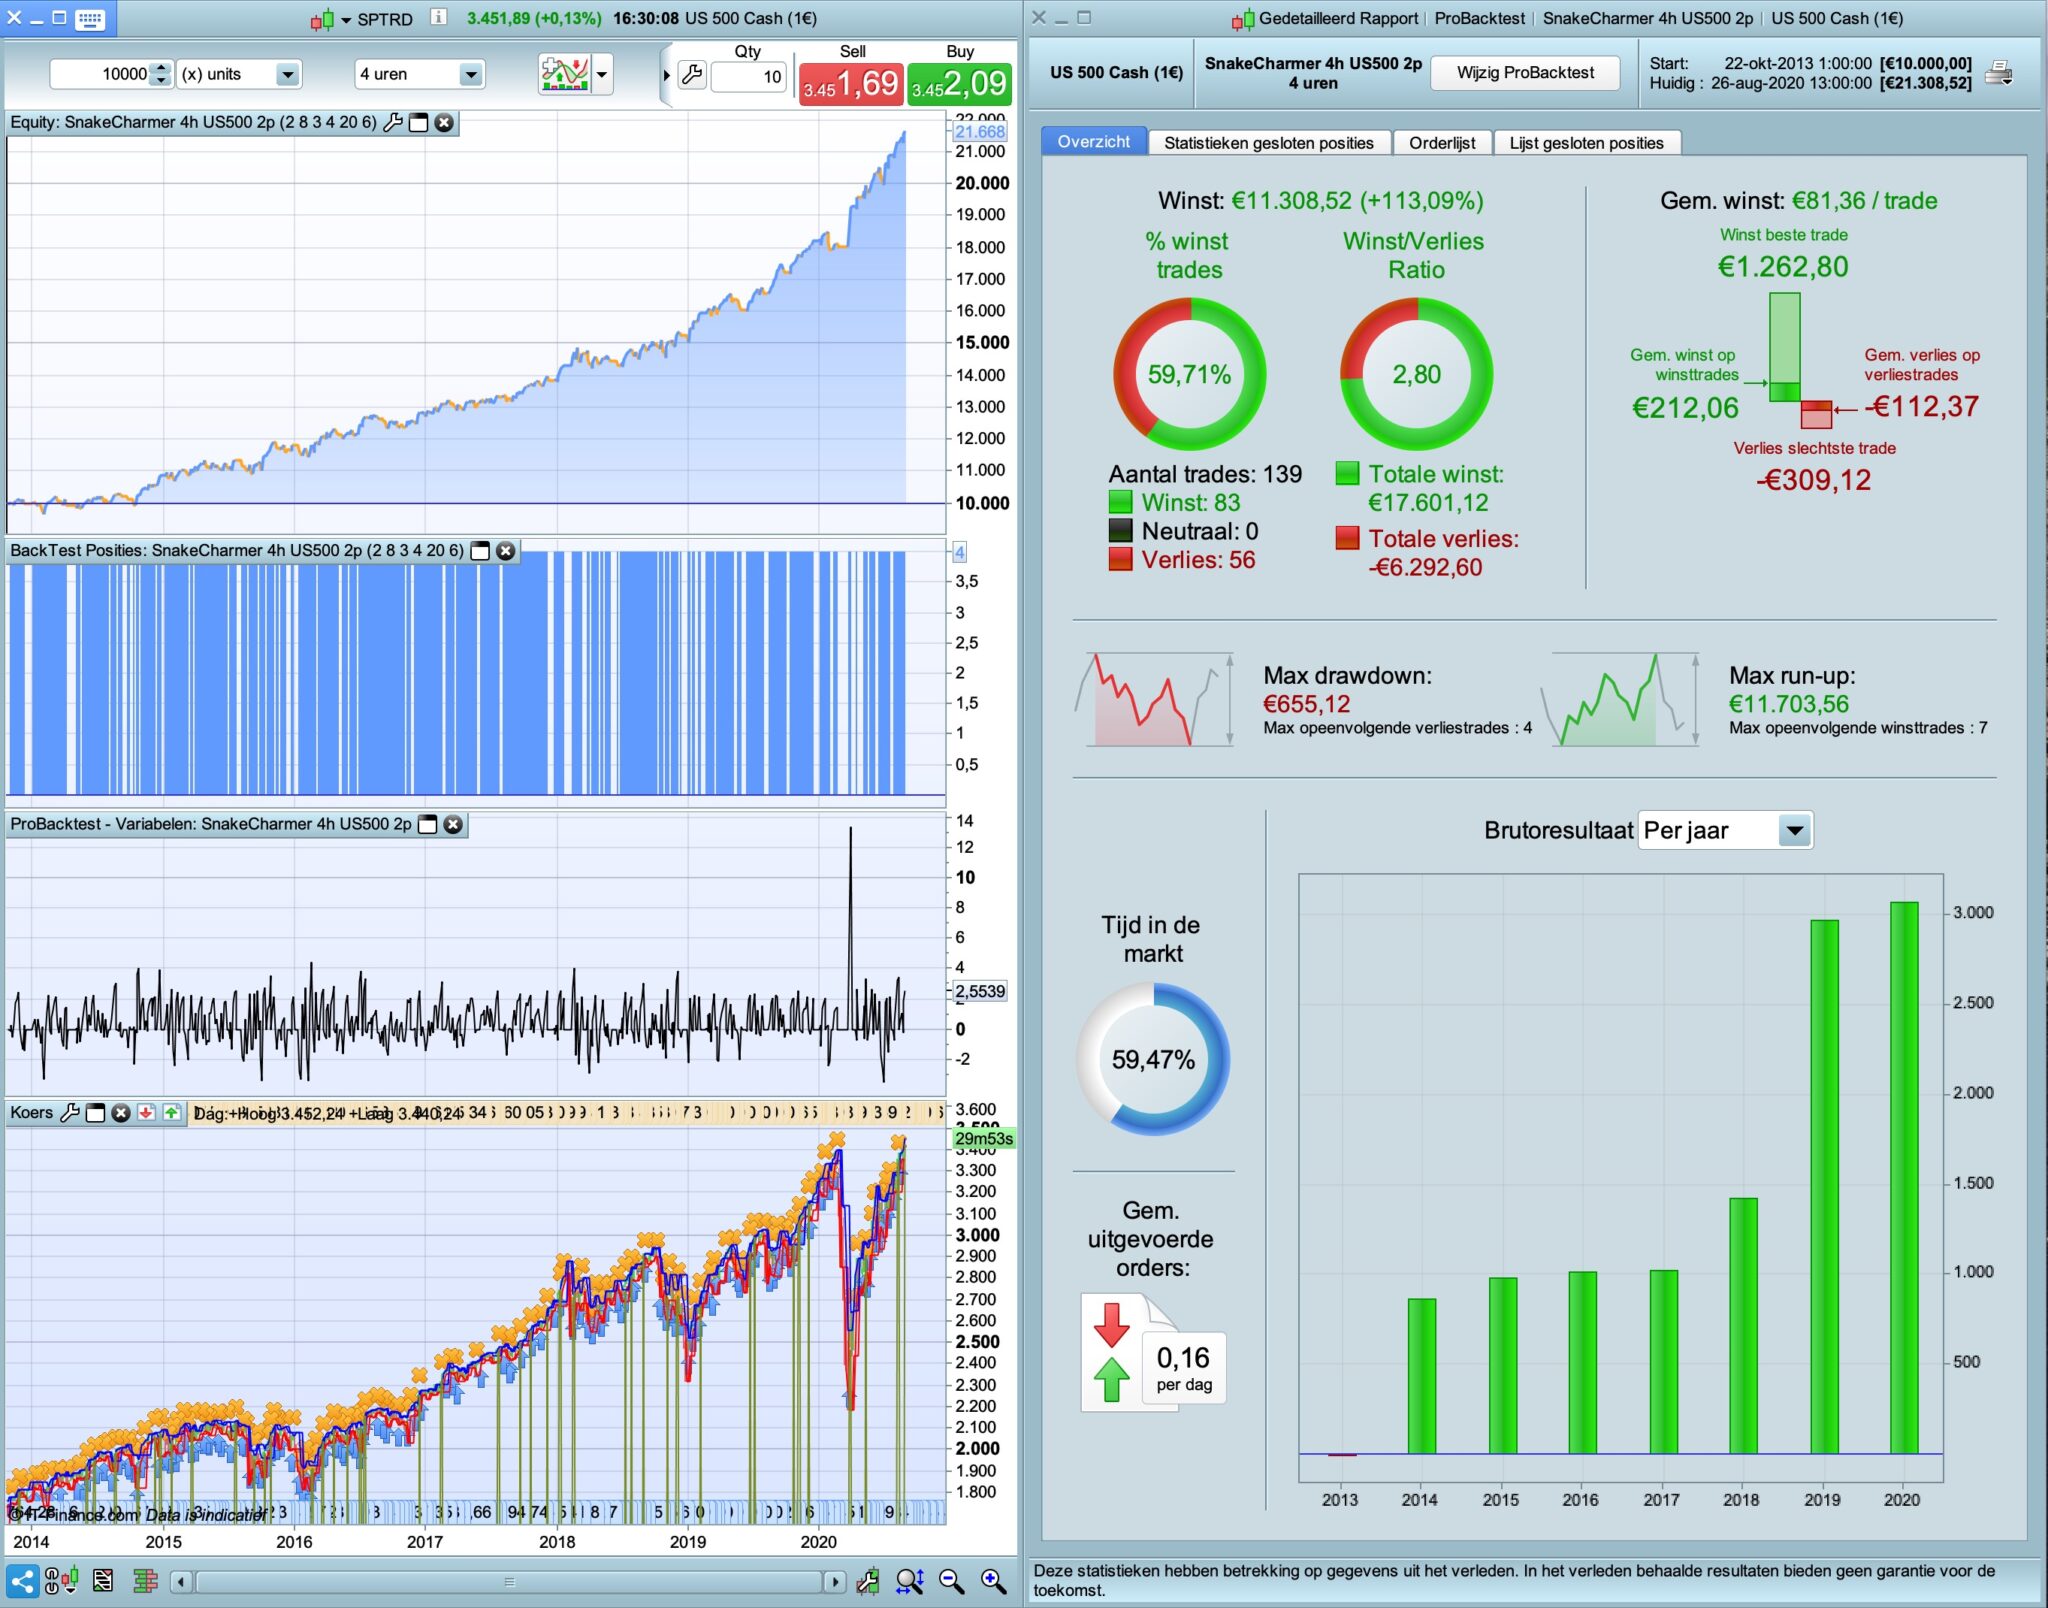
Picture is with 0.4 spread and on 250$ contracts (i got tons of trades open in the 1€ contract market. but i wanted to just show that it beats buy and hold (by alot if u take risk/reward into the picture. buy and hold has a huge drawdown in 2008 period vs this code.
So my whole idea behind this code was just if i buy every time close moves above MA 20, i would catch 100% all trends going up. And i wanted to sell when the momentum is changing from “trending up” to “trend might be done” without giving up too much.
Things that would improve it greatly:
- Reduce bad trades by adding filters to avoid choppy areas
- Increase avg win by adding filters/rules to get better entries
- Better money management
// Definition of code parameters
// SnakeCharmer V 1 - by user JEBUS89 ProRealCode 11.03.2019
DEFPARAM CumulateOrders = False // Cumulating positions deactivated


if onmarket and BARINDEX-TRADEINDEX(1)>=20 then
SELL AT MARKET
EXITSHORT AT MARKET
endif

set stop ploss 100


// Conditions to enter long positions
buysignal = (close CROSSES OVER Average[20](close))

IF buysignal THEN
BUY 1 CONTRACT AT MARKET
ENDIF

// Conditions to exit long positions
sellsignal = (close CROSSES under BollingerUp[20](close))

IF sellsignal THEN
SELL AT MARKET
ENDIF


//************************************************************************
// MFE trailing stop function
//************************************************************************
///trailing stop
trailingstop =  12
StartTrailingStopValue = 10

//resetting variables when no trades are on market
if not onmarket then
MAXPRICE = 0
priceexit = 0
endif


//case LONG order
if longonmarket then
MAXPRICE = MAX(MAXPRICE,close) //saving the MFE of the current trade
if close-tradeprice(1) > StartTrailingStopValue*pointsize then
if MAXPRICE-tradeprice(1)>=trailingstop*pointsize then //if the MFE is higher than the trailingstop then
priceexit = MAXPRICE-trailingstop*pointsize //set the exit price at the MFE - trailing stop price level
endif
endif
endif

//exit on trailing stop price levels
if onmarket and priceexit>0 then
EXITSHORT AT priceexit STOP
SELL AT priceexit STOP
endif
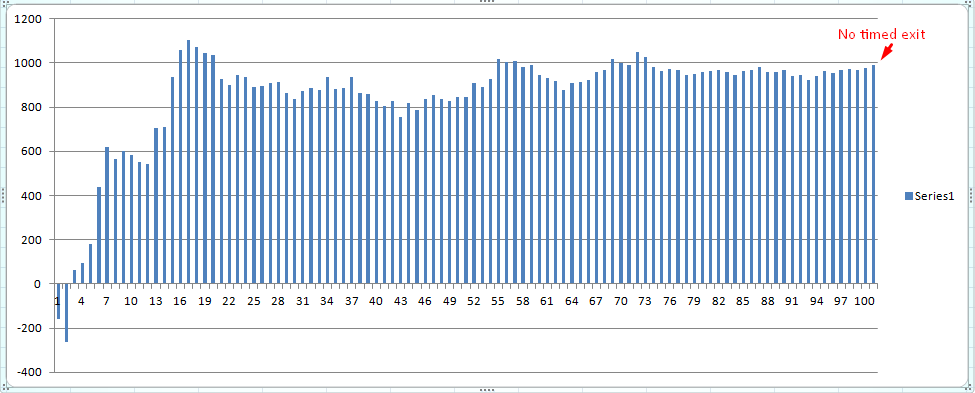
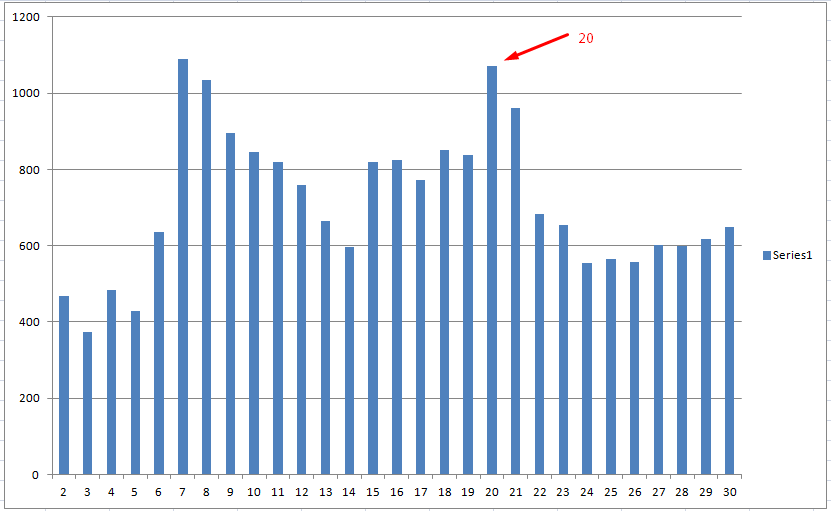
Nice and simple but I always get concerned when I see time based exits so I thought I would see how your strategy worked if the time based exit was anything from 1 to 100 bars long. Here are the results:
[attachment file=93341]
It can be seen that there is a strong potential for curve fitting with the value 20 and in fact 17 would give even better results but there is a definite band between 16 and 20 that just happens to have given nice results in the past. The good news is that across a wide range of timed exits it is still profitable. The last bar on the right shows the strategy gain with no timed exits at all. Personally I would remove the timed exit as it only seems to add some curve fitted exits and there is no guarantee that exiting after 16 to 20 bars in the future will add the same gains. It could in fact just happen to result in losses as time is rarely a good reason to exit a trade.
Hi Vonasi!
I Agree, every rule added is another way to curvefit! I added the timebased exit because the entry isnt good enough to always ensure that there will be enough momentum to reach the upper bollinger band.
Originally i used this rule for exit: “High crosses over bollup 20” which gave a lot smaller trades, but i got better avg gain with close crosses under, which is more biased towards “indexes always moving up in the long run” which of course might be a very dangerous thought.
I think with the correct filters in place and probably a better exit, one could see much better results! be sure to share if u got something 😀
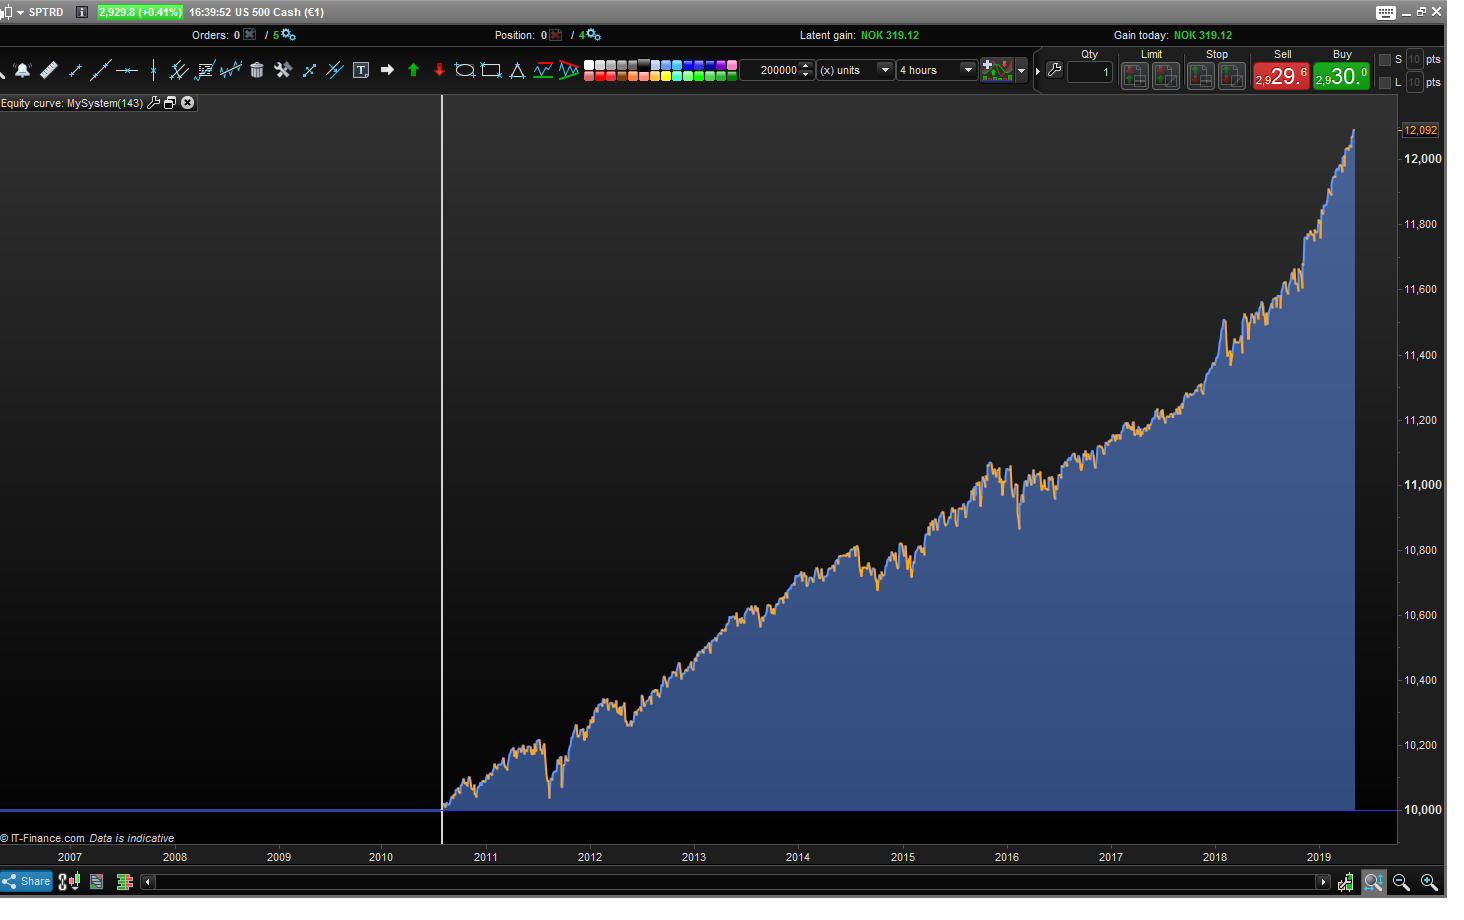
Btw check out this, removed all money management except stop loss and used another exit
n1 = 3
n2 = 80
// Definition of code parameters
// SnakeCharmer V 1 - by user JEBUS89 ProRealCode 11.03.2019
DEFPARAM CumulateOrders = false // Cumulating positions deactivated


// Conditions to enter long positions
buysignal = (close CROSSES over Average[20](close))


IF buysignal THEN
BUY 1 CONTRACT AT MARKET
ENDIF

// Conditions to exit long positions
sellsignal =  rsi[n1](close) crosses under n2 //(close CROSSES over BollingerUp[20](close))

IF sellsignal THEN
SELL AT MARKET
ENDIF
The last code looks OK for wall st 4 h as well, maybe more.. just re-optimize stop loss roughly and it dosnt look to shabby.
Again im looking for super simple non curvefitted systems that have 90%+ green years. Run enough of them and watch the profits come.. at least thats the gameplan hehe
I keep the “set stop ploss n1” and check for 20-200 with intervals 20. Looks OK on wall st 4h, US 500 4h, italy 4h.
And in the other markets it dosnt seem to completly break, like for example in spain when market dropped almost 60% in 2008, it didnt go broke.. which at least to me tells me that running this in for example US 500 shouldnt break your account within 1-2 months 😛
Sometimes it is quite possible to curve fit even the simplest of ideas. That last RSI3 strategy has quite fitted entry criteria. If you test either side of the average 20 then performance falls off and the straightness of the equity curve disappears and becomes a mountain range!
[attachment file=93354]
I hear u Vonasi! For what its worth the WF tests are looking good.
Hi,
I cam across this post as I was researching a similar idea and was curious to see how it was going? Has anyone committed this into production since?
Thanks very much,
S
 Paul
PaulParticipant
Master
Hi,
a nice code to curve-fit a bit more. This from MOD works well with it, on default timeframe or higher. I use it in range 2-4 for all 4 values.
timeframe (4 hours,updateonclose) // default 4 or 24
//Stochastic RSI | indicator
lengthRSI = aa //RSI period
lengthStoch = bb //Stochastic period
smoothK = cc //Smooth signal of stochastic RSI
smoothD = dd //Smooth signal of smoothed stochastic RSI
myRSI = RSI[lengthRSI](totalprice)
MinRSI = lowest[lengthStoch](myrsi)
MaxRSI = highest[lengthStoch](myrsi)
StochRSI = (myRSI-MinRSI) / (MaxRSI-MinRSI)
K = average[smoothK](stochrsi)*100
D = average[smoothD](K)
PaulParticipant
Master
here’s an example created on these basics above with added ts 1 or 2 %, stoploss 2-4% combined with taking profit & loss on support & resistance. (in pic stoploss 4%, ts 2%)
PaulParticipant
Master
a experimental way of using support & resistance