Hi All
I am new to prorealtime and must say that I am loving it and cant wait to get my first strategy uploaded.
I come from an r environment and have backtest a strategy using quantstrat with great success I would like to try and implement it in a live environment using prorealcode.
My problem is I am trying to duplicate code I have written in r to try and get a smoothed linear regression to identify the peaks and troughs.
Here is the r code
# Add increental sequence
EURUSD$row <- seq(1, nrow(EURUSD), 1)
#based on close price smooth out the high and lows
EURUSD$smoothed <- ksmooth(as.numeric(EURUSD$row) , EURUSD$Close, "normal", bandwidth = 5)$y
#creat a collotion of the peaks and troughs
peaks <- which(diff(diff(EURUSD$smoothed)>=0)<0)+1
troughs <- which(diff(diff(EURUSD$smoothed)>0)>0)+1

EURUSD$peaks <- 0
EURUSD$troughs <- 0
#return 1 if price is at the peaks or troughs
EURUSD$peaks <- ifelse(EURUSD$row %in% peaks, 1, EURUSD$peaks)
EURUSD$troughs <- ifelse(EURUSD$row %in% troughs,1, EURUSD$troughs)
What I need to know is there perhaps an indicator that performs a similar function or does anybody know how to do this by creating a custom indicator.
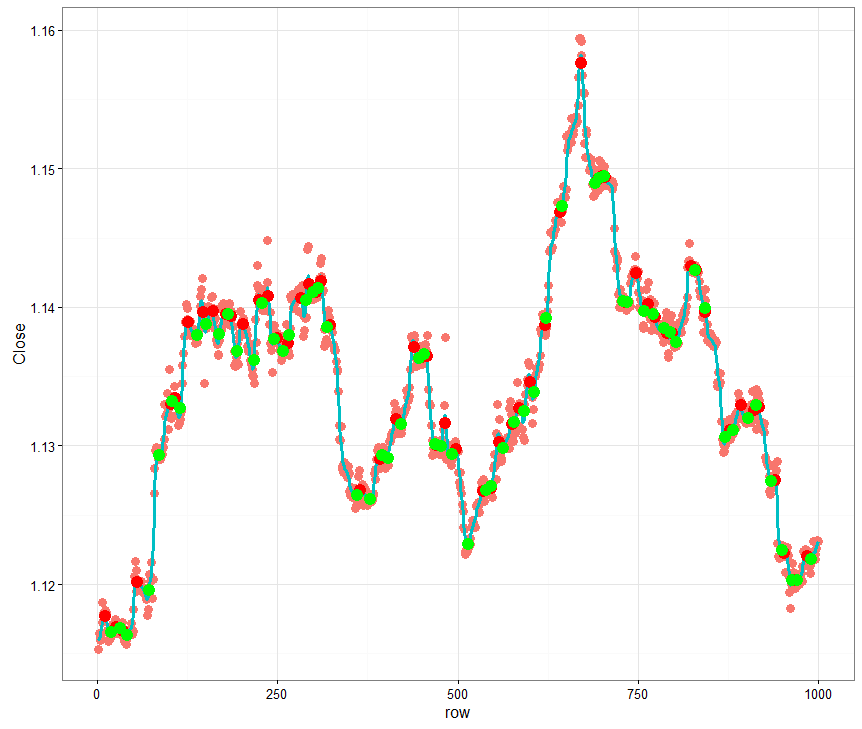
Here is a link to my blog to see the strategy, The picture attached is the desired results
http://conceptlab.co.za/2017/01/16/backtesting-an-engulfing-strategy-with-quanstrat/
Thanks
Hi Stanton, used to be involved in R years ago, I didn’t use the Quantstrat library myself though.
To identify your peaks and troughs, seems that you first smooth your data serie with a ksmooth function which is, accordingly to the R documentation, a Nadaraya–Watson kernel regression estimate..Well, to get the same, we first need to rewrite from scratch this function I’m afraid.
Might consider using something different or find the complete formula of this math function to recode it. I can help of course 🙂
Found interesting description of the kernel smooth function:
https://www.stat.berkeley.edu/~s133/Smooth-a.html
Kernel smoothers work by forming a weighted average of all the y-values corresponding to points whose x-values are close to the x-value of a point being plotted. The function that defines the weights is known as a kernel, and the number of points involved in the weighted average is based on a parameter known as the bandwidth. The default kernel is a box function; in other words, it simply averages together y-values which are within the specified bandwidth of a given x-value, and uses that average as the y-value for the x-value in question. With a very tiny bandwidth, this corresponds to a “connect-the-dots” type of drawing. With a very large bandwidth, it will basically estimate every y-value as the mean of all the y-values. However, even when the bandwidth is carefully chosen, using the box kernel rarely will result in a truly smooth graph.
So the bandwidth is the like-hood of all data serie to be considered to weight the average. But do the ksmooth curve take all history of Close values to compute completely or do we only use some few of them (last X periods)?
Hi Nicolas
Thanks for the advice.
In my opinion we would need to use the whole data series in order to calculate it correctly.
Here is the actual ksmooth function
function (x, y, kernel = c(“box”, “normal”), bandwidth = 0.5,
range.x = range(x), n.points = max(100L, length(x)), x.points)
{
if (missing(y) || is.null(y))
stop(“numeric y must be supplied.\nFor density estimation use density()”)
kernel <- match.arg(kernel)
krn <- switch(kernel, box = 1L, normal = 2L)
x.points <- if (missing(x.points))
seq.int(range.x[1L], range.x[2L], length.out = n.points)
else {
n.points <- length(x.points)
sort(x.points)
}
ord <- order(x)
.Call(C_ksmooth, x[ord], y[ord], x.points, krn, bandwidth)
}
I will keep looking at the problem but I am sure there must be an indicator that does something similar.
Thanks
Hi There
Found this.
Indicator1 = SmoothedStochastic[9,9](MedianPrice)
Indicator2 = ExponentialAverage[9](Indicator1)

c1 = (Indicator1 >= Indicator2)
IF c1 THEN
smoothed = 1
ENDIF
REM Enter short conditions
IF NOT c1 THEN
smoothed=-1
ENDIF
return Indicator1 , Indicator2,smoothed
Looks like it might be usefull.
How to I overlay this over the candlestick it currently displaying below the main chart.
Smoothed can display below but I would like the other indicators to overlay the candlesticks
Thanks
I’m sorry but the prorealtime indicator code you shared has nothing to deal with the original Ksmooth function of R. You can’t display it on chart, since it returns a classic oscillator named ‘stochastic’.
Though, the main idea behind a stochastic is the same as the R’ Ksmooth function: calculate the price mean and evaluate if the price is far or close to it.
An ALMA moving average could be useful, since it is calculated within a gaussian filter (what Ksmooth named ‘bandwidth’), but it would need the whole history to compute, I’ll look further into this one and let you know.
About peaks and troughs, how does the original code find them?
Seems like I’m near something, could you please tell what time periods this picture from your blog is displaying? from date xxxxxx to date yyyyyy, please.
The date range was between 2016-03-25 to 2017-01-11
This line create a sec from 1-4999 as there was only 5000 rows returned 1 hour time frame
EURUSD$row <- seq(1, nrow(EURUSD), 1)

This line create a smoothed price based on the close price and bandwith
EURUSD$smoothed <- ksmooth(as.numeric(EURUSD$row) , EURUSD$Close, "normal", bandwidth = 5)$y

The creates a collection of Peaks ie [1 , 244 , 355]
peaks <- which(diff(diff(EURUSD$smoothed)>=0)<0)+1

This creates a collection of troughs [3, 100, 255]
troughs <- which(diff(diff(EURUSD$smoothed)>0)>0)+1

EURUSD$peaks <- 0
EURUSD$troughs <- 0

Loop through data and if row number is in peaks set peaks = 1 else 0
EURUSD$peaks <- ifelse(EURUSD$row %in% peaks, 1, EURUSD$peaks)
Loop through data and if row number is in troughs set troughs = 1 else 0
EURUSD$troughs <- ifelse(EURUSD$row %in% troughs,1, EURUSD$troughs)

I actually got the idea of peaks and troughs from this video
https://www.youtube.com/watch?v=hKDalfhDawA
Date Range on this picture 2016-03-24 11:00 to 2017-01-11 06:00:00 5000 hourly records
Well I’m stuck with the Ksmooth function under ProBuilder, mainly because of the ‘infinite loop’ error.
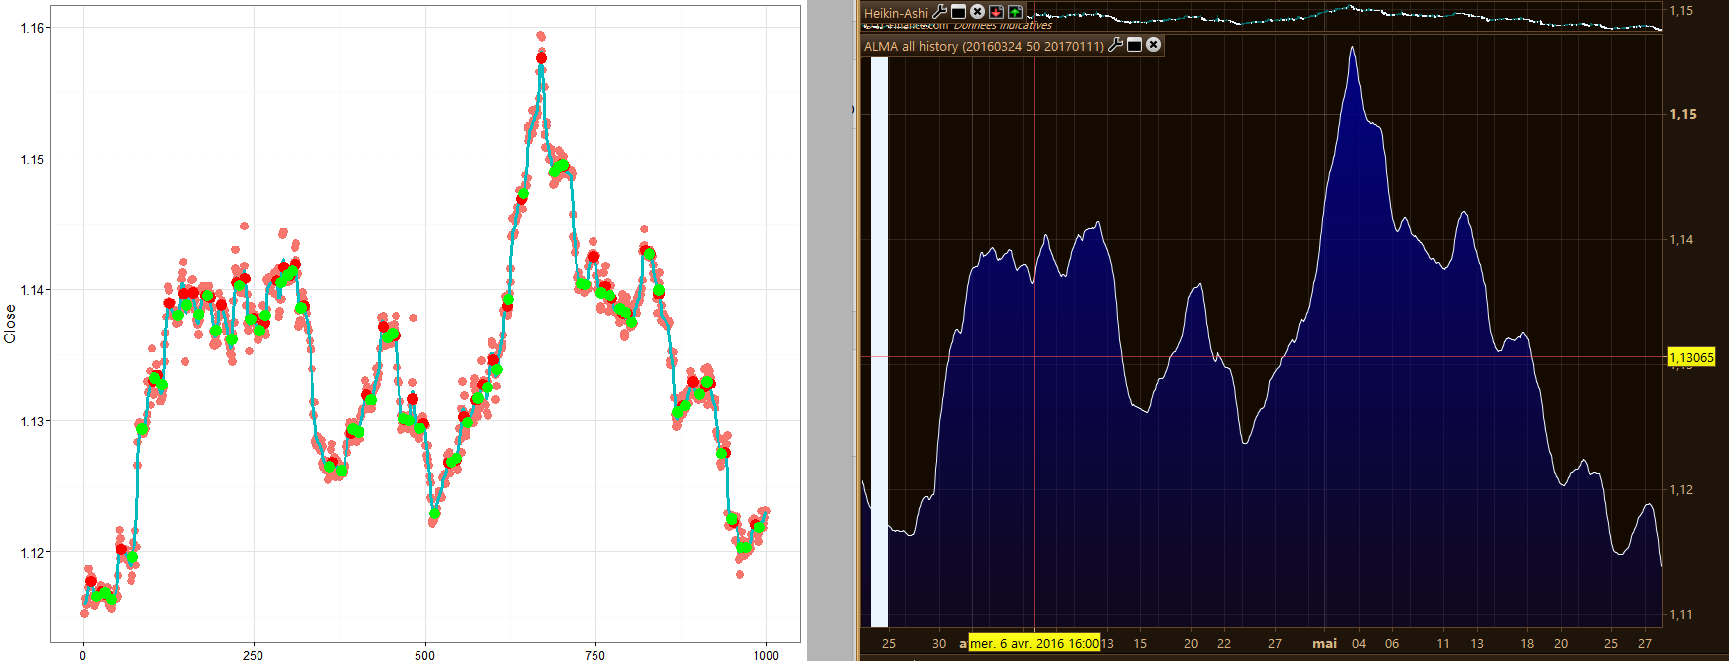
So I just made a smooth curve from ALMA average within last X periods. It would be any kind of moving average though, we can get close to your ksmooth curve by adapting MA type and periods too..
Your curve image with red/green points of peaks and toughs is only displaying 1000 rows, not all your tested data serie. Screenshot attached for comparison.
So now, next step should be find peaks and troughs which are .. what exactly? Only a comparison of the curve data to find u-turn?
Hi Nicolas
I think we going down a rabbit hole here. I appreciate all your help.
I have actually started using the Murray Math lines to identify the pivot points which seems to be working alot better.
The peaks and troughs basically just identified high percentage reversal areas.
You caparison is spot on.
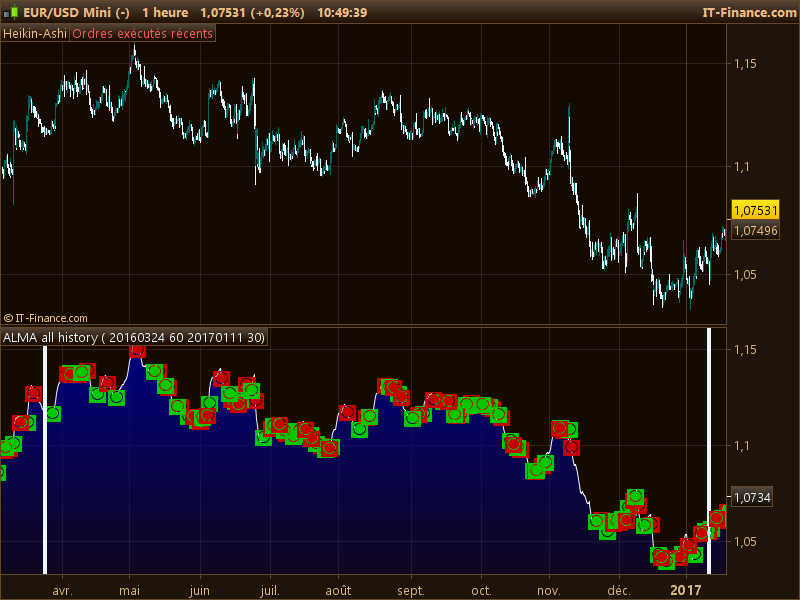
Ok, please find attached the code made so far (indicator).