Paul
PaulParticipant
Master
here’s a go with a sample strategy and exit based on %.
I’ve no idea if it works correctly. (dow 1m)
//sample core trading strategy --------------------------------------------------
daysOK = dayofweek<>6 and dayofweek<>0
timeOK = time>080000 and time<180000
GeneralCondOK = daysOK and timeOK

indicator1 = Average[5](RSI[14](typicalprice))

condbuy = indicator1 crosses over 20 and close>totalprice
condbuy = condbuy and GeneralCondOK

once sl=0.40
once pt=0.45

once trade=0

if condbuy[1] and trade=0 then
storeprice=open+Halfspread
trade=1
endif

if trade=1 then
simpt=high crosses over storeprice+((storeprice*pt)/100)
simsl=low crosses under storeprice-((storeprice*sl)/100)
endif

if trade=1 and (simpt or simsl) then
trade=0
endif

//entry and exit signals
BuyLong  = condbuy
ExitLong = simpt or simsl
// end of sample trading strategy  ------------------------------------
Just a thought, could you treat the simulated equity-curve as it would be an index? And perhaps use it like something described in Expert Systems with Applications by Simon Fong (among others)? (I don’t know if it’s allowed to post links, otherwise just google the title mentioned).
Or is that an awful idea..?
 Link
LinkParticipant
Senior
The code as difficult.
Please, we can include the simulated trading on Vectorial or MOD strategies?
To example.
I think that’s a good idea! You could for example use this code to run a strategy different from the live trading strategy and compare both strategies.
Of course. There is a vectorial blog, too. Just post a link of the virtual trading algo and ask around. I am sure someone is willing to give it a try. 🙂
Here’s another idea:
Instead of turning the strategy on/off, you can change the contract size!
I just tried this on a couple of ways, one that actually reduced the draw-down of an already good strategy, but didn’t make the gain better. In this case I simply had 0.5 contracts when the equity-curve was below the average equity-curve, and 1 contract when it was above.
In another variant (the same strategy) I took the different in percentage between the equity curve and the avg. EQ, and then took that data into the contract size. The size then varied between 0.64 – 1.94. This strategy also had a lower draw-down than the original 1 contract strategy, but actually also had higher total gain. Wow, first time! 🙂 (I know, it’s probably just curve fitting, but it’s fun!)
Great! Thank you for keeping us informed. Reducing DD is always a top priority when developing trading algos. It’s a good idea to work with the position size.
How did you define “average equity curve”? Did you calculate any moving average on the equity curve?
Yes exactly. Saved the equity curve in an array, and then calculated an average from that.
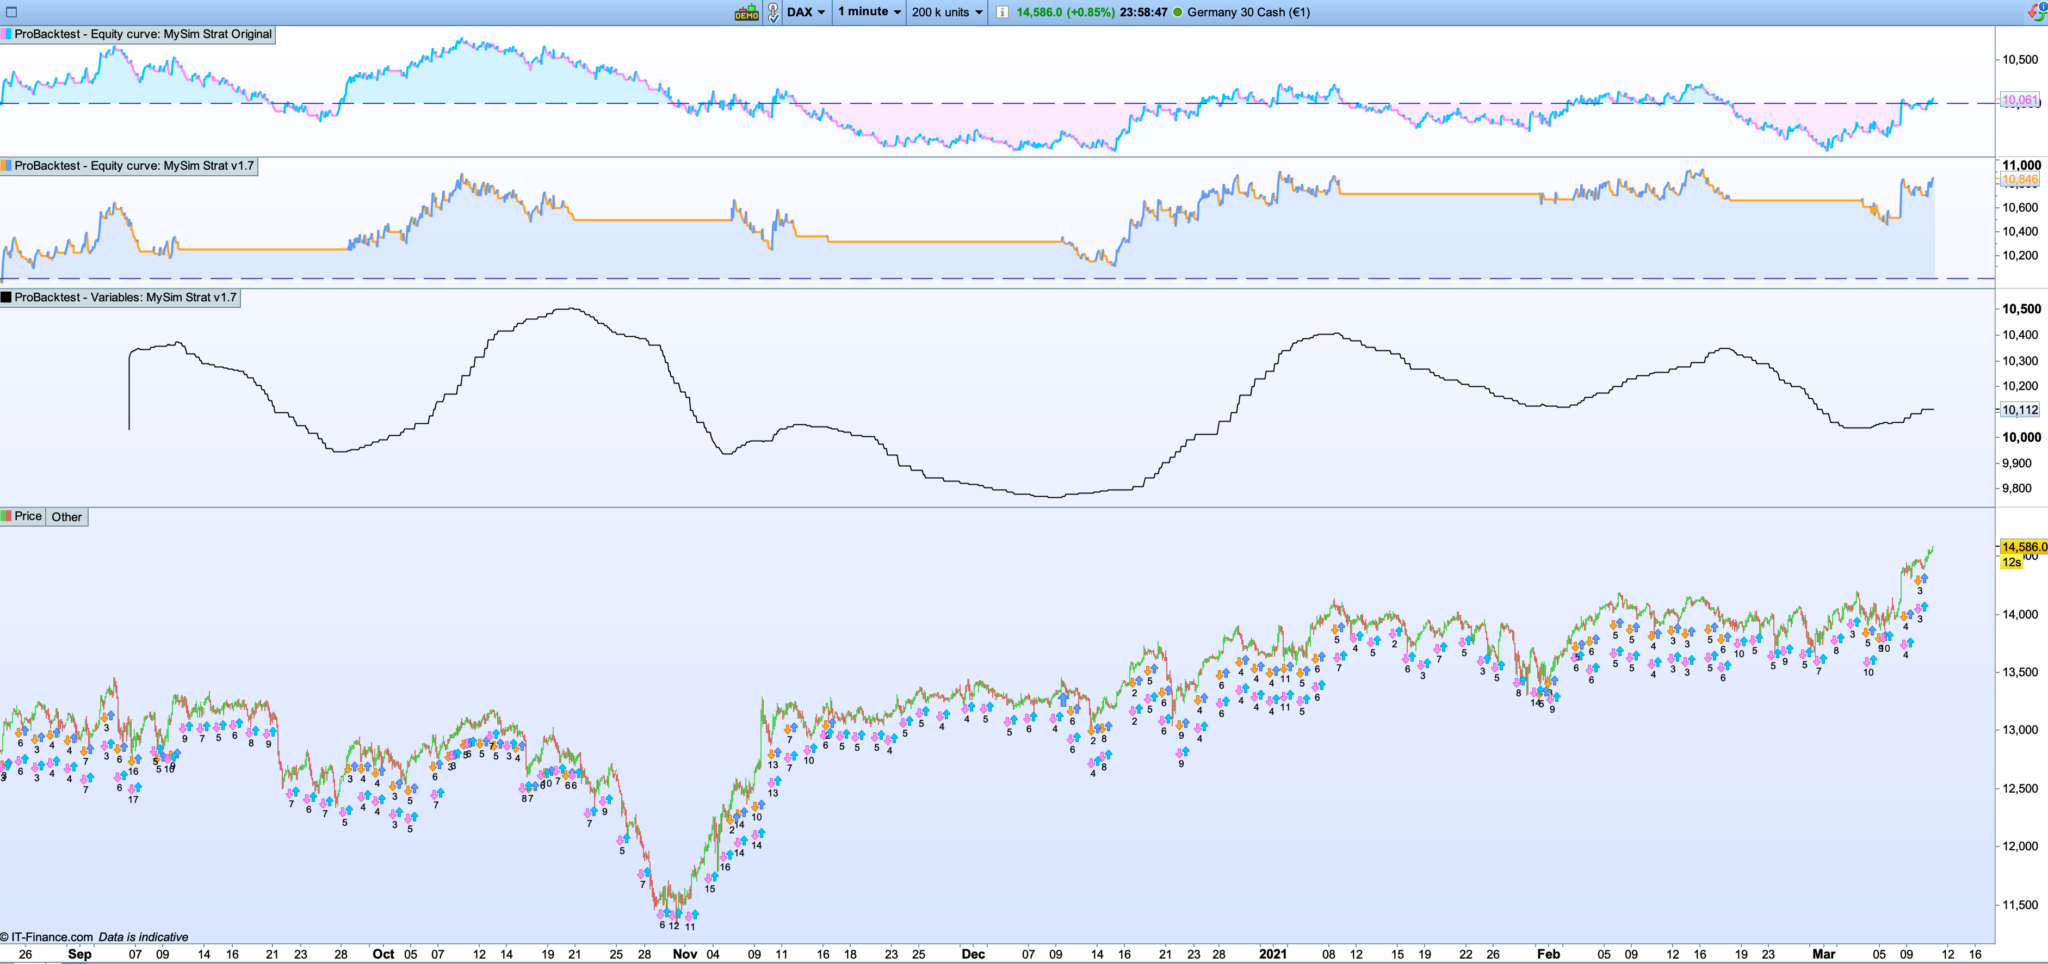
I tried a new way; take the average of the equity curve, and simply stop the strategy when it has a downward slope, and start it when it is going up. In a good working strategy, this is probably nothing that would make it better, more likely worse. So instead, I took the strategy I have experimentet with the above variants and changed the timeframe from the original 5 min to 1 min. It now performs poorly, and the total gain went from around 15% to 0%.
The screenshot shows the original strategy on top, and the one based on the slope of the avg. simulated equity curve below. The curve in the middle shows the average equity curve.
The result is far from satisfying, but I still think it is a bit interesting, and perhaps something to develop further. It should also be said that the lag between the real equity curve and the simulated is a bigger when I changed it to 1 min than the original 5 min. So I have some work to do there as well.
But again, it’s most likely all curve fit…
Instead of turning the strategy on/off, you can change the contract size!
Your idea is really just the same as basic money management. If we are winning then increase position size and if we are losing decrease position size. The only real difference is that you are curve fitting an average period on your equity curve to adjust the size with. Every time you add any condition or any variable to a strategy you are just curve fitting it one step more… whether that is an average[p] of price or an average[p] of equity.
LinkParticipant
Senior
Im working to introduct the code on vectorial code.
Good Idea. The vectorial is a good code. If you share once the code is working, we can help optimize it. 🙂
This looks very interesting. Can you run it over 1mln candles? If not, I can help.
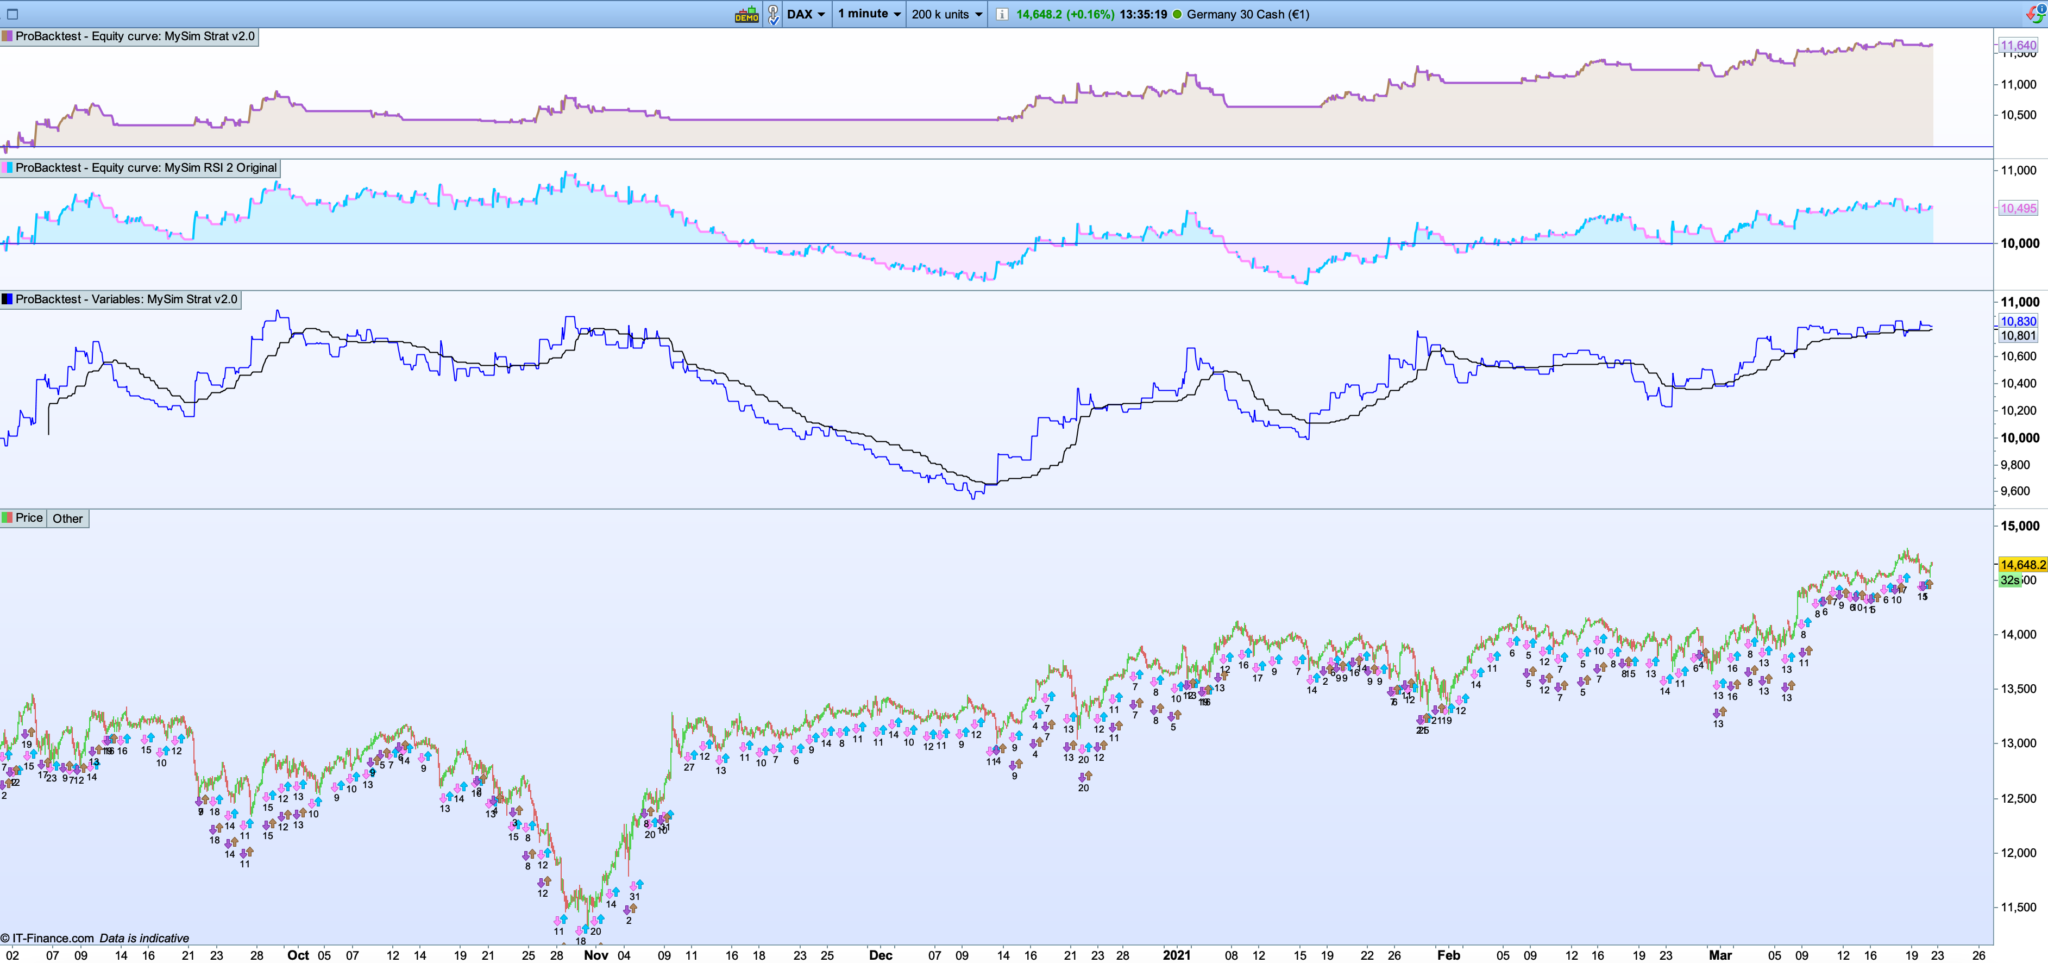
I have now added short trailing stop as well, so now it’s both long and short. I tested this on a simple RSI-2 strategy on 1 min timeframe on DAX. The conditions for stopping/starting the strategy is the same as my previous post.
The variables in the middle – the blue line is the simulated equity curve. It’s not perfect compared to the original strategy, but it follows the ups and downs pretty good. The black line is the average (20 periods) of the blue line.
I think the result is quite interesting.