Link
LinkParticipant
Senior
Please, i need code to simulate trading when the system are on drawdown.
I see articles, but not a real code to this.
I think Vonasi equivocate, this a great idea.
Up with simulated trading.
Down with not simulated trading.
I think Vonasi equivocate, this a great idea.
My views on it have varied but I think my overwhelming thoughts on simulated trading is that it can be just another thing to curve fit. A decision has to be made on what is to be used as the filter that switches trading on and off and we inevitably choose this by curve fitting the filter to history to see what worked best.
Just started to analyse this problem.
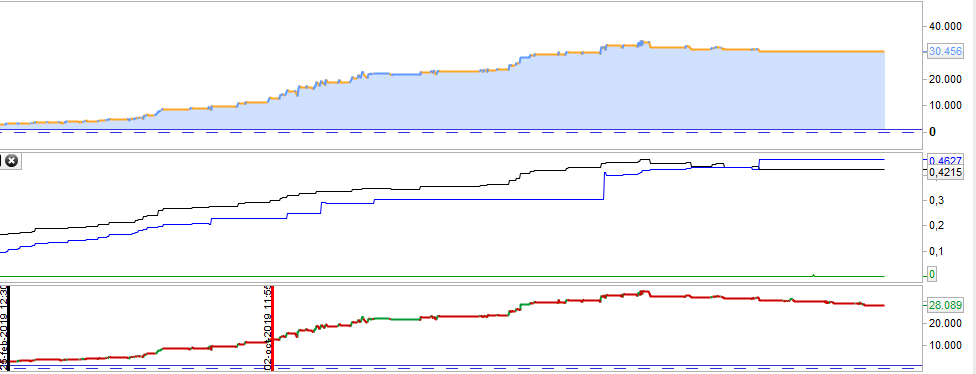
Coded a Trading system with graphical output of Equity Curve, Drawdowns and Drawdown Candles to better understand how PRT works and calculates variables.
Next step is to replace system variables with own variables to enable simulated trading.
I hope the code helps! 🙂
// EquityDD_SystemVariables (Reference Algo!)
// 27.02.21

// We use the system STRATEGYQUIT variable to cease trading once our max drawdown
// barrier as of backtesting has been touched. Problem: we are not able to restart
// trading automatically, again.

// Our intention is to replace the "STRATEGYQUIT" variable by an own virtual
// strategy quit, enabling us to restart trading automatically.
// Restarting trading will depend on parameters we see fit telling us that the
// robot is back on its usual trading behaviour. For this analysis the number of
// drawdown candles might come in handy! So we want to track these candles, too!

// In a nutshell: we have to analyse how the the robot would have continued trading
// after a strategy quit event!

// Problem is to get this data without real trading! Instead we have to proceed with
// a virtual trading algo delivering same results as in real trading!

// This trading robot is a first step in recalculating Equity Curve, Drawdown,
// MaxDDCandles and MostDDCandles by using system variables "LONGONMARKET",
// "TRADEPRICE", "BUY" and SELL"!

// USE THIS ROBOT TO GET FAMILIAR WITH PROPER CALCULATION ALGOS FOR THE FOUR
// SYSTEM VARIABLES MENTIONED ABOVE!

// USE THE "GraphSWITCH" TO SEE THE RESULTS OF THE CALCULATIONS!!

// *** Copy This algo to a new robot and try to replace system variables! ***//

// GOOD LUCK! :)


//DEFPARAM CumulateOrders=false
DEFPARAM PreLoadbars = 0

//Variables and SWITCHES
Once Equity = 10000      //chose your equity or set to "0"
Once Spread = 2          //You can set a backtesting spread here!
Halfspread  = Spread/2
Once Ordersize = 1

//select graph output
GraphSWITCH=1           //1=Equity 2=maxDD 3=MaxDDCandles+MostDDCandles


//sample core trading strategy ------------------------------------------------
daysOK = dayofweek<>6 and dayofweek<>0
timeOK = time>080000 and time<180000
GeneralCondOK = daysOK and timeOK

indicator1 = Average[3](RSI[14](close))
buyL1  = indicator1 crosses over 30
exitL1 = indicator1 crosses over 40 or indicator1 crosses under 20

//entry and exit signals
BuyLong = GeneralCondOK and buyL1
ExitLong = exitL1
// end of sample trading strategy  --------------------------------------------


//STEP 1: entry long
IF NOT LongOnMarket AND BuyLong THEN
buy Ordersize contract at market
ENDIF

//STEP 2: during long trade
IF LongOnMarket THEN
LongPrice=Tradeprice  //Halfspread included!!
TradePL=(close-LongPrice)
Equity=Equity+TradePL -TradePL[1]

//check on new equity high / Runup high
IF Equity>RunupLevel THEN
RunupLevel=Equity
RunupIndex=BarIndex
DDLevel=RunUpLevel
ENDIF

IF Equity<DDLevel THEN
DDLevel=Equity
ENDIF

//calculate DD (negativ sign) depending on algebraic signs
IF    RunupLevel>0 AND DDLevel>0 THEN
DD = -(RunupLevel - DDLevel)
ELSIF RunupLevel>=0 AND DDLevel<0 THEN
DD =-RunupLevel+DDLevel
ENDIF

IF DD<MaxDD THEN
MaxDD=DD
ENDIF
ENDIF

//STEP 3: count DD candles
MaxDDCandles = BarIndex-RunupIndex
IF MaxDDCandles>MostDDCandles THEN
MostDDCandles=MaxDDCandles
ENDIF

//STEP 4: exit long trade
IF LongOnMarket and ExitLong THEN
sell at market
LongPrice=0
TradePL=0
ENDIF

//STEP 5: after exit at open price adjust equity
IF LongOnMarket=0 and LongOnMarket[1]=1 THEN
openclosediff = open-close[1]
Equity = Equity + openclosediff-Halfspread
ENDIF


//RESULTS/////////////////////////////////////////////////////////////////////////
//GRAPH FUNCTIONS ----------------------------------------------------------------

IF GraphSWITCH=1 THEN
Graph Equity as "Equity"
ELSIF GraphSWITCH=2 THEN
Graph MaxDD coloured(200,0,0) as "MaxDD"
Graph DD coloured(150,0,0) as "DD"
Graph RunupLevel coloured(0,0,200) as "RunupLevel"
graph DDLevel as "DDLevel"
ELSIF GraphSWITCH=3 THEN
//Graph DDCandles as "DDCandles"
Graph RunupIndex coloured(0,200,0) as "RunupIndex"
Graph MaxDDCandles coloured(200,0,0) as "MaxDDCandles"
Graph MostDDCandles coloured(250,100,100) as "MostDDCandles"
ENDIF
LinkParticipant
Senior
A first idea:
When the system reaches a 5% drawdown from Maxprofit, it stops operating with real money and begins to simulate operations.
Only return to real money trading if it exceeds Maxprofit.
LinkParticipant
Senior
https://www.prorealcode.com/blog/learning/how-to-improve-a-strategy-with-simulated-trades-1/
Maybe we could study this old idea and article by Nicolas with the idea of doing it with Maxprofit and drawdown instead of moving average equity curve.
I think the base of Nicolas’ code is good and could be reprogrammed with Pedro’s code.
LinkParticipant
Senior
I honestly think that not enough interest has been given to simulated operations, except for a few Vonasi codes.
I think that simulated operations can be very important in many strategies, although the idea of Nicolas in his code with moving average equity curve I do not think it is the best.
The Maxprofit and drawdown thing could work very well.
But I am sure that the members of this forum could have very good and different ideas.
Using an average of the equity curve or just stopping trading after too many losses or even just one big loss are all not viable working options.
The problem with averaging an equity curve is that you curve fit the average period to history to get the best result but the future does not care about what period of equity average worked best in the past.
The problem with stopping trading after a few losses or even just one big loss is that the next few trades could all be winners and then your simulated trading tells you to get back on the market just in time for the next series of losers or the next big loser. You can just as easily simulate your way to hitting every loser and missing every winner as you can simulate your way to hitting more winners than if you took every trade.
It’s better to create a robust strategy than look to something like simulated trading to turn a donkey into a racehorse I think…. plus simulating strategies with things like partial closure and trailing stop losses can be a lot of work to create with very complicated code and also not totally accurate due to not knowing exact entry and exit prices because spread, slippage and fees of real trades can not be known.
Maybe it could be easier than it seems.
We program two indicators:
The first calculates the Maxprofit of the system, and when an operation fails, it PAUSES the system or operates with the minimum accepted by the broker (example, Dax € 0.5).
The second calculates the Maxprofit of the system, but when the first indicator fails an operation it continues calculating the performance of the simulated operations. When the second indicator crosses above the first indicator the system returns to real money trading or trading the usual € pip amount.
Yes it is perfectly doable and really only requires one indicator and one strategy…. but you have to ensure that the indicator and the strategy stay in synch – which is harder than you think. When the strategy and the indicator have a position open is is possible for the indicator to keep its position open and the strategy to close its position due to the difference between real spread and simulated spread. Then the strategy could open a new position whilst the simulation is still holding the old position. Also with varying spread and real life slippage and fees simulated profit and loss can be very different to actual profit and loss so we could be basing our decision to keep trading switched on when losses are actually much bigger than we think.
It is better to have a simulated indicator that looks at and analyses every possible trade that there could be (so even ones that the real strategy missed because it already had a position open) and then use this as a filter to turn on or off trading. With this method we can see much more quickly if a strategy idea is quite simply failing or stops working due to a change in the character of the market. Simulating every possible trade in an indicator can be difficult to code if a strategy is very complicated.
OK, an idea.
In Pedro’s code:
Program 2 indicators, the first to operate with real money only when EQUITY is above DDLEVEL.
The second to keep track of simulated operations, and when Equity is again above DDLEVEL in simulated operations, it will return to real operations.
In this way we have two exactly the same performance indicators
Tony40 – Please try not to use rude words in the forums. Your post has been deleted.
You don’t need two indicators. You need one strategy and one indicator or just one strategy with simulated trading built in.
Personally I’d go for one indicator that records the reults of every possible trade (even ones that the strategy would miss because it was already on the market) and then one strategy that just uses an on/off signal called from the indicator…. but as I said before I don’t see much if any benefit to adding simulated trading to a strategy as it can just as easily keep you in for every loser and out for every winner as it can improve performance.
// --------------------------------------------------------------------------//
// EquityDD_OwnVariables_L //
// --------------------------------------------------------------------------//
// [EquityDD_SystemVariables_L (Reference Algo!)]
// 28.02.21
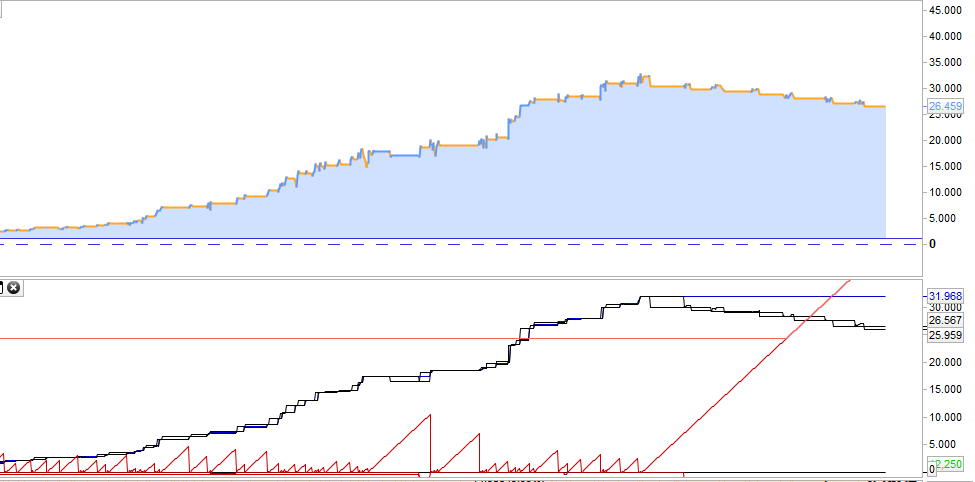
// This robot simulates trading and calculates the equity curve, maxDD and max
// drawdown candles. The algo is supposed to be used when trading shall be put
// at hold for a certain time but information is required how a core trading
// strategy would have performed during that trading hold.
// The information gathered from simulated trading might be helpful to decide
// when trading should be considered to be restarted!
// USE THE "GraphSWITCH" TO SEE THE RESULTS OF THE CALCULATIONS!!
// KNOWN ISSUES / LIMITATIONS:
// - DEFPARAM PRELOADBARS must be set to "0"!! - Can somebody tell me why?!?!
// - no parameters included for currency trading
// - or trading other contractsizes than "1"
// - no short trading so far
DEFPARAM CumulateOrders=false
DEFPARAM PreLoadbars = 0
//Variables and SWITCHES
Once Equity = 0 //chose your equity or set to "0"
Once Spread = 2 //You can set a backtesting spread here!
Halfspread = Spread/2
Once Ordersize = 1
//select graph output
GraphSWITCH=3 //1=Equity
//2=maxDD - set "ONCE equity=0" to improve graph layout
//3=MaxDDCandles+MostDDCandles
//sample core trading strategy ------------------------------------------------
daysOK = dayofweek<>6 and dayofweek<>0
timeOK = time>080000 and time<180000
GeneralCondOK = daysOK and timeOK
indicator1 = Average[3](RSI[14](close))
buyL1 = indicator1 crosses over 30
exitL1 = indicator1 crosses over 40 or indicator1 crosses under 20
//entry and exit signals
BuyLong = GeneralCondOK and buyL1
ExitLong = exitL1
// end of sample trading strategy --------------------------------------------
///////////////////////////////////////////////////////////////////////////////
//VIRTUAL TRADING! ///////////////////////////////////////////////////////////
//STEP 1: entry long
IF NOT LongInMarket[2] AND BuyLong[1] THEN
LongInMarket=1
LongEntryPrice = open + Halfspread
ENDIF
//STEP 2: during long trade
IF LongOnMarket THEN
LongPrice=LongEntryPrice
TradePL=(close-LongPrice)
Equity=Equity+TradePL -TradePL[1]
//check on new equity high / Runup high
IF Equity>RunupLevel THEN
RunupLevel=Equity
RunupIndex=BarIndex
DDLevel=RunUpLevel
ENDIF
IF Equity<DDLevel THEN
DDLevel=Equity
ENDIF
//calculate DD (negativ sign) depending on algebraic signs
IF RunupLevel>0 AND DDLevel>0 THEN
DD = -(RunupLevel - DDLevel)
ELSIF RunupLevel>=0 AND DDLevel<0 THEN
DD =-RunupLevel+DDLevel
ENDIF
IF DD<MaxDD THEN
MaxDD=DD
ENDIF
ENDIF
//STEP 3: count DD candles
MaxDDCandles = BarIndex-RunupIndex
IF MaxDDCandles>MostDDCandles THEN
MostDDCandles=MaxDDCandles
ENDIF
//STEP 4: exit long trade
IF (LongInMarket[2] and ExitLong[1]) or (BuyLong[2] and ExitLong[1]) THEN
LongInMarket=0
LongExitPrice = open - Halfspread
openclosediff = LongExitPrice-close[1]
Equity = Equity + openclosediff
//reset
LongPrice=0
TradePL=0
ENDIF
//END OF VIRTUAL TRADING /////////////////////////////////////////////////////////
//////////////////////////////////////////////////////////////////////////////////
//////////////////////////////////////////////////////////////////////////////////
//Live Trading ///////////////////////////////////////////////////////////////////
//entry long
IF NOT LongOnMarket AND buyLong THEN
buy Ordersize contract at market
ENDIF
//exitLong
IF LongOnMarket and ExitLong THEN
sell at market
ENDIF
//END OF LIVE TRADING ////////////////////////////////////////////////////////////
//////////////////////////////////////////////////////////////////////////////////
//RESULTS/////////////////////////////////////////////////////////////////////////
//GRAPH FUNCTIONS ----------------------------------------------------------------
IF GraphSWITCH=1 THEN
Graph Equity as "Equity"
ELSIF GraphSWITCH=2 THEN
Graph MaxDD coloured(200,0,0) as "MaxDD"
Graph DD coloured(150,0,0) as "DD"
Graph RunupLevel coloured(0,0,200) as "RunupLevel"
graph DDLevel as "DDLevel"
ELSIF GraphSWITCH=3 THEN
//Graph DDCandles as "DDCandles"
Graph RunupIndex coloured(0,200,0) as "RunupIndex"
Graph MaxDDCandles coloured(200,0,0) as "MaxDDCandles"
Graph MostDDCandles coloured(250,100,100) as "MostDDCandles"
ENDIF
//eof-----------------------------------------------------------------------------