Razz
RazzParticipant
Master
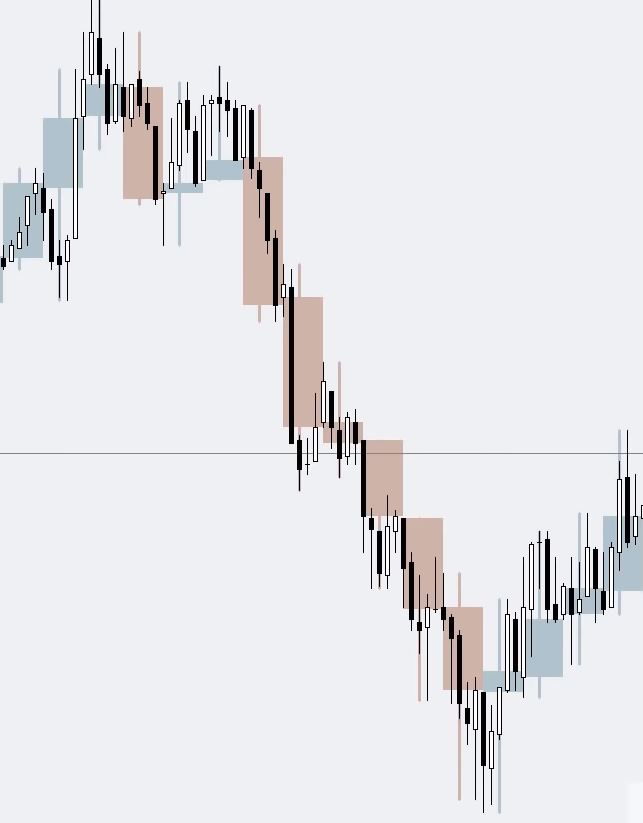
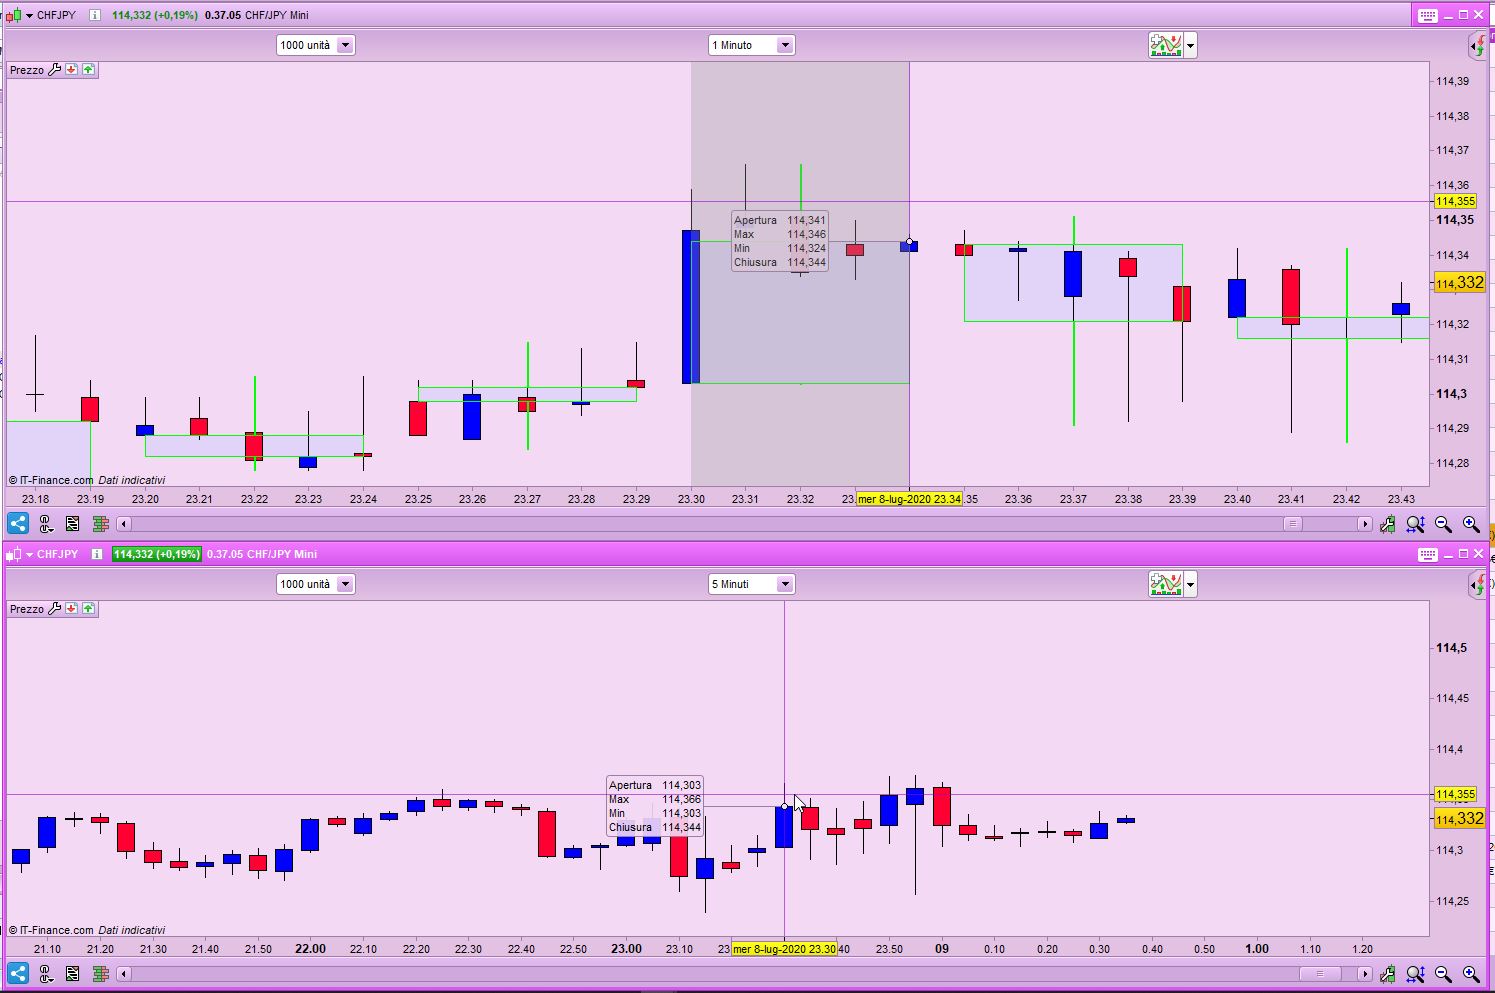
Is it possible to display the 5 minute candlestick in the 1 minute chart under Pro Realtime as shown in the picture?
Not possible with a default indicator, should be made with a custom code.
RazzParticipant
Master
Hello Nicolas Thank you for your answer.
This is an indicator that does what you are asking, but plots the 5-minute bar when ALL 5 1-minute bars have closed.
This is for v10.3+. If you have access to v11 you can also change the filling colour of the rectangle.
C5 = close
If OpenMinute MOD 5 = 0 Then //Reset variables each new 5-minute bar
   O5 = open
   H5 = high
   L5 = low
Else
   H5 = max(H5,high)
   L5 = min(L5,low)
Endif
If OpenMinute MOD 5 = 4 Then  //plot only when the 5-minute bar closes
   Drawrectangle(BarIndex - 4,O5,BarIndex,C5)             Coloured(0,255,0,255)   //Body
   DrawRectangle(BarIndex - 2,max(O5,C5),BarIndex - 2,H5) Coloured(0,255,0,255)   //Upper Wick
   DrawRectangle(BarIndex - 2,min(O5,C5),BarIndex - 2,L5) Coloured(0,255,0,255)   //Lower Wick
Endif
Return
RazzParticipant
Master
C5 = close
If OpenMinute MOD 5 = 0 Then //Reset variables each new 5-minute bar
O5 = open
H5 = high
L5 = low
Else
H5 = max(H5,high)
L5 = min(L5,low)
Endif

If c5<o5 then
r=255
g=0
b=0
else
r=0
g=255
b=0
endif

If OpenMinute MOD 5 = 4 Then  //plot only when the 5-minute bar closes
Drawrectangle(BarIndex - 4,O5,BarIndex,C5)             Coloured(r,g,b,255)   //Body
DrawRectangle(BarIndex - 2,max(O5,C5),BarIndex - 2,H5) Coloured(r,g,b,255)   //Upper Wick
DrawRectangle(BarIndex - 2,min(O5,C5),BarIndex - 2,L5) Coloured(r,g,b,255)   //Lower Wick
Endif
Return
Hello robertogozzi Thank you very much for your work, I would not have thought of it. I added the color change. Thanks again
in V11, you can now access easily the OHLC values with the ease of the MTF instruction for indicators!
timeframe(5 minutes)
open5 = open
high5 = high
low5 = low
close5 = close

timeframe(default)
//build here your rectangle with the 5-minutes OHLC variables ^
RazzParticipant
Master
Hello Nicolas Thank you for your answer because I am a customer of IG it will probably be a while until V11 is available. Robertogozzi was so nice and once again helped me very well.
Possible to make the Drawrectangle with thicker boarder?
Hi, to make thicker edge on rectangles, add style(line,2) at the end (or 3 for even thicker, 4 or 5 work too, but not 6 and above), example:
DrawRectangle(BarIndex - 2,max(O5,C5),BarIndex - 2,H5) Coloured(r,g,b,255) style(line,2)
RazzParticipant
Master
Guten Morgen
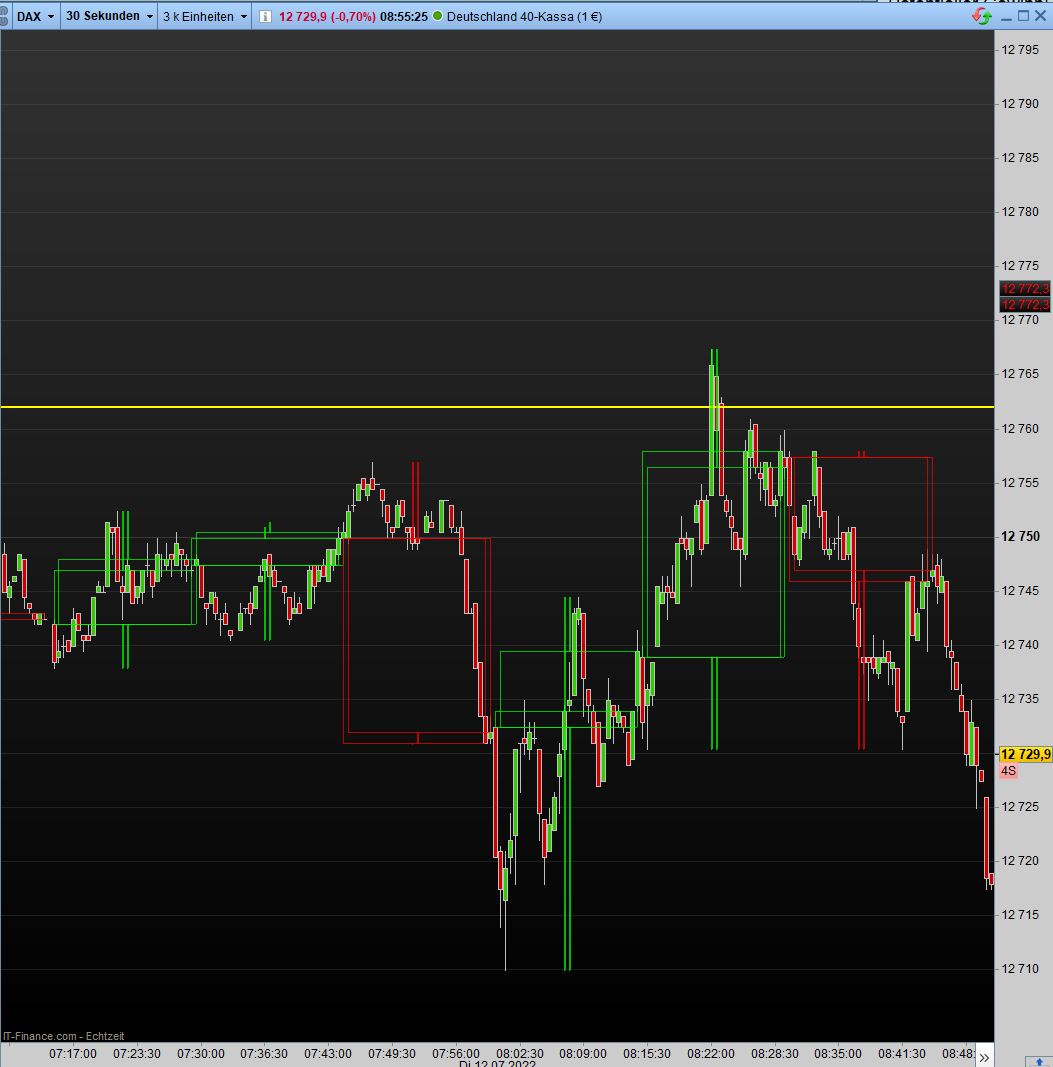
Kann wie müsste der Code aussehen wenn Ich im 30 sek Chart die 15 Min Kerze sehen will ?
Irgenwie bekomme Ich das nicht hin .
Im vorraus Vielen Dan
Good morning
Can the code look like if I want to see the 15-minute candle in the 30-second chart?
Somehow I can’t do that. In Advance
thank you
Only post in the language of the forumthat you are posting in. For example English only in the English speaking forums and French only in the French speaking forums.
Thank you 🙂
Use Nicolas’code (https://www.prorealcode.com/topic/show-5-minute-candlestick-in-1-minute-chart/#post-138819) and replace 5 minutes with 15.
You can apply it on your preferred timeframe.
RazzParticipant
Master
Good morning Yes, unfortunately that doesn’t seem to work, but 2 candles are always drawn every 15 minutes
timeframe(15 minutes)

C5 = close
O5 = open
H5 = high
L5 = low

If c5<o5 then
r=255
g=0
b=0
else
r=0
g=255
b=0
endif
timeframe(default)
If OpenMinute MOD 15 = 14 Then  //plot only when the 15-minute bar closes
Drawrectangle(BarIndex - 28,O5,BarIndex,C5)             Coloured(r,g,b,180)style(line,1) //Body  /style Line 2 = Dicke
DrawRectangle(BarIndex - 14,max(O5,C5),BarIndex - 14,H5) Coloured(r,g,b,180)style(line,1)   //Upper Wick
DrawRectangle(BarIndex - 14,min(O5,C5),BarIndex - 14,L5) Coloured(r,g,b,180)style(line,1)  //Lower Wick
Endif
Return
That seems to work:
timeframe(15 minutes,updateonclose)
ONCE ID = 0
ID = ID + 1
//
C5 = close
O5 = open
H5 = high
L5 = low

If c5<o5 then
   r=255
   g=0
   b=0
else
   r=0
   g=255
   b=0
endif
timeframe(default)
ONCE PlotCandle = 0
IF ID <> ID[1] THEN
   Drawrectangle(BarIndex - 29,O5,BarIndex,C5)              Coloured(r,g,b,180)style(line,1) //Body  /style Line 2 = Dicke
   DrawRectangle(BarIndex - 14,max(O5,C5),BarIndex - 14,H5) Coloured(r,g,b,180)style(line,1)   //Upper Wick
   DrawRectangle(BarIndex - 14,min(O5,C5),BarIndex - 14,L5) Coloured(r,g,b,180)style(line,1)  //Lower Wick
ENDIF
Return
Hi…
Just be aware, the code above, let’s say under a 3-5m timeframe and low market activity, may affect the position of the 15m candle’s . To be more specific the left hand, open side, of the candles body. Since your using this on 30s timeframe the probability of this happening is greatly increased.
However depending on how critical your using it , and if not at time’s of low market activity this is decreased but no totally. And even if it does arise may not be significant to worry about. It may not be a problem to you and you could ignore it but I thought I should mention it.
Unfortunately this doesn’t seem like a quick fix. Recognized problem because I came across it on something I’m still working on.
Though I can’t offer a solution at this time, adding the Line of code below just before RETURN can give indication of when this problem is happening.
The line displays a row of ‘x’ ‘s at the bottom of the indicator panel, if there’s a gap, a missing ‘x’ then the open/left side of the candle will be drawn out of position, to the left, by the number of missing ‘x’ ‘ s underneath that 15m candle’s real position.
drawtext("x",barindex,6)anchor(bottomLeft,index,yShift)
The position of the candles is affected by lines 22-24, this is specific to 30 seconds, if you use a 3-minute TF, then those values should be 4, 2, 2 instead of 29, 14, 14.