Hi guys,
I just finished reviewing this system, and everything looks good to me, so I wanted to share with you and know your opinion.
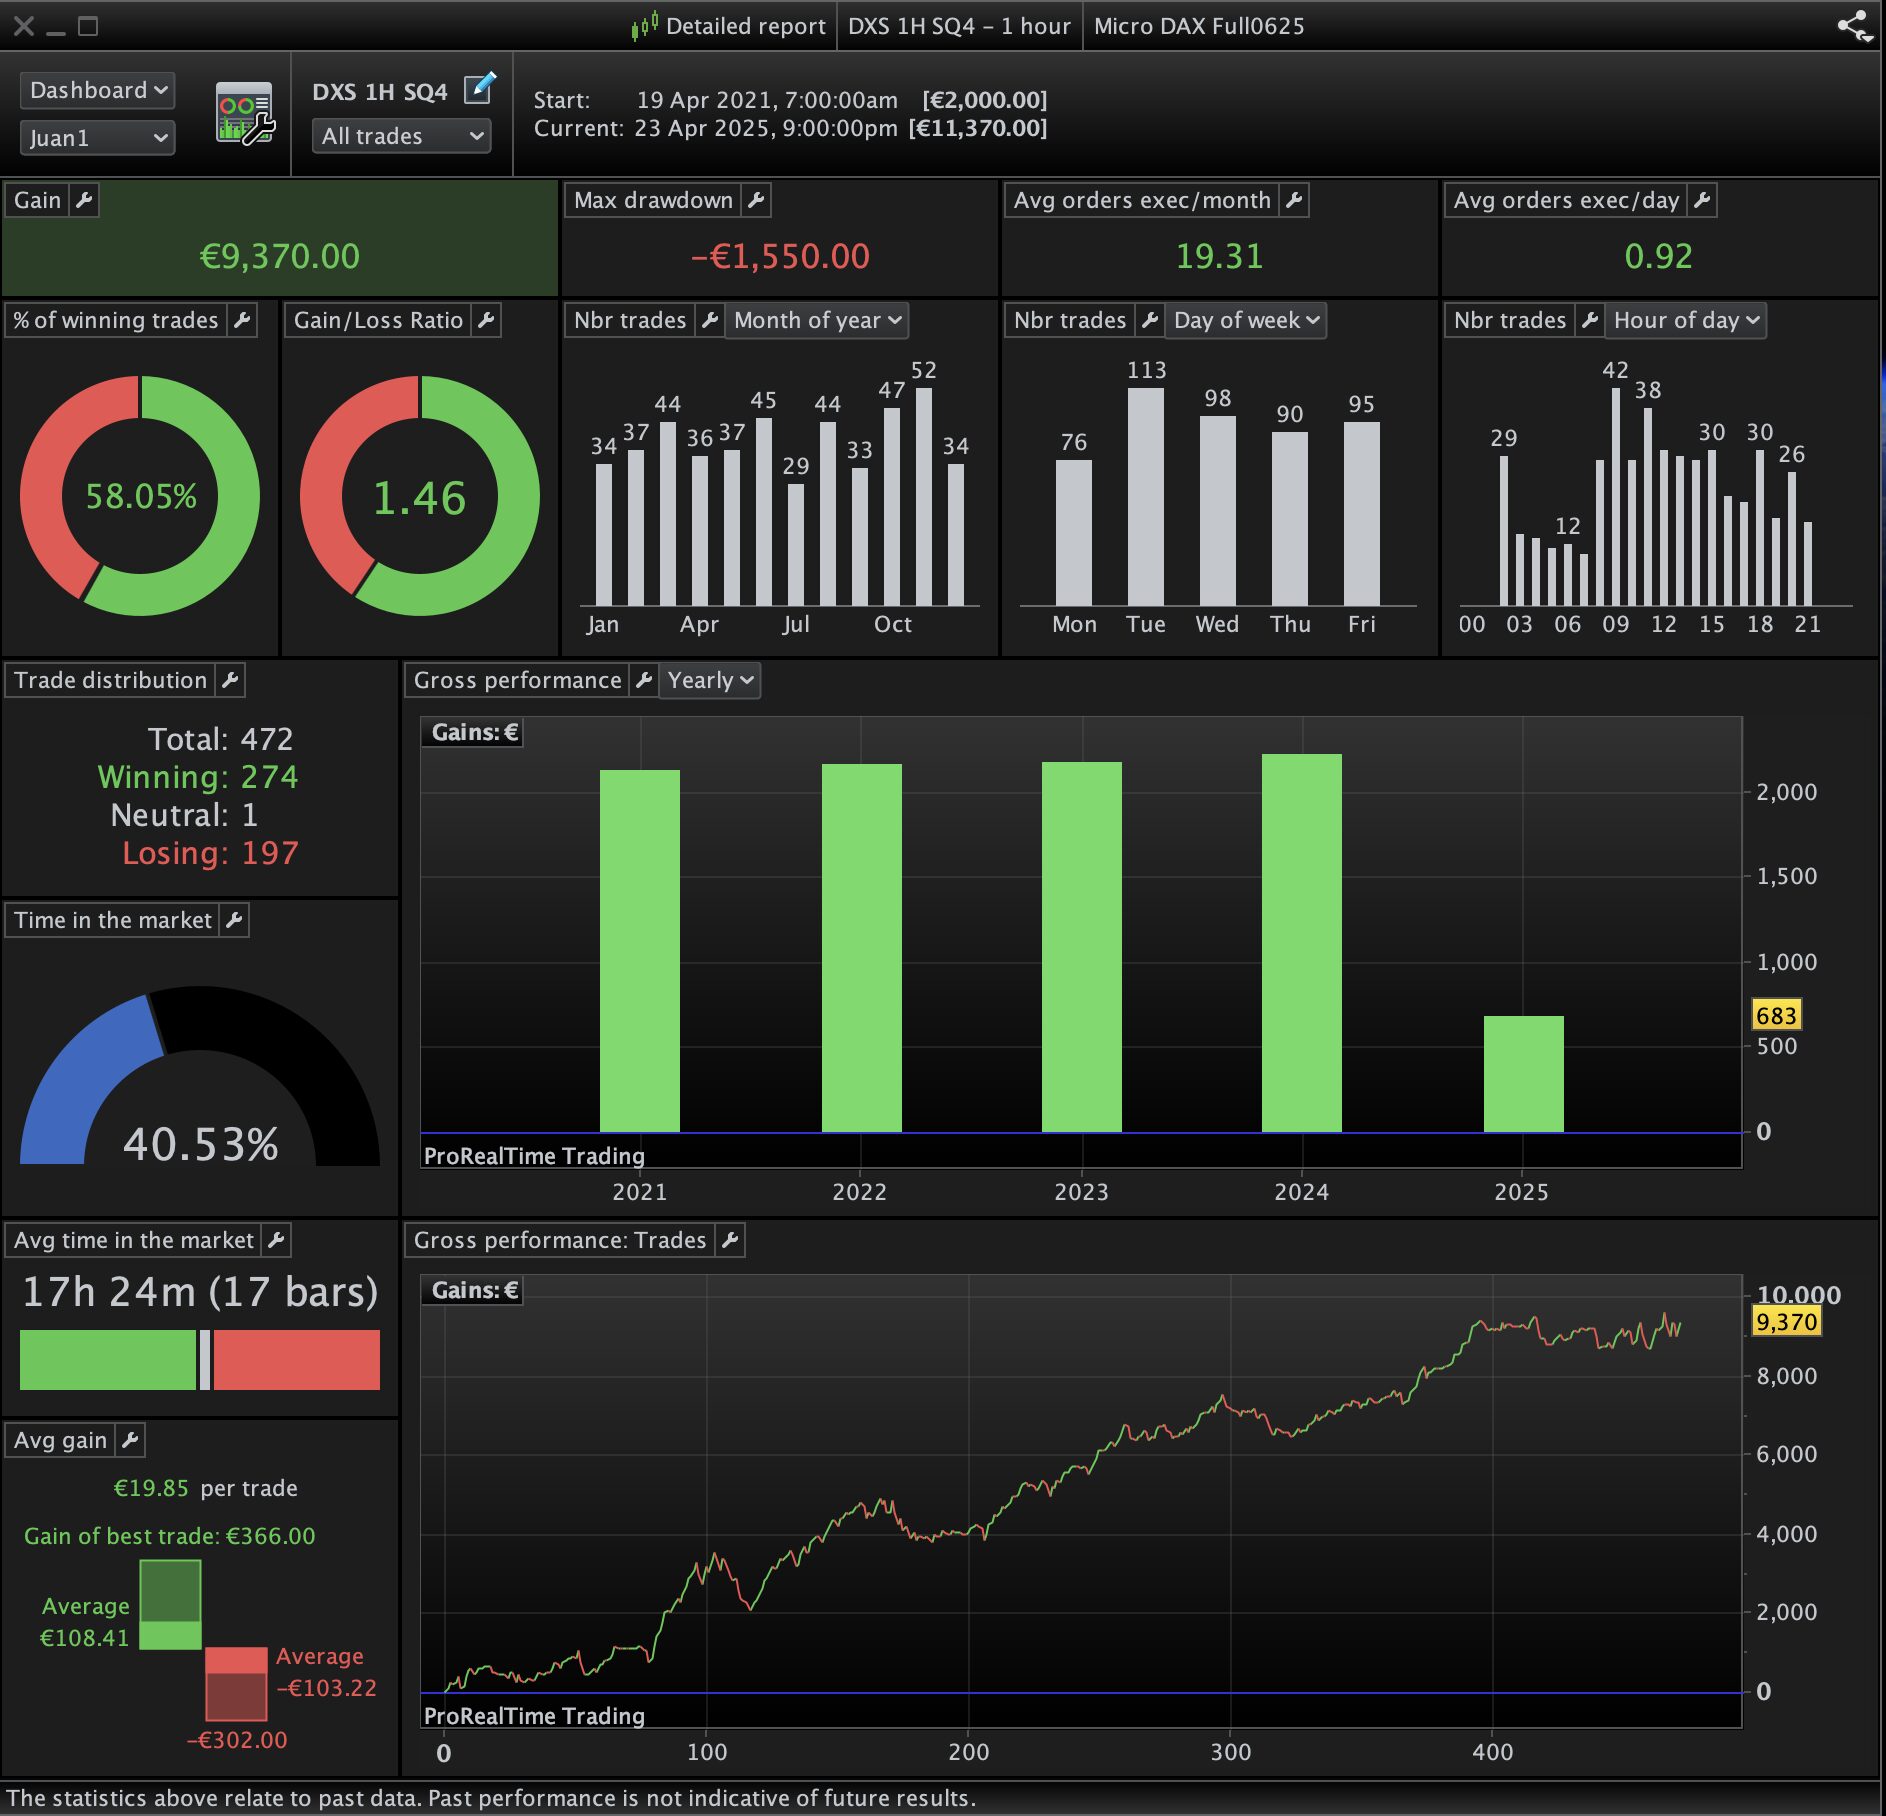
It is being difficult to me to find systems due Im dedication to each system 2000 USD, with risk per trade around 1.5-2%.
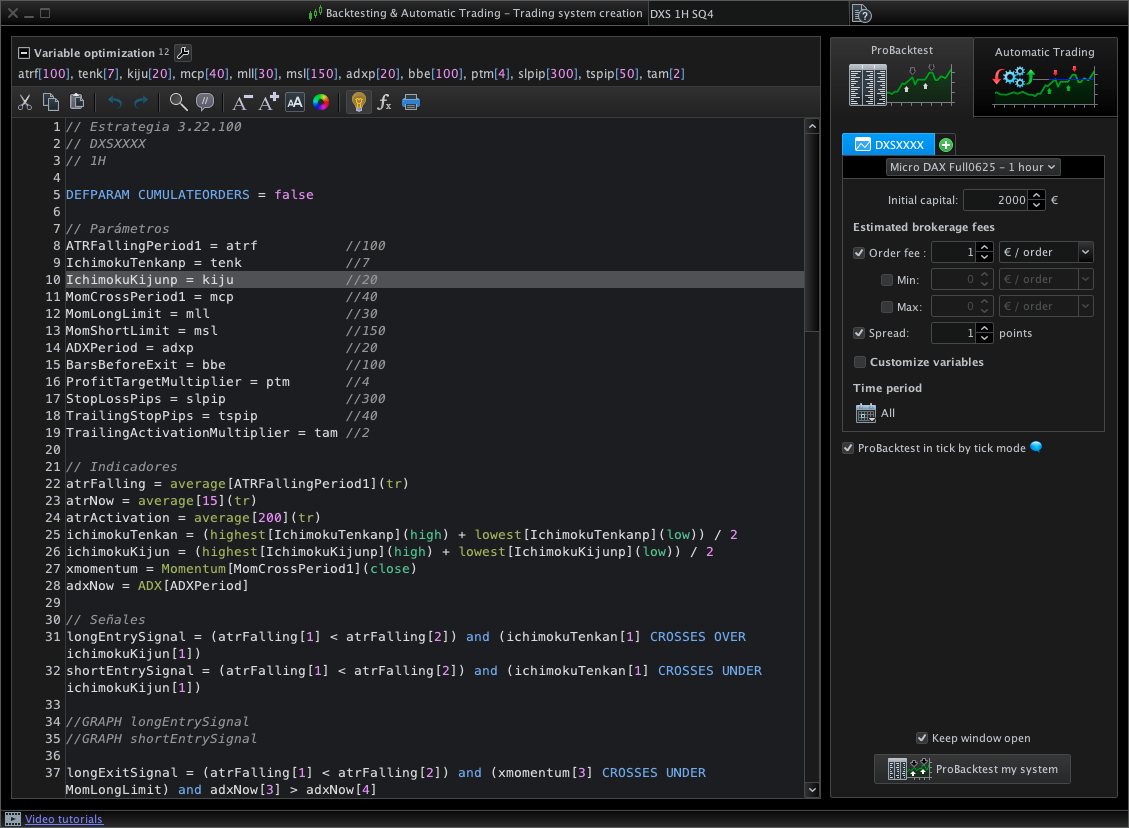
Apparently this one comply with my requirements, but I suspect that due to the high number of paramethers it may be overfitted. More than WF test, is there any other robustness test we can do with PRT?
// Estrategia 3.22.100
// DXSXXXX
// 1H

DEFPARAM CUMULATEORDERS = false

// Parámetros
ATRFallingPeriod1 = atrf           //100
IchimokuTenkanp = tenk             //7
IchimokuKijunp = kiju              //20
MomCrossPeriod1 = mcp              //40
MomLongLimit = mll                 //30
MomShortLimit = msl                //150
ADXPeriod = adxp                   //20
BarsBeforeExit = bbe               //100
ProfitTargetMultiplier = ptm       //4
StopLossPips = slpip               //300
TrailingStopPips = tspip           //40
TrailingActivationMultiplier = tam //2

// Indicadores
atrFalling = average[ATRFallingPeriod1](tr)
atrNow = average[15](tr)
atrActivation = average[200](tr)
ichimokuTenkan = (highest[IchimokuTenkanp](high) + lowest[IchimokuTenkanp](low)) / 2
ichimokuKijun = (highest[IchimokuKijunp](high) + lowest[IchimokuKijunp](low)) / 2
xmomentum = Momentum[MomCrossPeriod1](close)
adxNow = ADX[ADXPeriod]

// Señales
longEntrySignal = (atrFalling[1] < atrFalling[2]) and (ichimokuTenkan[1] CROSSES OVER ichimokuKijun[1])
shortEntrySignal = (atrFalling[1] < atrFalling[2]) and (ichimokuTenkan[1] CROSSES UNDER ichimokuKijun[1])

//GRAPH longEntrySignal
//GRAPH shortEntrySignal

longExitSignal = (atrFalling[1] < atrFalling[2]) and (xmomentum[3] CROSSES UNDER MomLongLimit) and adxNow[3] > adxNow[4]
shortExitSignal = (atrFalling[1] < atrFalling[2]) and(xmomentum[3] CROSSES OVER MomShortLimit) and adxNow[3] > adxNow[4]

//GRAPH longExitSignal
//GRAPH shortExitSignal

// ======= EJECUCIÓN DE ÓRDENES =======
// Entradas Largas
if longEntrySignal then
slPoints = StopLossPips * pointvalue
tpPoints = ProfitTargetMultiplier * atrNow
buy 1 contract at market
set stop ploss slPoints
set target pprofit tpPoints
entryBarIndex = barindex
//GRAPHONPRICE TRADEPRICE - slPoints
endif

// Entradas Cortas
if shortEntrySignal and not longEntrySignal then
slPoints = StopLossPips * pointvalue
tpPoints = ProfitTargetMultiplier * atrNow
sellshort 1 contract at market
set stop ploss slPoints
set target pprofit tpPoints
entryBarIndex = barindex
//GRAPHONPRICE TRADEPRICE - slPoints
endif

//GRAPH barindex - TRADEINDEX
//GRAPHONPRICE TRADEPRICE + slPoints

// ======= SALIDAS MANUALES POR CONDICIONES =======
if longonmarket then
// Salida por condición técnica
if longExitSignal and not longEntrySignal then
sell at market
endif

// Salida por tiempo
if barindex - tradeindex = BarsBeforeExit then
sell at market
endif

// Trailing dinámico
runningProfit = close - tradeprice[1]
activationLevel = TrailingActivationMultiplier * atrActivation
//GRAPH runningProfit
//GRAPH activationLevel
trailingDistance = TrailingStopPips * pointvalue
//GRAPH trailingDistance

if runningProfit > activationLevel then
newStopLong = close - trailingDistance
if newStopLong > tradeprice[1] then
sell at newStopLong stop
endif
endif
endif

if shortonmarket then
// Salida por condición técnica
if shortExitSignal and not shortEntrySignal then
exitshort at market
endif

// Salida por tiempo
if barindex - tradeindex = BarsBeforeExit then
exitshort at market
endif

// Trailing dinámico
runningProfit = tradeprice(1) - close
activationLevel = TrailingActivationMultiplier * atrActivation
trailingDistance = TrailingStopPips * pointvalue

if runningProfit > activationLevel then
newStopShort = close + trailingDistance
if newStopShort < tradeprice(1) then
exitshort at newStopShort stop
endif
endif
endif
Trying to collaborate at the same time that learning.
Thank you guys!
is there any other robustness test we can do with PRT?
You could try Monte-Carlo Testing.
Monte Carlo Analysis
If you not want to read all the posts, after you get a flavour, read from the most recent post backwards.
Let us know how you get on.
You could try Monte-Carlo Testing.
https://www.prorealcode.com/topic/monte-carlo-analysis/
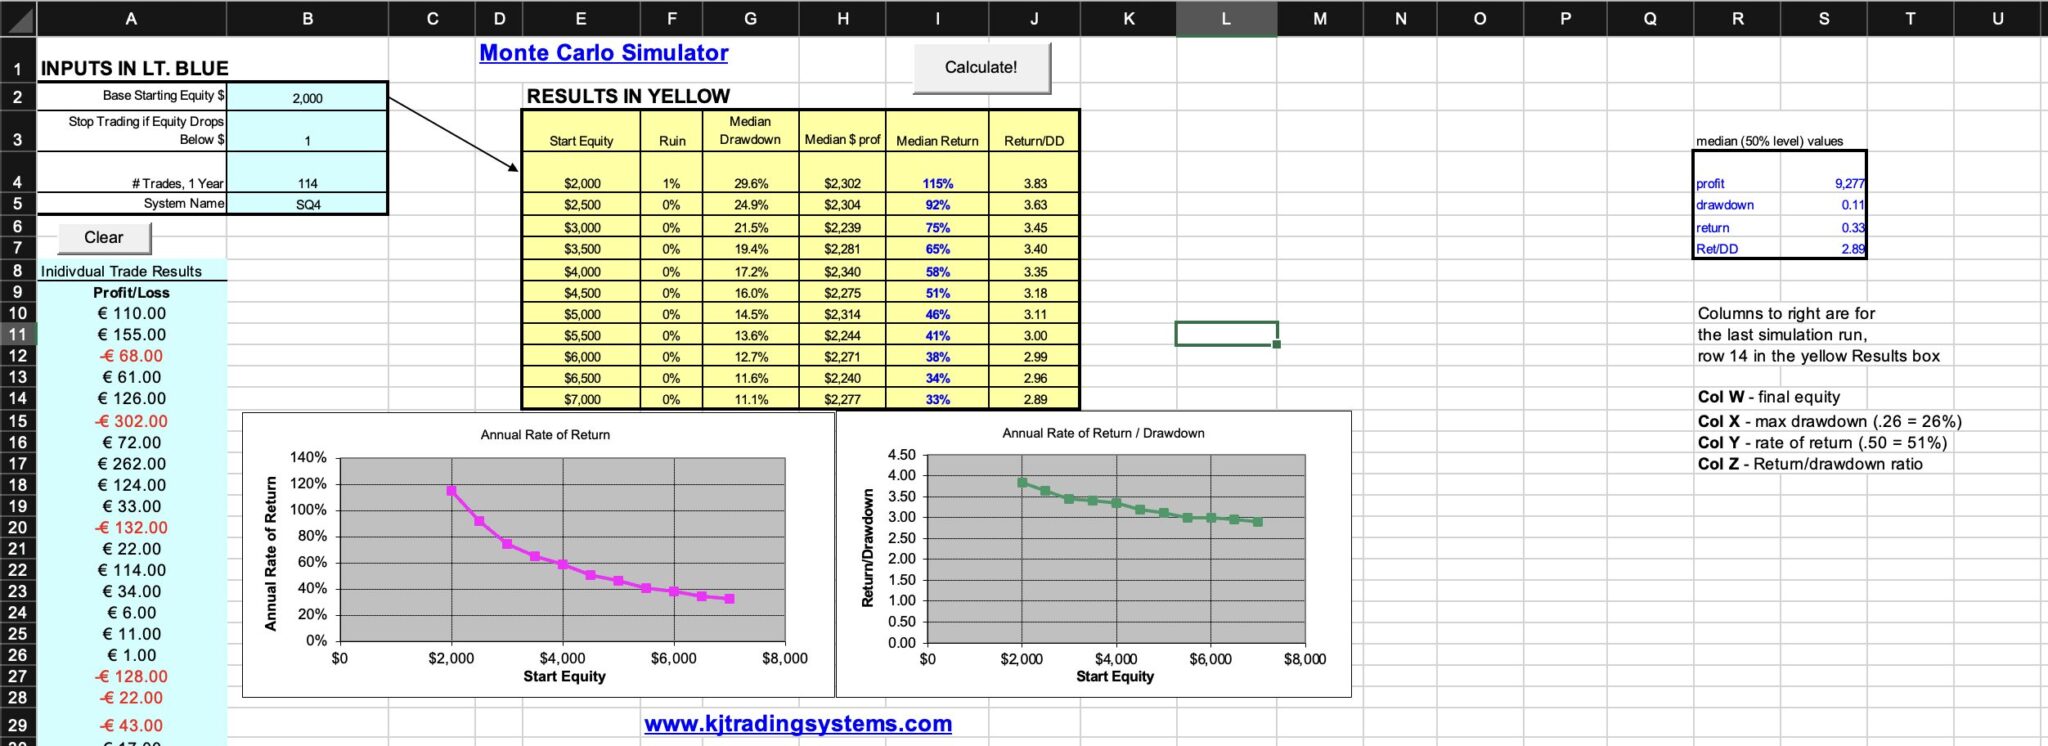
I tested it with the excelsheet of khtradingsystems.com. It is fast and easy. However, dont know how to read some results.
MC is telling there is a chance of ruin about 1%. Is this reasonable ratio? Also, Return/DD ratio 3.83 doesnt look very good…
Additionally, I was thinking about it is better idea to avoid systems with long and shorts at the same time and analyse them independently, right?
Thank you @GraHal,
hi,
I have no clue what is generally best for testing robustness, and never in my life used montecarlo simulations, yet may I blabber a bit about robustnes still? in order to tell how I think and how I test it…
the more “degrees of freedom” = variables system has, the less robust it probably is. so one of my main targets when designing a system is to reduce variables to some very painful minimum. it lead in the deep past to the conclusion that I have to skip all commonly known “indicators” (and don’t develop some on my own instead 🙂 ). but since you are using them, you can still do something like this: remove just one of them from algo and watch how drastically algo’s performance changes. if it does not change drastically, you might skip it fully. and same way you check all others, one by one, all indicators – which are always a variable, but also other variables which are not based on indicators (can be stoploss/target(if not based on indicator) or time or whatever). second step: for variables I decide still to keep, I use PRT’s “optimization” tool – not so much for squeezing out “best ever” equity curve but more for testing out robustness: put one of the variables into “optimizer” and check how drastically results change. if small changes of parameter change results drastically, or if those small changes cause eratic changes in performance, then this variable (at least at tested interval of its values) I consider as one “killing” the robustnes. that might be good reason either to use completely different levels of particular variable – or to remove that variable from algo.
have fun!
justisan