Hi,
I’m trying to build or find an indicator that will allow high and lows to be indicated within a specific time frame.
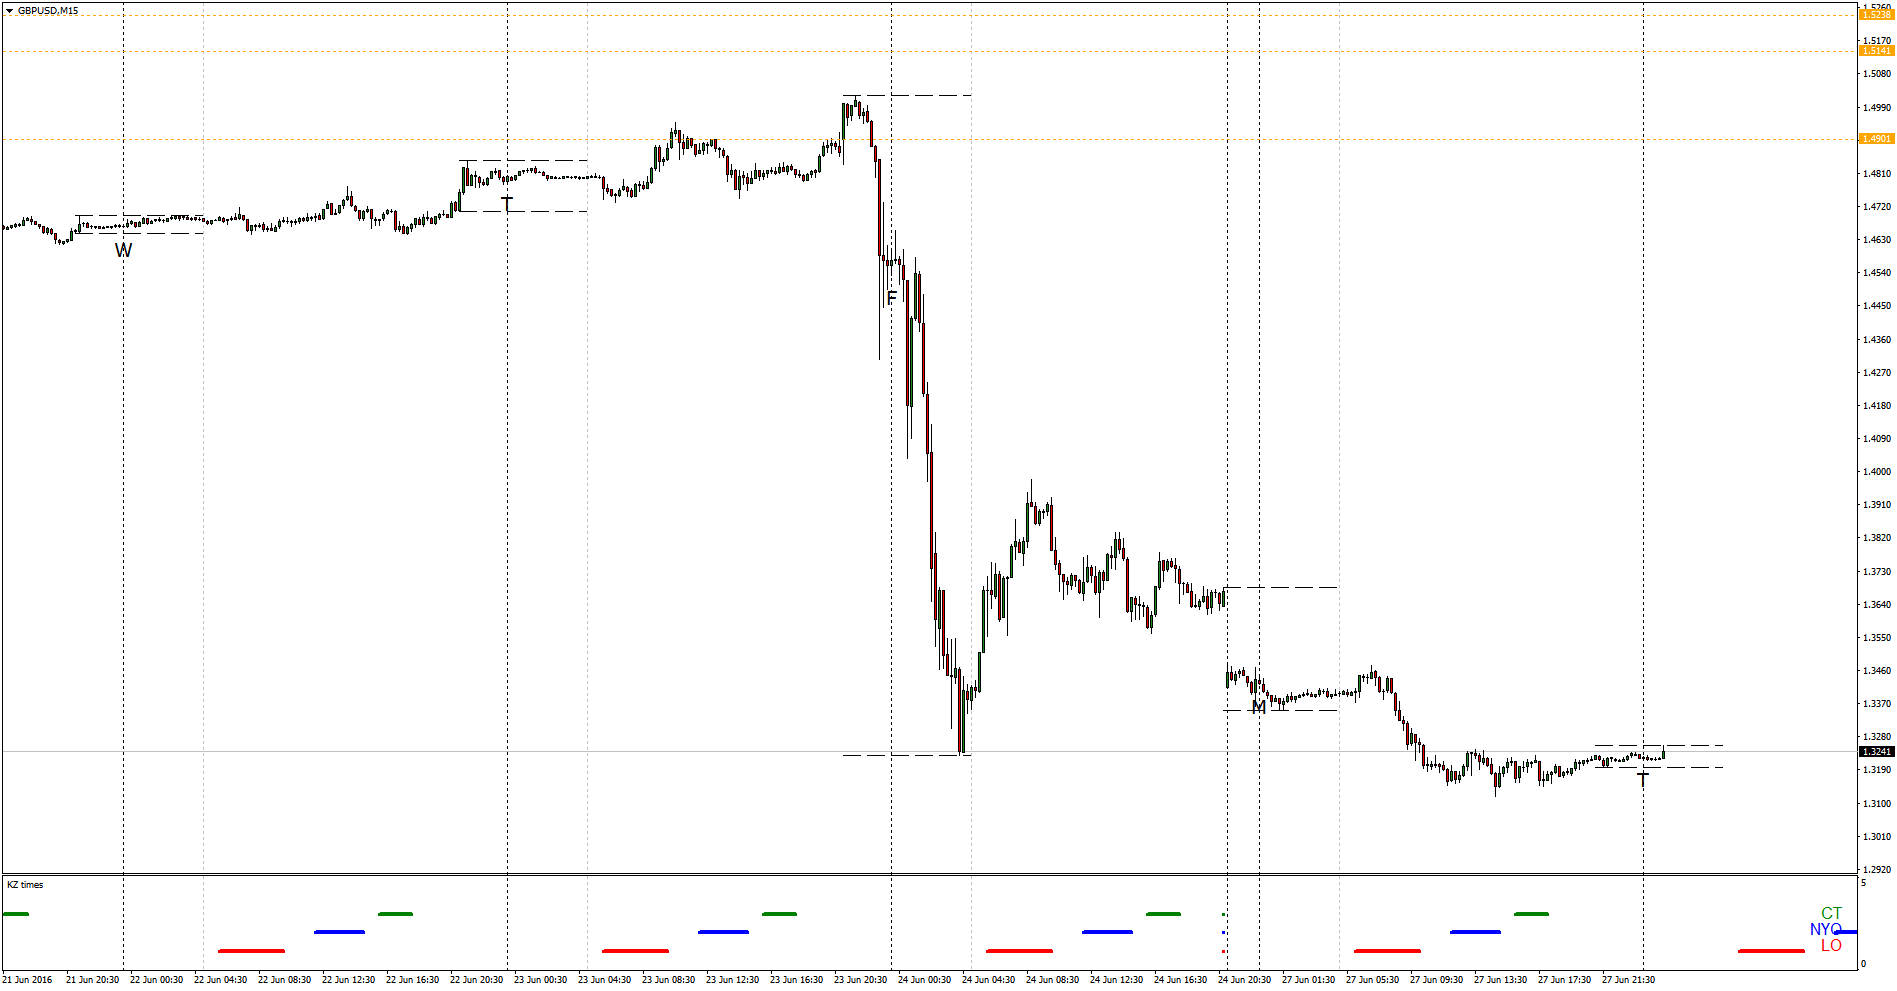
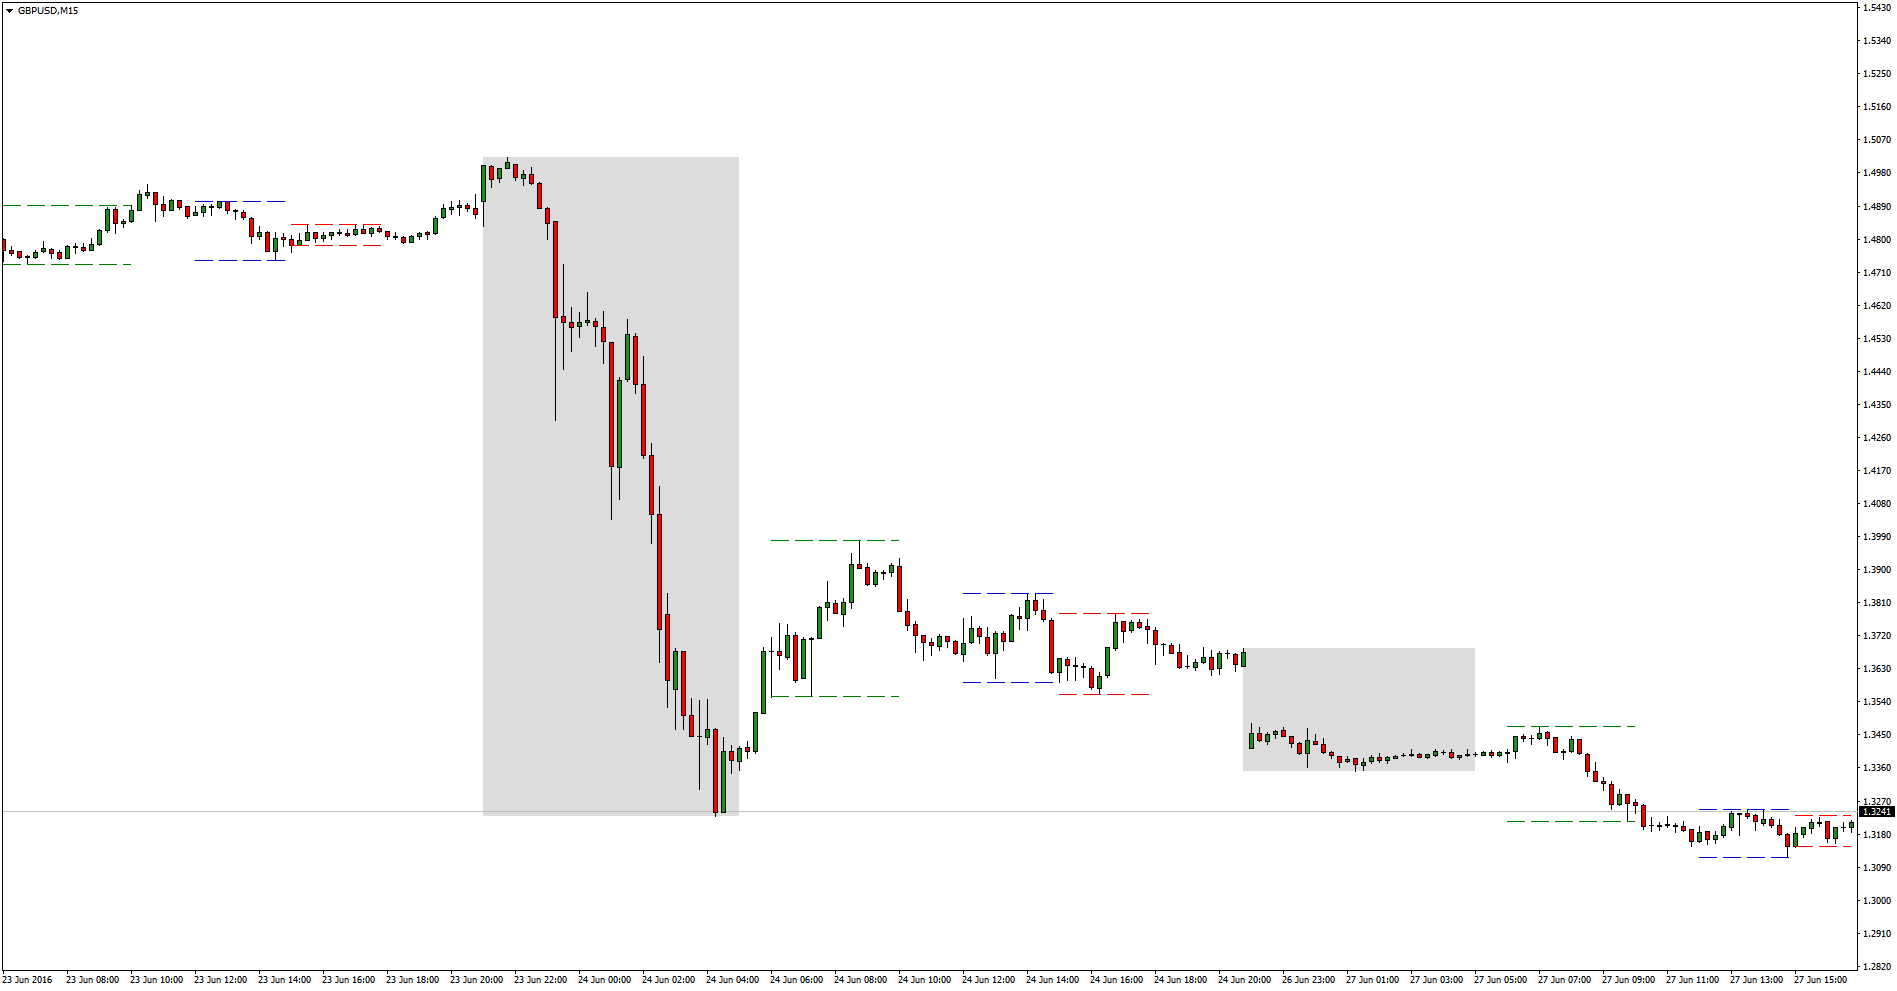
I have attached 2 images of examples I have with my MT4 platform but its inconvinent for me as I have to have 2 platforms open one for setup and another for trading. I would rather have everything on the one platform.
The sessions are as follows
0600-1000
1200-1500
1600-1800
2100-0500
If this can be done and its not too much trouble to do I would greatly appreciate it otherwise I may have to stop using PRT and find a different broker 🙁
Thanks for reading
Hi Saigp,
Are you looking for the indicator to look back at the previous session times, or treat the high and low in isolation for each session time ?
Cheers
Hi,
Thanks for getting back to me.
I think the answer is both lol. I would like to see history of previous session highs and lows, where the highs and lows are isolated for each session.
For me price is the only indicator I use. I just want the platform to make it visually easier for me to see each session (intraday) high and low.
In Example 1 above the MT4 platform allows me to use 2 indicators. 1 allows me to block out price in the asian session, the second at the bottom just highlights session times.
In Example 2, all the session times are all highlighted on the chart, with horizontal line segmant at the highs and lows of the session
It doesnt have to look the same as above if not lines then boxes or timezones it doesnt matter as long as I can highlight the beginning and ending of each session.
Thanks
Something like this ?
//DEVELOPMENT & GRAPH AREA ******************************************
Session1TimeStart = 060000
Session1TimeClose = 100000
Session2TimeStart = 120000
Session2TimeClose = 150000
Session3TimeStart = 160000
Session3TimeClose = 180000
Session4TimeStart = 210000
Session4TimeClose = 050000

if time > Session1TimeStart and time < Session1TimeClose then
S1high = dhigh(0)
S1low = dlow(0)
endif

if time > Session2TimeStart and time < Session2TimeClose then
S2high = dhigh(0)
S2low = dlow(0)
endif

if time > Session3TimeStart and time < Session3TimeClose then
S3high = dhigh(0)
S3low = dlow(0)
endif

if time > Session4TimeStart and time < Session4TimeClose then
S4high = dhigh(0)
S4low = dlow(0)
endif

graph S1high coloured (200,0,0) as "s1high"
graph S1low coloured (200,0,0) as "S1low"
graph S2high coloured (0,200,0) as "S2high"
graph S2low coloured (0,200,0) as "S2low"
graph S3high coloured (0,50,50) as "S3high"
graph S3low coloured (0,50,50) as "S3low"
graph S4high coloured (0,0,200) as "S4high"
graph S4low coloured (0,0,200) as "S4low"
The above is incorrect. 🙂
Let me work on something
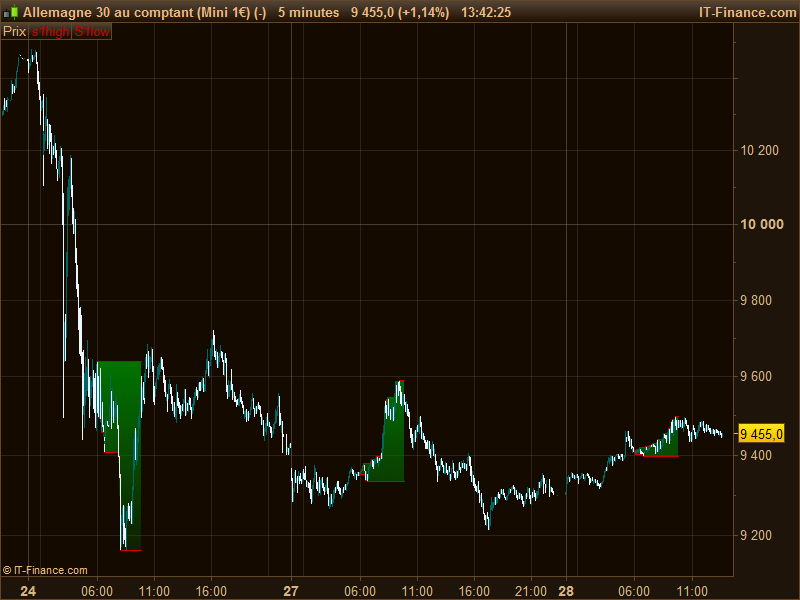
Or maybe like this? (maximum/minimum between 2 hours are something often asked, I always have this kind of code ready to be copy/paste 🙂 )
Session1TimeStart = 060000
Session1TimeClose = 100000

if intradaybarindex=0 then
 S1low=Dopen(0)
 S1high=Dopen(0)
endif

if time > Session1TimeStart and time < Session1TimeClose then
 S1high = MAX(S1high,high)
 S1low = MIN(S1low,low)
else
 S1high = 0
 S1low = Dopen(0)*100
endif

RETURN S1high coloured (200,0,0) as "s1high", S1low coloured (200,0,0) as "S1low"
Change drawing values to point mode and add colour fill between them.
Hi Nicholas,
I cant get it to work the chart goes all funny lol.
Do I just create a new indicator and paste the code in apply it to price??
Sai
The code I gave is an example and must be completed by all the time sessions you want. Or you can create 3 same one with different SessionTimeStart and SessionTimeEnd.
Yes, you just need to add this indicator on price and “Change drawing values to point mode and add colour fill between them.”
Make sure Vertical autoscaling: use price only is ticked on the charts Price chart panel properties (wrench icon top left of the chart) and that you’ve unticked the necessary Colour Zone for the indicator
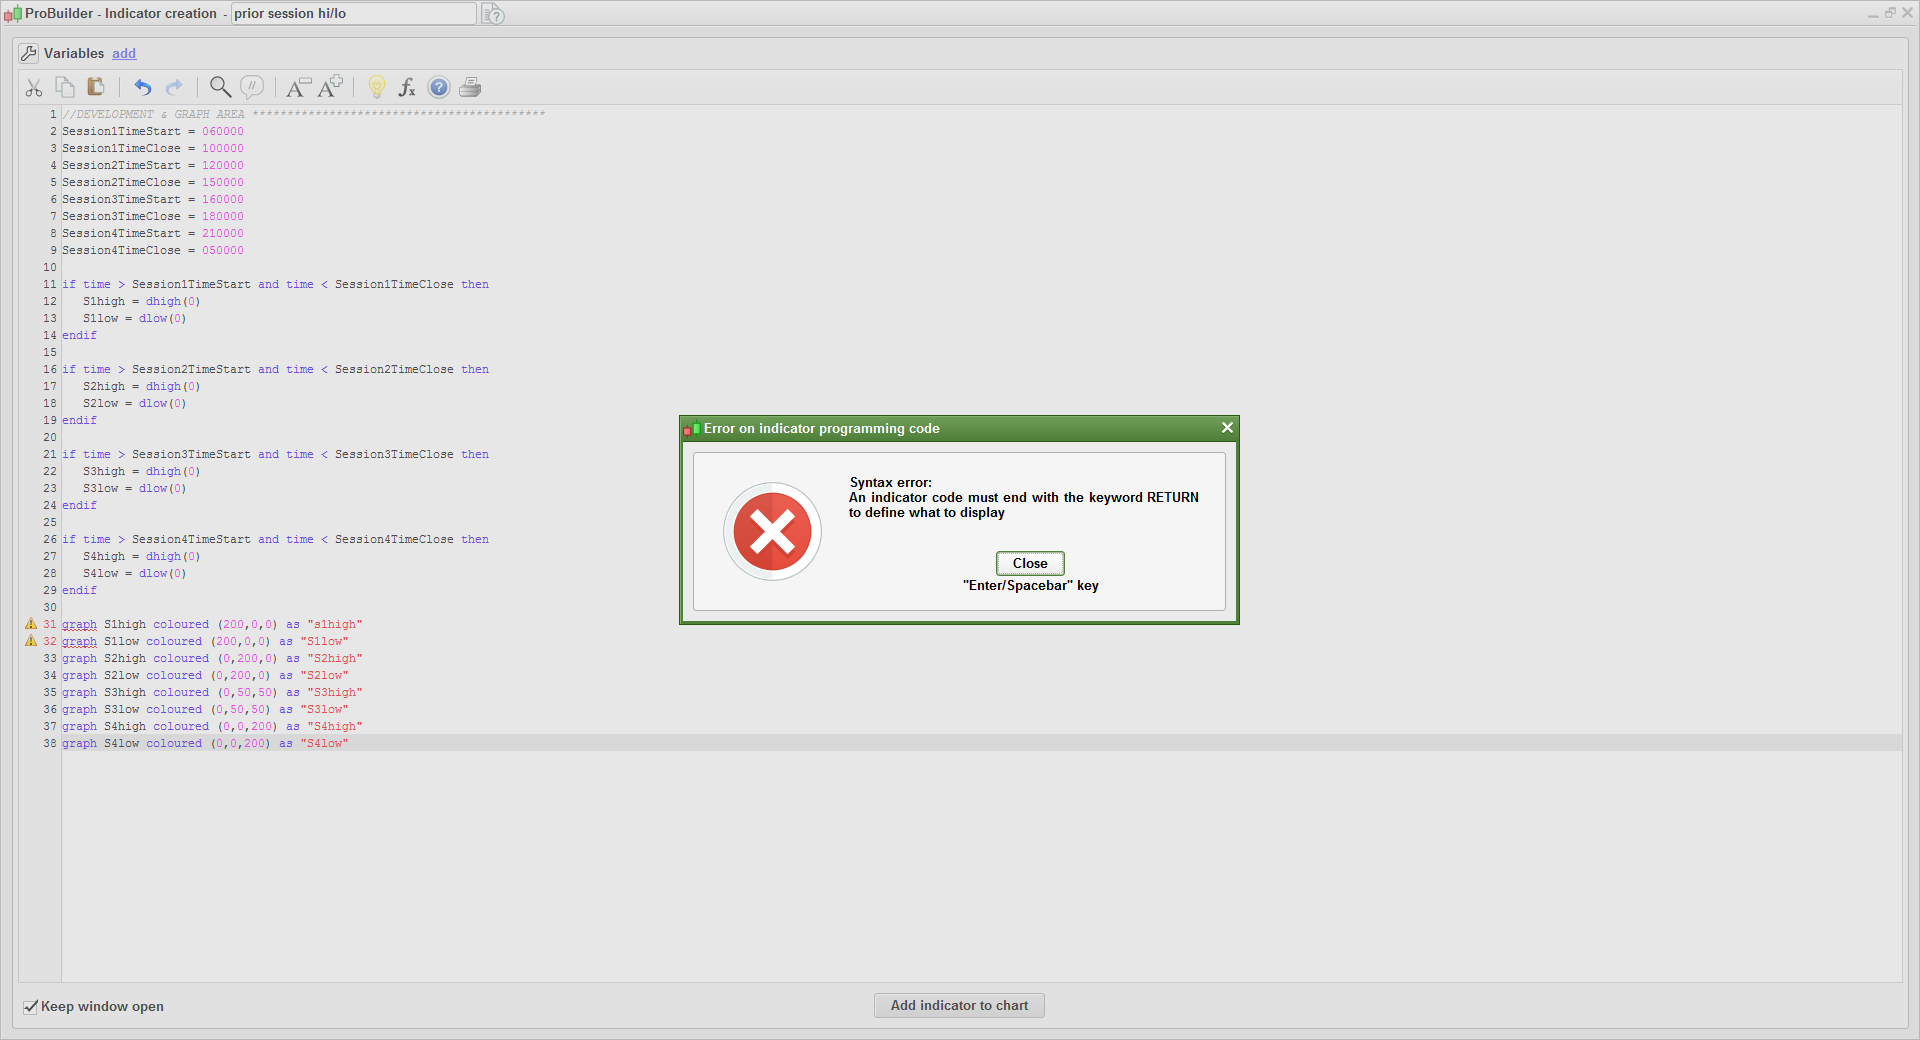
Tried to add code to new indicator, but getting programming error saying : an indicator code must end with the keyword RETURN to define what ti display.
The code you have copy/paste is not an indicator, but part of an automatic trading strategy (proorder program).
Ok, So how can I get this indicator for my charts.
Darragh
With this modified code instead, converted to an indicator:
//DEVELOPMENT & GRAPH AREA ******************************************
Session1TimeStart = 060000
Session1TimeClose = 100000
Session2TimeStart = 120000
Session2TimeClose = 150000
Session3TimeStart = 160000
Session3TimeClose = 180000
Session4TimeStart = 210000
Session4TimeClose = 050000

if time > Session1TimeStart and time < Session1TimeClose then
S1high = dhigh(0)
S1low = dlow(0)
endif

if time > Session2TimeStart and time < Session2TimeClose then
S2high = dhigh(0)
S2low = dlow(0)
endif

if time > Session3TimeStart and time < Session3TimeClose then
S3high = dhigh(0)
S3low = dlow(0)
endif

if time > Session4TimeStart and time < Session4TimeClose then
S4high = dhigh(0)
S4low = dlow(0)
endif

return S1high coloured (200,0,0) as "s1high", S1low coloured (200,0,0) as "S1low"
,S2high coloured (0,200,0) as "S2high",S2low coloured (0,200,0) as "S2low",S3high coloured (0,50,50) as "S3high"
,S3low coloured (0,50,50) as "S3low",S4high coloured (0,0,200) as "S4high",S4low coloured (0,0,200) as "S4low"
still not working, where exactly do I need to copy and paste it too.
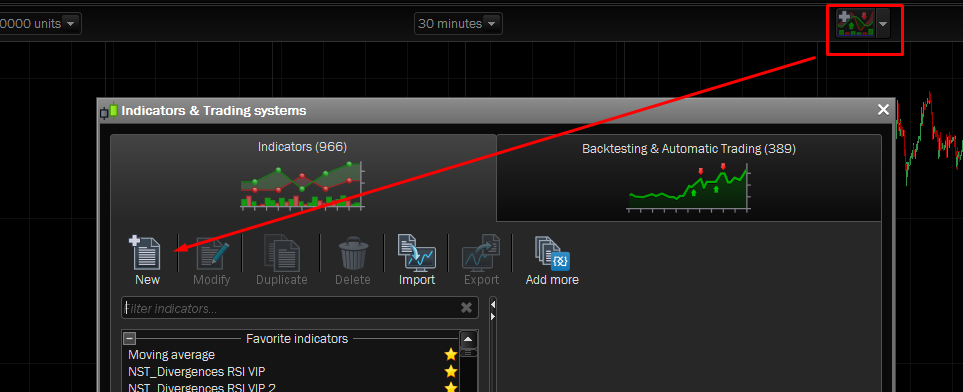
❓ Just make a new indicator with the indicator tool.